Stochastic lattice gas model describing the dynamics of an epidemic
Abstract
We study a stochastic process describing the onset of spreading dynamics of an epidemic in a population composed by individuals of three classes: susceptible (S), infected (I), and recovered (R). The stochastic process is defined by local rules and involves the following cyclic process: SIRS (SIRS). The open process SIR (SIR) is studied as a particular case of the SIRS process. The epidemic process is analyzed at different levels of description: by a stochastic lattice gas model and by a birth and death process. By means of Monte Carlo simulations and dynamical mean-field approximations we show that the SIRS stochastic lattice gas model exhibit a line of critical points separating two phases: an absorbing phase where the lattice is completely full of S individuals and an active phase where S, I and R individuals coexist, which may or may not present population cycles. The critical line, that corresponds to the onset of epidemic spreading, is shown to belong in the directed percolation universality class. By considering the birth and death process we analyse the role of noise in stabilizing the oscillations.
PACS numbers: 87.10.Hk, 05.40.-a, 02.50.Ey
I Introduction
Among the several theoretical descriptions of population biology systems, the stochastic approach is one capable of revealing the ubiquitous fluctuations observed in these systems nisbet ; renshaw ; keel99 ; nisbet00 ; keel02 . Using a stochastic lattice gas model, we study here the dynamics of propagation of an epidemic in a population in which the individuals are separated into three classes determined by their relative states to a given disease: susceptible (S), infected (I) and recovered (R) individuals. One of the most well known models in this context is the so-called susceptible-infected-recovered (SIR) model nisbet ; renshaw ; keel99 ; nisbet00 ; keel02 ; ker ; hastings ; grass ; keel ; ara ; alonso ; caliri ; aiello , a model for an epidemic which occurs during a time interval that is much smaller then the lifetime of the host. It describes the spreading of an epidemic process occurring in a population initially composed by susceptible individuals that become infected by contact with infected individuals. Once infected the individuals can recover spontaneously becoming immune. An extension of the SIR model, to be considered here, is obtained by allowing the recovered individual to becoming susceptible. This extension is called susceptible-infected-recovered-susceptible (SIRS) model and will be the main concern of this paper. The SIR model will be then a particular case of the SIRS model.
The stochastic dynamics is studied on a two-dimensional lattice that represents the space where the individuals live. Each site of the lattice is occupied by just one individual that can be in one of the three states: susceptible (S), infected (I) or recovered (R). The stochastic rules are such that S becomes I by a catalytic reaction, I turns into R spontaneously, and R becomes S also spontaneously. By means of Monte Carlo simulations, dynamic mean-field approximations and also by means of Fokker-Planck and Langevin equations, we study the dynamics and the onset of an epidemic spreading. Our results show that the stationary states described by the SIRS stochastic lattice gas model, can be of two types: an absorbing (or inactive) state, where the lattice is fully covered by susceptible, and an active state. In the active state the processes of infection, recovering and loss of immunity are continuously occurring. The phase transitions that take place in this model are studied in detail, as well as the critical behavior, and critical exponents are obtained from Monte Carlo simulations. We remark that the transitions are nonequilibrium ones because the SIRS stochastic lattice gas model belongs to the class of models that are intrinsically irreversible. In other words, the dynamics do not obey detailed balance.
From the stochastic lattice gas model we derive a birth and death process for the numbers of individuals of each class and analyze relevant quantities to characterize the epidemic spreading such as the time correlation functions. We find that the SIRS model presents stochastic oscillations on a certain region of the space of parameters, inside the active region. These oscillations are better understood if the system is described by a Langevin equation from which it becomes clear that the amplitude of these oscillations decay as the system size increases and that the noise enhances the oscillations alonso ; morita ; boland ; lugo ; tome09 . The Fokker-Planck and the associate Langevin equations are derived from the birth and death process which in turn is obtained from the original SIRS stochastic lattice gas model. The derivation of the birth and death process is obtained by a contraction procedure in which the degrees of freedom is reduced to a few variables tome09 .
We have also analyzed the critical behavior of the model occurring around the transition from the active to the nonactive state. We find that the critical behavior places the SIRS but not the SIR model into the directed percolation (DirP) universality class. The critical behavior is obtained by determining the static and dynamic critical exponents by means of numerical simulations. The SIR stochastic lattice gas model studied here is shown to belong to a distinct class, namely the dynamic percolation (DynP) universality class in agreement with the conjecture by Grassberger grass .
II Stochastic lattice gas model
The SIRS stochastic lattice gas model is defined on a regular lattice of sites in which each site can be occupied by either one susceptible individual (state S), or one infected individual (state I), or one recovered individual (state R). The dynamics consists of three subprocesses: (1) I S I I, auto-catalytically; (2) I R, spontaneously; and (3) R S, spontaneously. At each time step a site is randomly chosen. (i) If the site is in the state S and there is at least one neighboring site in the state I then S becomes I with probability proportional to a parameter and the number of neighboring I sites; (ii) if the site is in state I it becomes R spontaneously with probability ; and (iii) if the site is in state R it becomes S spontaneously with probability .
At each site of a square lattice we attach a variable that takes the values 0, 1 or 2, according to whether the site is in the state R, S, or I, respectively. The allowed transitions of the states of a site are cyclic, that is, and the corresponding transition rate is given by
| (1) |
where denotes the whole microscopic configuration, denotes the Kronecker delta, the summation is over the nearest neighbours of site and , and are parameters related to the subprocesses (i), (ii) and (iii) described above. The transition rates of the SIR model is regarded as a particular case of the SIRS transition rate given by equation (1), obtained by setting , which means that the subprocess (3) described above is suppressed.
The time evolution of the probability distribution at time obey the master equation
| (2) |
where the configuration is obtained from configuration by an anticyclic permutation of the state of site , that is, .
By rescaling time in the master equation it is always possible to reduce the three parameter of the model to just two. Thus we choose the parameters in such a way that so that , and can be interpreted as probabilities; this allows us to introduce a new parameter such that and are given by
| (3) |
where and .
| 0.00 | 0.1765(5) | 0.129(10) | 0.096(7) | 0,586(1) | 1,773(1) | 0,094(3) |
|---|---|---|---|---|---|---|
| DynP | 0.1389 | 0.1042 | 0.586 | 1.771 | 0.092 | |
| 0.025 | 0.19640(5) | 0.574(13) | 0.806(11) | 0.22(2) | 1.2(1) | 0.42(3) |
| 0.05 | 0.21355(5) | 0.56(2) | 0.805(14) | 0.232(7) | 1.163(7) | 0.424(15) |
| 0.10 | 0.23270(5) | 0.56(2) | 0.83(3) | 0.230(8) | 1.126(10) | 0.435(12) |
| 0.20 | 0.2377(1) | 0.56(2) | 0.81(2) | 0.227(2) | 1.132(2) | 0.446(2) |
| DirP | 0.583(4) | 0.795(10) | 0.2295(10) | 1.1325(10) | 0.4505(10) |
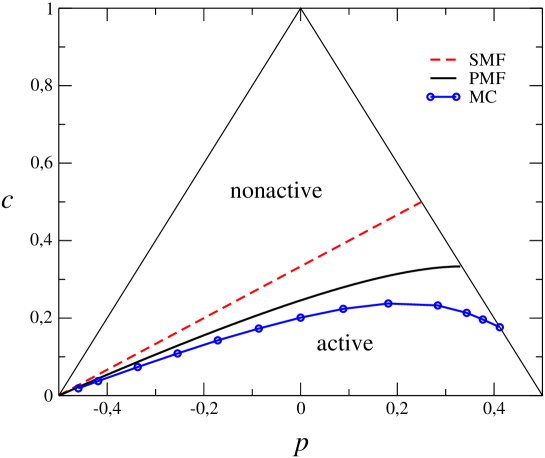
We have obtained the phase diagram of the SIRS stochastic lattice gas model defined on a regular square lattice by using Monte Carlo simulations. The phase diagram in the space of parameters and is shown in figure 1. The model exhibits an absorbing susceptible state and an active state where individuals are continuously changing their states. We have located the critical line separating the two phases and determined the dynamic and static critical exponents. Both are in agreement with the ones of the direct percolation universality class. The dynamic exponents were obtained by time dependent Monte Carlo simulations marro and the static exponents by Monte Carlo simulations performed on finite square lattices with a number of sites up to 256256. In the last case we have used a finite size scaling proposed in reference ttmj05 . Our best results for the exponents are given in table 1. Our estimates for the SIRS model () are in agreement with the ones for the directed percolation universality class dick .
For the SIR stochastic lattice gas model () we have used the same Monte Carlo procedures to determine the static and dynamic critical exponents. Our estimates of the exponents, shown in table 1, are in agreement with the ones related to the dynamic percolation universality class grass ; dick . We remark that the active phase of the SIR stochastic lattice gas model is characterized by infinitely many absorbing configurations. These absorbing configurations are reached when the number of infected individuals disappears.
It is worth mentioning that when the values of the parameters and are much smaller than and each other of the same order, corresponding to the region around the left corner of the triangular phase diagram of figure 1, an R individual is almost instantaneously converted into an S individual. We may therefore replace the two spontaneous processes IR and RS by just one spontaneous process IS. The SIRS model is thus reduced to the process SIS, composed by a catalytic infection and a spontaneous recovering, defining a class of models called SIS keel ; martins ; in the present case it corresponds to the contact process, known to be in the DP universality class marro . In the limit of small values of and , the ratio is identified as creation rate of contact process, so that the transition line around the left corner of the triangular phase diagram is given by where is the critical infection rate of the contact process defined on a regular square lattice.
III Birth and death process

A distinct stochastic description of the system under discussion is the one known as birth and death process or one-step process van . In this description the state of the system is characterized by a few stochastic variables. A birth and death process is here obtained from the SIRS stochastic lattice gas model by reducing the number of degrees of freedom. We use a contraction procedure leading to a description with just two stochastic variables: the number of susceptible individuals and the number of infected individuals. These variables are defined by
| (4) |
The appropriate stochastic description involves the probability of and at time which is assumed to obey the following birth and death master equation
| (5) |
This equation comes from the master equation (2) by summing over with the restriction that the number of susceptible individuals is and the number of infected individuals is . This procedure leads to the following results
| (6) |
| (7) |
| (8) |
where , and , and is the population size. Expressions (6) and (8) are exact and expression (7) is derived by a scheme similar to the so called simple mean-field approximation tome09 .

The birth and death process defined by the master equation (5) can be regarded as a random walk in the space as shown in Figure 2. The possible jumps are (a) , with probability , (b) , with probability , and (c) with probability .
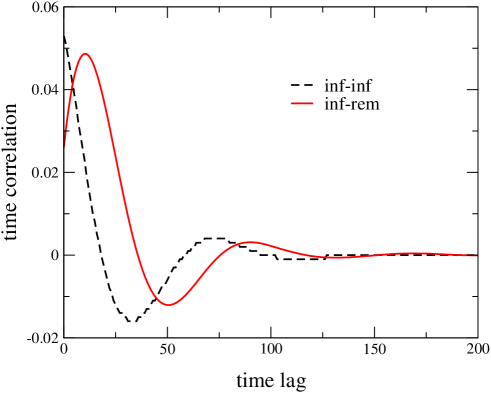
We have simulated the birth and death stochastic process according to the transition rates given by equations (6), (7) and (8) for . We have also determined the time correlation functions as a function of the time lag defined by
| (9) |
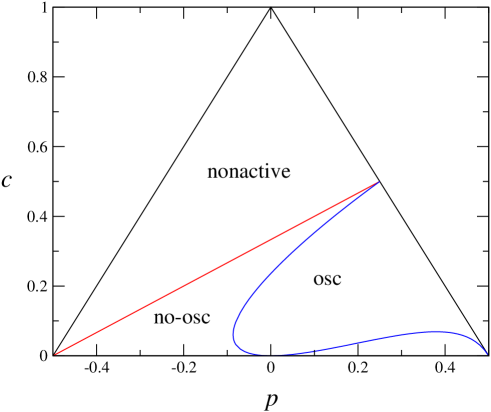
where and can be any of the variables or . As an example, we show in figure 4 the auto-correlation function for infected individuals and the cross-correlation between infected and removed individuals for the following values of the parameters: and . The damped oscillations of the time correlation function indicates that the populations of individuals in each class oscillate in time with period of Monte Carlo steps. This period was confirmed by Fourier analysis of the time correlation functions. The active phase can thus be separated into two regions as can be seen in figure 5. One region corresponding to sustained oscillations in population of individuals and the other without oscillations.
IV Langevin equations
Considering the situation where the population size is large we perform an expansion of the master equation (5) in powers of van ; gar . Up to second order in we get a Fokker-Planck equation for the probability density , namely
| (10) |
where
| (11) |
and
| (12) |
| (13) |
| (14) |
The Langevin equations associated to the Fokker-Planck equation (10) are
| (15) |
| (16) |
where , with , are white Gaussian noise functions with zero mean obeying the properties
| (17) |
Similar expansion procedure to study population biology systems has been used by other authors nisbet ; renshaw ; morita ; boland ; lugo ; tome09 .
V Mean-field approximation
In the limit the noise disappears and we are left with a deterministic dynamics which is identified here as a dynamic simple mean-field approach. The time evolution of the densities is given by
| (18) |
| (19) |
The equation for is not necessary because . The trivial solution is corresponding to a state where the entire population is composed by susceptible individuals only, called the inactive phase. The nontrivial solution is given by
| (20) |
and is valid as long as , corresponding to a state of epidemic spreading, where the individuals of the three classes coexist. The stability of the solutions are obtained from the eigenvalues of the Jacobian matrix
| (21) |
For the trivial solution the eigenvalues are and . Therefore this solution is stable as long as . The transition from the inactive phase to the active phase occurs along the line defined by or , as shown in figure 1 and 5. For the nontrivial solution, corresponding to the active state, the eigenvalues are given by
| (22) |
where
| (23) |
Therefore, when , the eigenvalues are complex and the solution approaches an asymptotic stable focus. When , they are real and the solution approaches an asymptotic stable node. The transition from a focus to a node occurs when , that is, when
| (24) |
which defines the separation line between these two behaviors, as shown in figure 5.
Let us find some particular solutions of the separation line (24). When (or ) this equation reduces to which gives . When (or ), equation (24) gives two solutions: one is and the other is the solution of the root of which gives . Improvements at qualitative level in the phase diagram can be achieved by considering dynamic mean-field approximations which takes into account correlations between neighbors sites. This procedure has been largely used in the context of stochastic lattice gas models, also called interacting particle systems, describing population biology systems ara ; morita ; tome09 ; durrett ; sat94 ; sat97 ; aguiar ; lebo . By using a pair mean-field approximation (PMF) sat94 we find for the present model a transition line between the active phase and the inactive phase which is shown in figure 1.
VI Conclusions
In this article we have examined a spatial-structured model describing the dynamic of a SIRS epidemic process. This model shows a continuous phase transition between a phase where the disease spread and other where it dies out in a short time. The phase diagram of the SIRS stochastic lattice gas model was obtained by Monte Carlo simulations and dynamic mean-field approximations. Our Monte Carlo results indicate that the SIRS stochastic lattice gas model exhibits a line of critical points that belongs in the directed percolation universality class. As far as we know this is the first determination of the universality class of the SIRS stochastic lattice gas model.
We have also derived a birth and death process for the numbers of individuals in each population class. This process was derived from the stochastic lattice gas model in the scope of simple mean-field approximation. A Fokker-Planck equation as well as the associate Langevin equations were then derived from the birth and death process. The simulation of this process, which can be seem as a random walk in the space of the number of susceptible and infected individuals, shows that the active state is subdivided into two regions: one in which the numbers of individuals in each class oscillate in time and another where they remain constant in time.
In summary, we have devised and analyzed the SIRS epidemic process at different levels of description: (a) the spatial, stochastic and local description, given by the SIRS stochastic lattice gas model; (b) the stochastic but zero dimensional birth and death process; and (c) the deterministic level in which the space is not considered, given by the simple mean-field approximation where all individuals are well mixed. The fundamental level is the one based on stochastic lattice gas models also called interacting particle systems durrett . These spatial structured models are relevant when the diseases spreads over a region with few individuals or when a group of individual of a given class becomes isolated, loosing contact with the other class of individuals during a certain period of time durrett00 ; kelly .
Acknowledgment
We acknowledge helpful discussions with M. J. de Oliveira and financial suppport from the Brazilian agency CNPq.
References
- (1) R. M. Nisbet and W. S. C. Gurney, Modeling Fluctuating Populations (Wiley, New York, 1982).
- (2) E. Renshaw, Modelling Biological Populations in Space and Time (Cambridge University Press, Cambridge, 1991).
- (3) M. J. Keeling, Proc. R. Soc. London B 266, 859 (1999).
- (4) R. E. Snyder and R. M. Nisbet, Bull. Math. Biol. 62, 959 (2000).
- (5) M. J. Keeling, H. B. Wilson and S. W. Pacala, Am. Nat. 159, 77 (2002)
- (6) W. O. Kermack and A. G. McKendrick, Proc. Royal Soc. London A 115, 700 (1927).
- (7) A. Hastings, Population Biology: Concepts and Models (Springer, New York, 1996).
- (8) P. Grassberger, Math. Biosc. 63, 157 (1983).
- (9) M. J. Keeling and P. Rohani, Modeling Infectious Diseases in Human and Animals (Princeton University Press, Princeton, 2008).
- (10) E. Arashiro and T. Tomé, J. Phys. A 40, 887 (2007).
- (11) D. Alonso, A. J. McKane, M. Pascual, J. R. Soc. Interface 4, 575 (2007).
- (12) O. E. Aiello, V. J. Haas, M. A. A. da Silva and A. Caliri, Physica A 282, 546 (2000).
- (13) O. E. Aiello and M. A. A. da Silva, Physica A 327, 525 (2003)
- (14) S. Morita and K. Tainaka, Popul. Ecol. 48, 99 (2006).
- (15) R. P. Boland, T. Galla and A. J. McKane, J. Stat. Mech. P09001 (2008).
- (16) C. A. Lugo and A. J. McKane, Phys. Rev. E 78, 051911 (2008).
- (17) T. Tomé and M. J. de Oliveira, Phys. Rev. 79, 061128 (2009).
- (18) J. Marro and R. Dickman, Nonequilibrium Phase Transitions (Cambridge University Press, Cambridge, 1999).
- (19) T. Tomé and M. J. de Oliveira, Phys. Rev. E 72, 026130 (2005)
- (20) M. A. Muñoz, R. Dickman, A. Vespignani and S. Zapperi, Phys. Rev. E 59, 6175 (1999).
- (21) S. L. Silva, J. A. Ferreira and M. C. Martins, Physica A 377, 689 (2007).
- (22) N. G. van Kampen, Stochastic Processes in Physics an Chemistry (North-Holland, Amsterdam, 1981).
- (23) C. W. Gardiner, Handbook of Stochastic Methods (Springer, Berlin, 1983).
- (24) R. Durrett and S. Levin, Theor. Popul. Biol. 46, 363 (1994).
- (25) J. Satulovsky and T. Tomé, Phys. Rev. E 49, 5073 (1994).
- (26) J. Satulovsky and T. Tomé, J. Math. Biol. 35, 344 , (1997).
- (27) M. A. M. de Aguiar, E. M. Rauch and Y. Bar-Yam, Phys. Rev. E 67, 047102 (2003).
- (28) J. Joo and J. L. Lebowitz, Phys. Rev. E 70, 036114 (2004).
- (29) R. Durrett and S. Levin, J. Theor. Biol. 205, 201 (2000).
- (30) K. C. de Carvalho and T. Tomé, Int. J. Mod. Phys. C 17, 1647 (2006).