Skymap for atmospheric muons at TeV energies measured in deep-sea neutrino telescope ANTARES
Abstract
Recently different experiments mention to have observed a large scale cosmic-ray anisotropy at TeV energies, e.g. Milagro, Tibet and Super-Kamiokande. For these energies the cosmic-rays are expected to be nearly isotropic. Any measurements of cosmic-rays anisotropy could bring some information about propagation and origin of cosmic-rays.
Though the primary aim of the ANTARES neutrino telescope is the detection of high energy cosmic neutrinos, the detector measures mainly down-doing muons, which are decay products of cosmic-rays collisions in the Earth’s atmosphere. This proceeding describes an anlaysis method for the first year measurement of down-going atmospheric muons at TeV energies in the ANTARES experiment, when five out of the final number of twelve lines were taking data.
Underwater neutrino telescope, Skymap, Atmospheric muons, Cosmic rays
1 Introduction
Spatial distributions of the muon flux have been measured by the Milagro observatory [1], Super-Kamiokande [2, 3] as well as by the Tibet Air Shower Array [4]. These experiments report large-scale anisotropy at primary cosmic-ray energies in the TeV range. The measured deviation from an isotropic distribution is of the order of and the excess region and deficit region have the size of several tens degrees.
The ANTARES neutrino telescope [5], located in the Northern hemisphere, can detect down-going muons from the North as the above mentioned detectors. IceCube has also mentioned that an investigation on a high statistic down-going muons data is ongoing.
ANTARES is located on the bottom of the Mediterranean Sea, 40 km off the French coast at N, E. The main objective is to detect high energy neutrinos from galactic or extragalactic sources. Neutrinos are detected indirectly through the detection of Cherenkov light produced by relativistic muons emerging from charged-current muon neutrino interactions in the surroundings.
The detector has been successfully deployed between March 2006 and May 2008. In its full configuration the detector comprises 12 vertical detection lines, each of about 450 m height, installed at a depth of about 2500 m. The lines are set from each other at a distance of 60 m to 70 m. They are anchored at the sea floor and held taut by buoys. The instrumented part of the line starts at 100 m above the sea floor. Photomultipliers are grouped in triplets (up to 25 floors on each line) for a better rejection of the optical background. They are oriented with their axis pointing downward at an angle of with respect to the vertical in order to maximize the effective area for upward-going tracks. ANTARES is operated in the so called all-data-to-shore mode, which means that all photomultiplier digitized information is sent to shore and treated in a computer farm at the shore station. These data are mainly due to background light caused by bioluminesence and decay. The background light varies in time and can cause counting rates of the photomultiplier tubes that varies between 50 kHz and 500 kHz. The data flow rate at the shore station are reduced by fast processing of the events looking for interesting physics, which is a challenge because of the high background rates. The main idea of the on-shore handling of these data is to take into account the causal connection between photomultiplier tubes signals which are compatible with the light produced by a relativistic muon. The reconstruction of muon tracks is based on the measurements of the arrival times of Cherenkov photons at photomultipliers and their positions.
Although ANTARES is optimized for upward-going particle detection, the most abundant signal is due to the atmospheric down-going muons. They are produced in air showers induced by interactions of primary cosmic-rays in the Earth’s atmosphere. The muons are the most penetrating particles in such air showers. Muons with energies above around 500 GeV can reach the detector, producing enough amount of Cherenkov light to reconstruct the direction of the muon. At larger zenith angle the minimum muon energy increases. The muons represent a high statistic data set that can be used for calibration purposes as well as to check the simulation of the detector response. The atmospheric muons will also provide information about primary cosmic rays at energies above few TeV. For these energies the cosmic-rays are mostly of Galactic origin and are expected to be nearly isotropic due to interactions with the Galactic magnetic field.
The cosmic-ray muon spatial distribution at these energies may be not isotropic for different reasons, like the instabilities related to temperature and pressure variations in the Earth’s atmosphere. The temperature in the upper atmosphere is related to the density of the atmosphere and thus to the interaction of the particles in the air showers which will affect the muon flux. This time variations of the cosmic-ray muon flux could mimic a flux anisotropy. This effect is canceled out when the time scale of data taking is larger than the time of thermodynamic changes in the Earth’s atmosphere. At cosmic-ray energies lower of around a TeV the movements of solar plasma through the heliosphere may change the Earth’s magnetic field, causing a modulation of the cosmic-ray anisotropy. Furthermore the Compton-Getting effect predicts a dipole effect due to the moving of the Earth with respect to an isotropic cosmic-ray rest system. If the Earth is moving in the rest system, the cosmic ray flux from the forward direction becomes larger.
2 Skymap for down going muons
The data used in this analysis cover the period from February 2007 until the middle of December 2007, during which only five out of twelve detector lines were installed. More than events were collected, most of which are atmospheric muons. The tracks are reconstructed with a linear fit algorithm which uses hits selected using the time information. The algorithm used for this analysis has the advantage to be fast, robust and has a high purity for atmospheric muons. The disadvantage is that this algorithms has not the ultimate angular resolution which can be achieved by ANTARES with a more sophisticated reconstruction algorithm.
Only down-going tracks detected by at least two lines and six floors are considered for the analysis. The angular resolution for this selection cuts is around seven degrees.
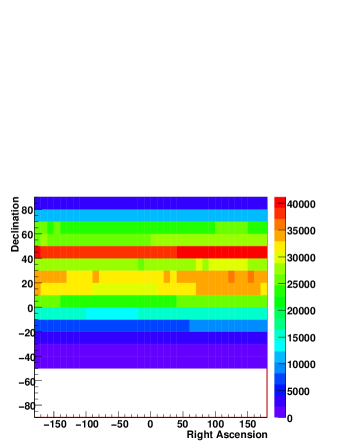
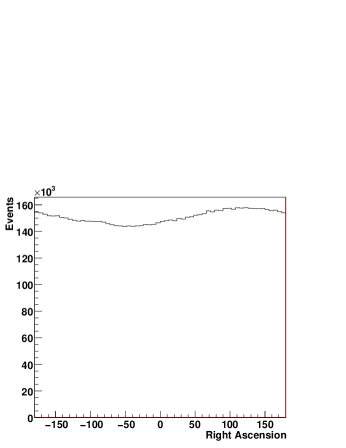
The track directions are given through the zenith and azimuth angle of the ANTARES local coordinates. Considering the time of the reconstructed tracks, the local coordinates are translated into equatorial coordinates: right ascension and declination. Figure 1 shows the results of the corresponding data sample in equatorial coordinates. The variation in declination is affected by the visibility and by the propagation length of the muons in the atmosphere. The number of events as a function of the right ascension should be uniform, because the distribution of cosmic rays with a given zenith direction in the ANTARES local coordinates travel a line in the declination coordinate. A given direction in the ANTARES local coordinates returns to the same right ascension after one sidereal day because of the Earth’s rotation. The right ascension distribution is shown in figure 2, which is not uniform.
The exposure for different directions is not uniform because the detector was not constantly taking data. Several days with high background rates have been removed for the analysis while during normal operation the detector is halted regularly for calibration purposes. This makes the data-taking not completely uniform along the day. The right ascension coordinates can be corrected for the introduced fluctuations in the exposure time. Taking the exposure time for the analyzed runs as well as the measured direction of the track in local coordinates, the modulation in right ascension can be calculated. The calculated amplitude of this modulation matches well the data shown in figure 2. Taking these values the data right ascension can be normalized by exposure.
After this correction, fluctuations, above or below the statistical expectation can be calculated. For a given declination band with bins in a right ascension, the probability to observe the number of events in each particular bin is calculated. The probability for the average expectation to fluctuate to the observed number of events or more in this bin is calculated with the equation
where is the number of expected events which is estimated from the average background in the declination band containing that bin and is the observed number of events in that bin. Finally, the significance of the cosmic ray signal of one bin is defined as
The statistics will be enlarged by using data of the following years. Assuming that the detector effects are under control, then the expected sensitivity to measure cosmic-ray anisotropy is only constrained by the number of detected muons.
3 Conclusion
Large scale cosmic ray anisotropies at TeV energies have been observed by the Milagro observatory, the Tibet Air Shower Array and Super-Kamiokande. ANTARES has a high statistics of TeV down-going muons available, which allows to search for possible anisotropies in the primary flux. A first attempt to reproduce a TeV energy muon skymap is ongoing, with the one year ANTARES data, where only five lines were deployed.
References
- [1] Abdo, A. A. and others, The Large Scale Cosmic-Ray Anisotropy as Observed with Milagro, arXiv:0806.2293 [astro-Ph]
- [2] Yuchi Oyama, Anisotrpoy of the primary cosmic-ray flux in Super-Kamiokande, arXiv:0605020 [astro-ph]
- [3] Guillian, G. and others, Observation of the anisotropy of 10-TeV primary cosmic ray nuclei flux with the Super-Kamiokande-I detector, arXiv:0508468 [astro-ph]
- [4] M. Amenomori et al., Large-scale Sideral Anisotropy of Galactic Cosmic-Ray Intensity Observed by the Tibet Air Shower Array, arXiv:0505114 [astro-ph]
- [5] E. Aslanides et al., A deep sea telescope for high-energy neutrinos, arXiv:9907432 [astro-ph]