Compactness of Cold Gas in High-Redshift Galaxies
Abstract
Galaxies in the early Universe were more compact and contained more molecular gas than today. In this paper, we revisit the relation between these empirical findings, and we quantitatively predict the cosmic evolution of the surface densities of atomic (HI) and molecular (H2) hydrogen in regular galaxies. Our method uses a pressure-based model for the H2/HI-ratio of the Interstellar Medium, applied to virtual galaxies in the Millennium Simulation. We predict that, on average, the HI-surface density of these galaxies saturates at at all redshifts (), while H2-surface densities evolve dramatically as . This scaling is dominated by a surface brightness scaling originating from the size scaling of galaxies at high . Current measurements of at high , derived from CO-observations, tend to have even higher values, which can be quantitatively explained by a selection bias towards merging systems. However, despite the consistency between our high- predictions and the sparse empirical data, we emphasize that the empirical data potentially suffer from serious selection biases and that the semi-analytic models remain in many regards uncertain. As a case study, we investigate the cosmic evolution of simulated galaxies, which resemble the Milky Way at . We explicitly predict their HI- and H2-distribution at , corresponding to the CO-detected galaxy -21000, and at , corresponding to the primary science goal of the Atacama Large Millimeter/submillimeter Array (ALMA).
keywords:
ISM: atoms – ISM: molecules – ISM: clouds – galaxies: evolution – galaxies: high-redshift.1 Introduction
Galaxies were more compact in the early Universe than today (Bouwens et al., 2004; Trujillo et al., 2006; Buitrago et al., 2008). This empirical feature is probably driven by an increase in the volume-to-mass ratio of dark haloes with cosmic time (Gunn & Gott, 1972), which dictates the density evolution of galaxies by the transfer of angular momentum (Fall & Efstathiou, 1980). We have recently argued (Obreschkow & Rawlings, 2009a) that the density evolution of galactic discs implies a systematic pressure change, which causes a dramatic decline in the mass ratio between molecular (H2) and atomic (HI) hydrogen with cosmic time. Using the Millennium Simulation, we showed that this decline in the H2/HI-ratio simultaneously explains (i) the observations of large molecular masses in ordinary galaxies at (Daddi et al., 2008), (ii) the weak cosmic evolution of the HI-density inferred from damped Lyman- systems (Prochaska et al., 2005), and (iii) the history of star formation inferred from ultraviolet, far-infrared, submillimeter, and radio continuum observations (Hopkins & Beacom, 2006).
In this paper, we quantitatively predict the cosmic evolution of the surface densities of HI and H2 in a large sample of regular galaxies. Section 2 explains our physical model and the numerical simulation. Section 3 presents our predictions for the average cosmic evolution of the HI- and H2-distributions in a broad sample of galaxies, while Section 4 specifically focusses on the evolution of HI- and H2-distributions in Milky Way (MW)-type galaxies. Section 5 gives a brief summary and outlook.
2 Simulation of and in galaxies
Several computational studies (e.g. Combes et al., 1999; Greve & Sommer-Larsen, 2008; Robertson & Kravtsov, 2008; Dobbs, 2008) have investigated the distribution of molecular gas in regular galaxies and revealed pivotal connections between the distribution of molecules and star formation. In particular, Robertson & Kravtsov (2008) and Krumholz et al., 2009 (see also Elmegreen, 1993) demonstrated that the empirical relation between the local H2/HI-ratios and cold gas pressure, measured by Blitz & Rosolowsky (2006) and Leroy et al. (2008), can be approximately reproduced by SPH/-body simulations, which include a model for interstellar radiation.
While those simulations are effective tools for the study of the cold gas in individual galaxies, they are computationally too expensive to be included in “cosmological simulations”, i.e. simulations of representative samples of galaxies with resolved merger histories in an expanding model-universe. However, cosmological simulations of HI- and H2-distributions are required for the design and analysis of high- cold gas surveys possible with future telescopes, such as the Square Kilometer Array (SKA), the Large Millimeter Telescope (LMT), and the Atacama Large Millimeter/submillimeter Array (ALMA). To circumvent the current computational bottleneck, we decided (Obreschkow et al., 2009) to adopt a semi-analytic simulation of millions of galaxies and to estimate the HI- and H2-distributions of these galaxies using an analytic model. We shall first explain this model and then the semi-analytic simulation.
Our model for the distributions of HI and H2 in regular galaxies represents a ramification of the H2/HI–pressure relation measured by Leroy et al. (2008), combined with two assumptions for the distribution of cold hydrogen. The first assumption is that all galaxies carry their cold gas in flat discs, such as is observed in virtually all regular galaxies (see Leroy et al. (2008) for spiral galaxies at low , Young (2002) for elliptical galaxies at low , and e.g. Tacconi et al. (2006) for galaxies at high ). The second assumption is that the surface density of cold hydrogen, , follows an exponential profile in the radial coordinate (e.g. Leroy et al., 2008). Based on these assumptions we have shown (Obreschkow et al., 2009) that the surface densities of HI and H2 are
| (1) | |||||
| (2) |
where is the exponential scale radius of the cold gas disc, is a normalization factor, and is the central H2/HI-ratio. can be approximated (Obreschkow et al., 2009) from , the disc stellar mass , and the total (HI+H2+He) cold gas mass as,
| (3) |
where is an empirical constant.
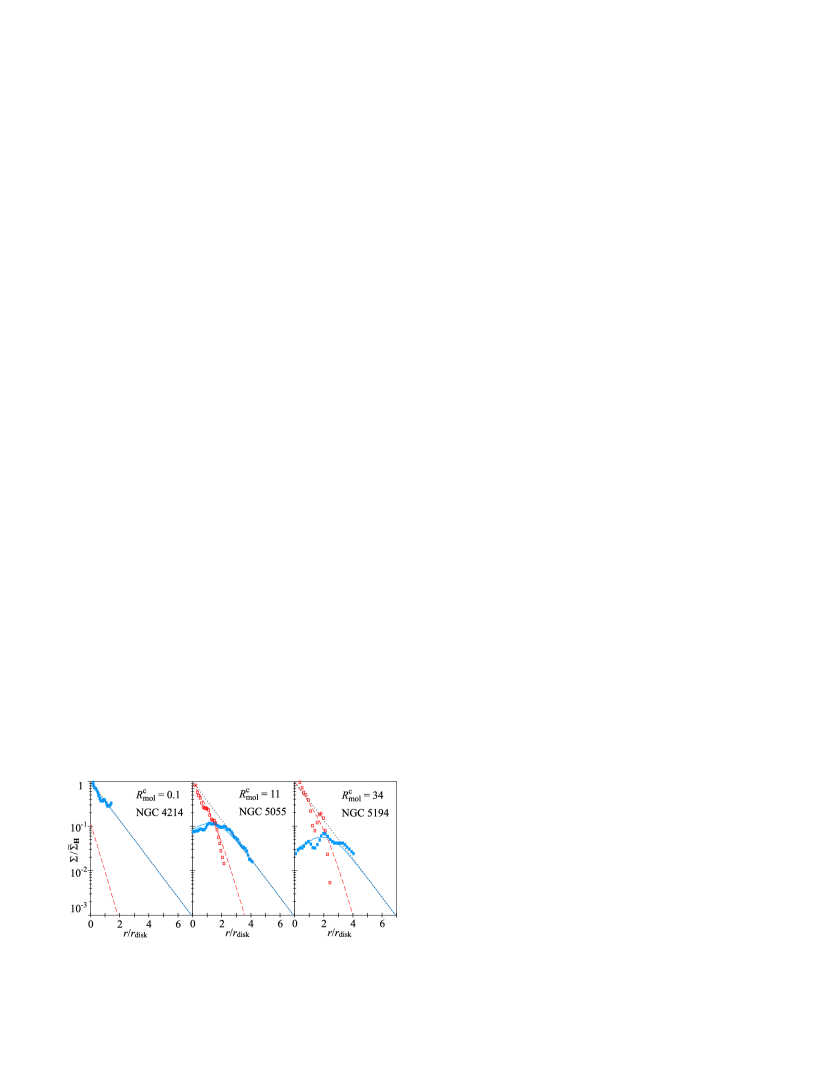
If the radii and surface densities in Eqs. (1, 2) are normalized to and , then and become unique functions of . Fig. 1 shows and in these normalized coordinates for three different values of , chosen to match those of nearby galaxies with measured HI- and CO-densities (Leroy et al., 2008): NGC 4214, a star-forming, HI-rich, dwarf galaxy; NGC 5055, a massive spiral galaxy with similar HI- and H2-masses; NGC 5194, a barred, H2-rich spiral galaxy. The scale lengths and the densities of these galaxies were estimated by fitting exponential functions to for each galaxy (NGC 4214/5055/5194: , , ). The good fit between the model and the observations demonstrates the validity of the pressure-based model for the H2/HI-ratio.
Eqs. (1, 2) make a list of predictions, which can be seen as direct consequences of the H2/HI–pressure relation: (i) the H2/HI-mass ratio of the whole galaxy increases with (Obreschkow et al., 2009); (ii) H2-rich galaxies, i.e. , have annular HI-distributions with a density drop towards the centre; (iii) if and cross, they do so close to the maximum of .
To evaluate and using Eqs. (1–3), we require an estimate of , , and . In Obreschkow et al. (2009), we therefore adopted the cosmological galaxy simulation performed by De Lucia & Blaizot (2007) on the dark-matter skeleton of the Millennium Simulation (Springel et al., 2005). In this “semi-analytic” simulation, galaxies were represented by a list of global properties, such as position and total masses of gas, stars, and black holes. These properties were evolved using simplistic formulae for mechanisms, such as gas accretion by infall and mergers, star formation, gas heating by supernovae, and feedback from black holes. The free parameters in this model were tuned mostly to optical observations in the local universe (see Croton et al., 2006), such as the joint luminosity/colour/morphology distribution of optically observed low-redshift galaxies. However, no measurements of HI and H2 were used to adjust the free parameters.
The semi-analytic simulation resulted in a catalog listing the properties of model-galaxies at 64 cosmic time steps. In these galaxies, the cold gas was treated as a single component, hence masking the complexity of atomic and molecular phases. We therefore post-processed this simulation using Eqs. (1–3) to evaluate HI- and H2-distributions for every galaxy. The results of the emerging HI and H2 simulations were presented in Obreschkow et al. (2009). They well match the HI- and H2-mass functions, mass–diameter relations, and mass–velocity relations observed in the local Universe. The high- predictions are roughly consistent with the sparse cold gas detections at (Obreschkow & Rawlings, 2009a).
The limitations and uncertainties of this model for HI and H2 at low and high were discussed in detail in Section 6 of Obreschkow et al. (2009). Some crucial points shall be emphasized here: (i) The predicted space density of HI, , undershoots the inferences of damped Lyman- systems (DLAs) at by about a factor 2 (see Fig. 2 and Section 4 in Obreschkow & Rawlings, 2009a). We discussed possible reasons for this discrepancy, but it should be stressed that an offset by a factor 2 is rather small, given that the semi-analytic models of De Lucia & Blaizot (2007) have never been tuned to HI-data, but only to local optical data. (ii) One might worry whether the H2/HI–pressure relation, assumed constant in our model, could undergo a significant evolution with redshift. In Section 6.3 of Obreschkow et al. (2009), we argued that this effect is reasonably small because the empirical H2/HI–pressure relation seems to implicitly include changes in the photo-dissociating UV-radiation field, and the scatter in H2/HI shows no significant correlation with metallicity (Blitz & Rosolowsky, 2006), although the mean metallicities of the galaxies in the sample differ by a factor 5. This factor is on the order of the typical metallicity evolution of an individual massive galaxy between redshift and , and hence the cosmic evolution of metallicity seems to be a minor concern (for details and references see Section 6.3 in Obreschkow et al., 2009). (iii) Eq. 1 suggests that falls of exponentially at large galactic radii, while some observations have suggested that it varies rather as , proportional to the dark matter density derived from flat rotation curves (e.g. Bosma, 1981; Hoekstra et al., 2001). The detailed HI-maps and CO-maps presented by Leroy et al. (2008) for a sample of 18 nearby galaxies nevertheless reveal that all these galaxies carry most of their cold gas mass inside a radius where the angularly averaged HI-distribution is consistent with an exponential profile. Therefore, we consider the exponential profile as a safe assumption for the purpose of splitting the cold gas mass between HI and H2.
We use sample of 18 nearby galaxies, for which Leroy et al. (2008) derived inclination-corrected column density maps of HI, H2, stars, and SFRs (not used here).
3 Cosmic evolution of and
In this section, we shall investigate the average cosmic evolution of the surface densities of HI and H2 in the simulated galaxies (see Section 2). We define the “average” as the -weighted geometric average over all galaxies with . The threshold approximately marks the completeness limit of the simulation and the mass-weighting ensures that massive galaxies with low space densities contribute significantly to the average.
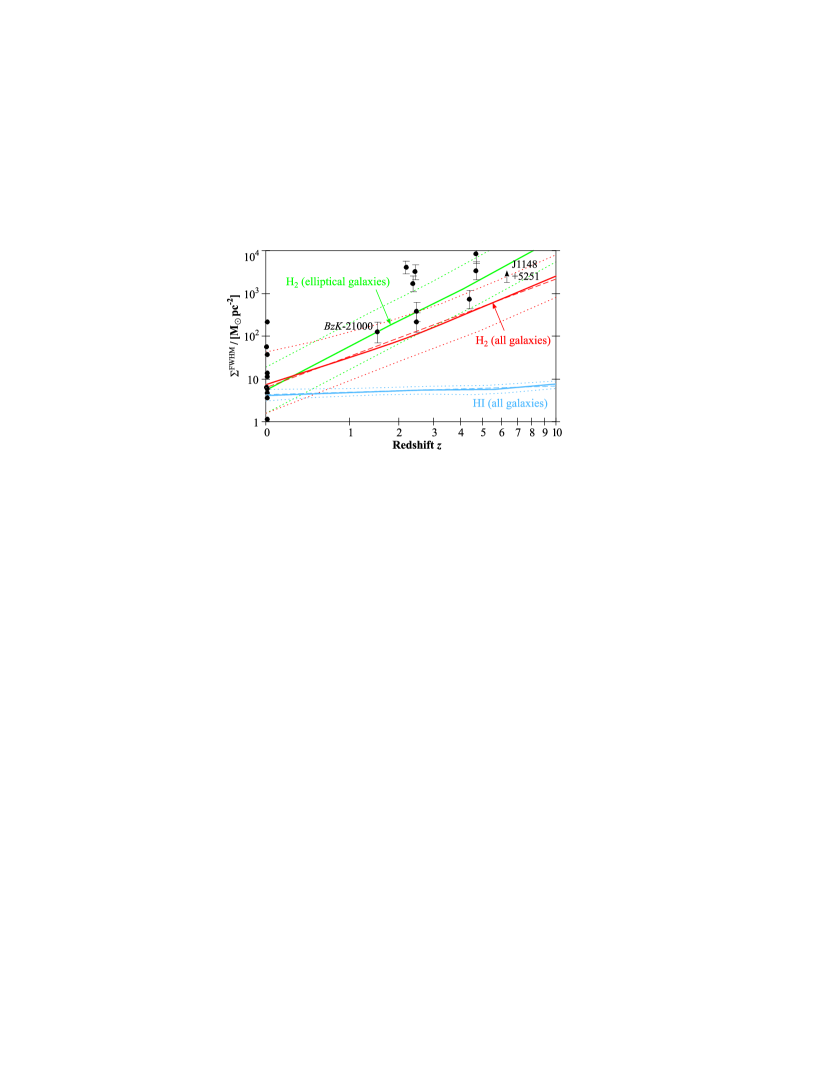
For each galaxy we define the Full-Width-Half-Maximum (FWHM) surface densities, and , as the average surface densities inside the radii , where and reach of their maximal value. The simulated cosmic evolution of and is displayed in Fig. 2 as solid lines. Both and are well fitted by power-laws (dashed lines in Fig. 2),
| (4) | |||||
| (5) |
The simulated HI-density remains roughly constant reaching maximal values around , consistent with the observed HI-saturation level in nearby galaxies (Bigiel et al., 2008). This cosmic evolution of is a pure prediction, with no observational counterpart at to-date.
The simulated H2-densities can be compared to CO-data. The data points in Fig. 2 (see also Table 1) represent 12 local and 11 distant galaxies with observational estimates of derived from resolved CO-maps111The adopted CO-to-H2 conversion is at (Table 1, top), consistent with observations in local quiescent galaxies (Leroy et al., 2008); and for sources at (Table 1, bottom), consistent with observations in Ultra Luminous Infrared Galaxies (Downes & Solomon, 1998).. To our knowledge, none of the high-redshift galaxies are gravitationally lensed, however they certainly represent a highly-biased sample (see below).
At , the observed average of , weighted by the cold gas masses and the space densities drawn from the cold gas mass function (Obreschkow & Rawlings, 2009b), is , consistent with the simulated value of .
At , the empirical values of show a clear trend to increase with redshift . We must worry whether this is a pure selection effect, merely reflecting the relation between sensitivity and redshift (similar to Fig. 5 in Greve et al., 2005). To our knowledge, all the high-redshift CO-sources considered here have originally been selected from single-mirror surveys (submillimeter, IR, optical), which are flux limited rather than surface brightness limited. Unfortunately, it is not clear what fraction of all flux selected sources has been detected in the follow-up interferometric surveys, but it is likely that the present sample of spatially resolved high-redshift CO-sources is biased towards high fluxes (i.e. large H2-masses) rather than towards high surface brightness (i.e. high H2-surface densities). In general, more massive disc galaxies tend to have lower surface densities than less massive ones. Therefore, the selection bias of a flux limited sample tends to bias high-redshift disc galaxies towards lower H2-surface densities. If the observed systems were single discs, one would thus expect the real relation between H2-surface densities and redshift to be even steeper than suggested by the data points in Fig. 2. On the other hand, the CO-detected galaxies at seem to be heavily biased towards systems subjected to major mergers (Tacconi et al., 2006). On average, major mergers decrease the specific angular momentum, hence decreasing and increasing .
| Object | Type | CO- | ||
| line | ||||
| NGC0628 | Sc | 0.0 | 2–1 | |
| NGC3198 | SBc | 0.0 | 2–1 | |
| NGC3184 | SBc | 0.0 | 2–1 | |
| NGC4736 | Sab | 0.0 | 2–1 | |
| NGC3351 | SBb | 0.0 | 2–1 | |
| NGC6946 | SBc | 0.0 | 2–1 | |
| NGC3627 | SBb | 0.0 | 2–1 | |
| NGC5194 | SBc | 0.0 | 2–1 | |
| NGC3521 | SBbc | 0.0 | 2–1 | |
| NGC2841 | Sb | 0.0 | 2–1 | |
| NGC5055 | Sbc | 0.0 | 2–1 | |
| NGC7331 | SAb | 0.0 | 2–1 | |
| BzK-21000 | Galaxy | 1.5 | 2–1 | |
| SMM J123549+6215 | SMG | 2.2 | 3–2 | |
| SMM J163650+4057 | SMG | 2.4 | 3–2 | |
| SMM J163658+4105 | SMG | 2.5 | 3–2 | |
| SMM J123707+6214SW | SMG | 2.5 | 3–2 | |
| SMM J123707+6214NE | SMG | 2.5 | 3–2 | |
| BRI 1335 0417 | QSO | 4.4 | 2–1 | |
| BRI 1202-0725 north | QSO | 4.7 | 2–1 | |
| BRI 1202-0725 south | QSO | 4.7 | 2–1 | |
| J1148+5251 | QSO | 6.4 | 3–2 |
We should therefore compare the CO-measurements at exclusively with the simulated galaxies with major mergers in their cosmic evolution. In the semi-analytic model, the evolution of the angular momentum during a merger is directly computed from the underlying -body Millennium Simulation. We can therefore expect that, on average, mergers decrease the specific angular momentum, and hence increase the cold gas densities towards the high observed densities shown in Fig. 2. Within the semi-analytic model (Croton et al., 2006), where stellar bulges arise during mergers, galaxies resulting from major mergers are “elliptical” galaxies, defined as the objects with a bulge-to-total mass ratio larger than (see eq. 18 in Obreschkow et al., 2009). The average and the corresponding 1- scatter of the simulated elliptical galaxies are represented by the green lines in Fig. 2 and provide a much better fit to the observational data.
Despite the reasonable agreement between the simulated and the empirical data for and , we emphasize that there are many subtle selection effects in the empirical data (e.g. flux limited sample versus surface brightness limited sample, Eddington bias) and that the semi-analytic models remain in many regards simplistic and uncertain (e.g. no geometrical model of mergers, mass resolution limitations, no ram-pressure stripping). Clearly, the advent of telescopes, such as the SKA, the LMT, and ALMA, will prove invaluable to refine these models.
What are the reasons for the different cosmic evolutions of and ? According to Eqs. (1–3), these evolutions can be understood from the average cosmic evolution of , , and . Most of the massive galaxies in the semi-analytic simulation are gas-dominated at and their cold gas masses remain roughly constant with cosmic time due to a self-regulated equilibrium between the net cold gas accretion and star formation. Thus, for any given galaxy, the cosmic evolution of the value and the functions and is essentially dictated by the evolution of the scale radius . Assuming a similar specific angular momentum for the galaxy and its halo (Fall & Efstathiou, 1980), is expected to evolve proportionally to the virial radius of the halo. For a spherical halo of mass , the latter scales as (flat universe, Gunn & Gott, 1972), and hence for a fixed ,
| (6) |
where (here 0.25) and (here 0.75) denote the normalized space densities of matter and vacuum energy.
At high , Eq. (6) reduces to , consistent with observations in the Hubble Ultra Deep Field (Bouwens et al., 2004). If the cosmic evolution of and is neglected, then implies (see Eq. 3) and . Yet, for , the maximum of is given by (see Obreschkow et al., 2009) and hence . In other words, the surface density of HI is expected to show little evolution with redshift, consistent with the numerical fit for of Eq. (4). On the other hand, in Eq. (2) reduces to , if (i.e. ). Hence, if the cosmic evolution of is negligible, and are predicted to scale as . A comparison to Eq. (5) confirms that, within our model, the cosmic evolution of is largely explained by the size-evolution of galaxies, while the evolution of plays a minor role, accounting for an additional scaling.
4 Evolution Scenario for the Milky Way
We shall now investigate the cosmic evolution of the HI- and H2-distributions in MW-type galaxies. By definition, a simulated galaxy at is called a “MW-type” galaxy, if its morphological type is Sb–Sc and if it matches the stellar mass , the HI-mass , the H2-mass , the HI-half-mass radius , and the H2-half-mass radius of the MW within a factor 1.3. This factor roughly matches the empirical uncertainties of the MW data in Table 2. Within this definition, the simulation contains MW-type galaxies at . At , we define MW-type galaxies as those objects, which are the most massive progenitors of a MW-type galaxy at . Most MW-type galaxies accrete about half of their mass in a time-interval corresponding to the redshift range . They typically undergo a series of minor mergers, allowing the build-up of small bulges.
To accommodate the nature of the empirical data (e.g. poor data for gas at the MW centre), we here consider the half-mass radii and , and the enclosed average surface densities and , rather than FWHM values.
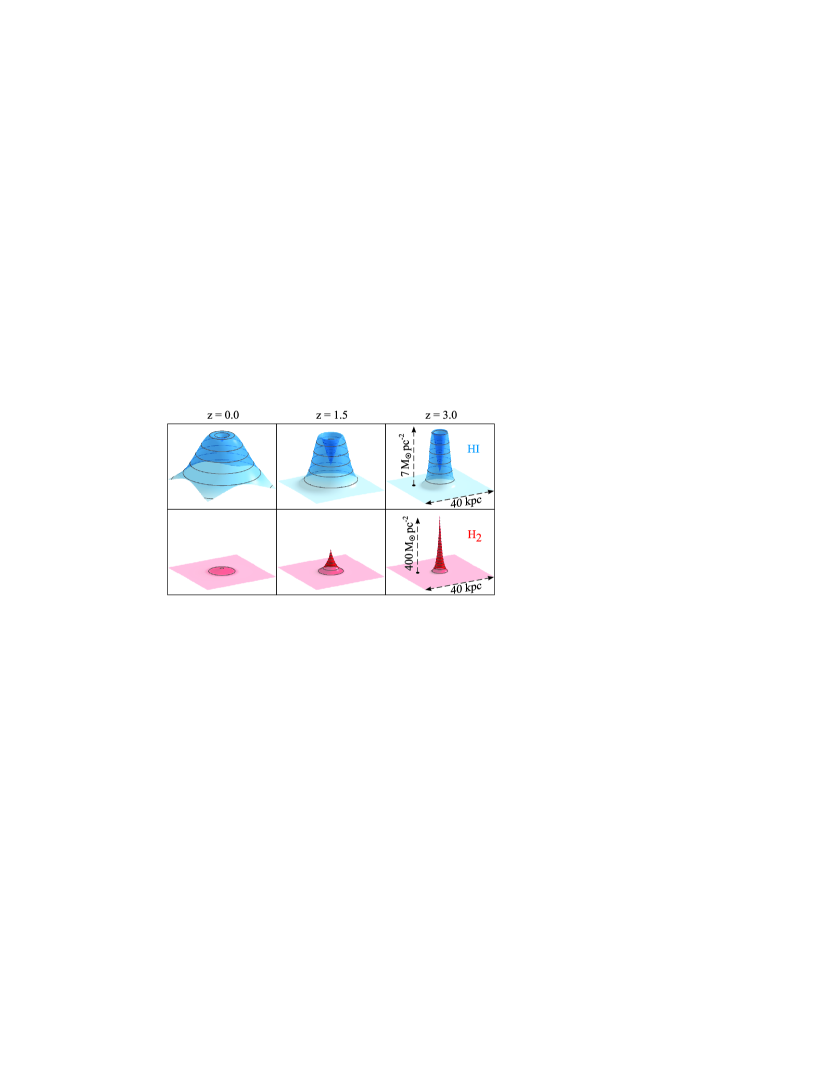
In Table 2, we explicitly present the predicted average gas masses, gas radii, and gas densities of the MW-type galaxies at three specific redshifts: , corresponding to the MW itself; , corresponding to the galaxy -21000, which is the only “relatively ordinary” galaxy (i.e. a borderline ultra luminous infrared galaxy for a “normal” star formation efficiency) at higher detected and spatially resolved in CO-emission to-date; , corresponding to the primary science goal of ALMA, i.e. the detection of MW-type galaxies at in less than 24 hours observation. Fig. 3 illustrates the average density profiles and at these three redshifts.
The cosmic evolution of the average HI- and H2-properties of the simulated MW-type galaxies can be characterized as follows: (i) the mass ratio approximately varies as , identical to the space density evolution predicted in Obreschkow & Rawlings (2009a); (ii) the surface density of HI remains approximately constant, while the density of H2 increases by a factor 30 from to ; (iii) both the HI-radius and the H2-radius shrink by a factor from to ; (iv) the HI-distribution is more annular at high (see Fig. 3), resembling the central HI-deficiency seen in H2-rich local galaxies.
| Sim/MW | Sim/ | Sim | |
|---|---|---|---|
| Redshift | |||
| Type | Sb-c/SBbc | Sc/S? | Sc-d |
| / | / | ||
| / | /? | ||
| / | /? | ||
| / | /? | ||
| / | / | ||
| / | / | ||
| / | / |
The comparison of the galaxy -21000 (Daddi et al., 2008) and the MW-type galaxies at (see Table 2) suggests that the H2-density of -21000 is consistent with that of a typical MW progenitor, while the total H2-mass of -21000 may be a few times higher. Considering that the MW lies at the lower end of intermediate mass spiral galaxies (stellar masses in the range ; Flynn et al., 2006), the H2-distribution of -21000 appears to be typical for the progenitors of intermediate mass disc galaxies.
5 Conclusion
We have studied the cosmic evolution of the surface densities of HI and H2 in regular galaxies using theoretical models combined with the Millennium Simulation.
A key result is that the surface density of HI remains approximately constant and close to saturation at all redshifts, while the mean surface density of H2 changes dramatically as , mainly due to the size evolution of galaxies. These predictions will become testable with future telescopes, such as the LMT, ALMA, and the SKA. The few CO-detected high- galaxies available today seem to have even higher H2-surface densities than predicted by the scaling (see Fig. 2). This could result from a selection bias towards systems, which have lost some of their specific angular momentum in major mergers.
We also studied the cosmic evolution of the cold gas in a sample of MW-type galaxies. We predicted that at the H2-mass of a MW-type galaxy is with the denser 50% of this mass reaching an average surface density of .
We thank the anonymous referee for a list of very helpful suggestions. This activity is supported by the European Community Framework Programme 6, Square Kilometre Array Design Studies, contract no 011938. The Millennium Simulation databases were built as part of the activities of the German Astrophysical Virtual Observatory.
References
- Bigiel et al. (2008) Bigiel F., Leroy A., Walter F., Brinks E., de Blok W. J. G., Madore B., Thornley M. D., 2008, AJ, 136, 2846
- Blitz & Rosolowsky (2006) Blitz L., Rosolowsky E., 2006, ApJ, 650, 933
- Bosma (1981) Bosma A., 1981, AJ, 86, 1825
- Bouwens et al. (2004) Bouwens R. J., Illingworth G. D., Blakeslee J. P., Broadhurst T. J., Franx M., 2004, ApJL, 611, L1
- Buitrago et al. (2008) Buitrago F., Trujillo I., Conselice C. J., 2008, ArXiv e-prints
- Carilli et al. (2002) Carilli C. L., et al., 2002, AJ, 123, 1838
- Combes et al. (1999) Combes F., Maoli R., Omont A., 1999, A&A, 345, 369
- Croton et al. (2006) Croton D. J., et al., 2006, MNRAS, 365, 11
- Daddi et al. (2008) Daddi E., Dannerbauer H., Elbaz D., Dickinson M., Morrison G., Stern D., Ravindranath S., 2008, ApJL, 673, L21
- De Lucia & Blaizot (2007) De Lucia G., Blaizot J., 2007, MNRAS, 375, 2
- Dobbs (2008) Dobbs C. L., 2008, MNRAS, 391, 844
- Downes & Solomon (1998) Downes D., Solomon P. M., 1998, ApJ, 507, 615
- Elmegreen (1993) Elmegreen B. G., 1993, ApJ, 411, 170
- Fall & Efstathiou (1980) Fall S. M., Efstathiou G., 1980, MNRAS, 193, 189
- Flynn et al. (2006) Flynn C., Holmberg J., Portinari L., Fuchs B., Jahreiß H., 2006, MNRAS, 372, 1149
- Greve et al. (2005) Greve T. R., et al., 2005, MNRAS, 359, 1165
- Greve & Sommer-Larsen (2008) Greve T. R., Sommer-Larsen J., 2008, A&A, 480, 335
- Gunn & Gott (1972) Gunn J. E., Gott J. R. I., 1972, ApJ, 176, 1
- Hoekstra et al. (2001) Hoekstra H., van Albada T. S., Sancisi R., 2001, MNRAS, 323, 453
- Hopkins & Beacom (2006) Hopkins A. M., Beacom J. F., 2006, ApJ, 651, 142
- Kalberla & Dedes (2008) Kalberla P. M. W., Dedes L., 2008, A&A, 487, 951
- Krumholz et al. (2009) Krumholz M. R., McKee C. F., Tumlinson J., 2009, ApJ, 693, 216
- Leroy et al. (2008) Leroy A. K., Walter F., Brinks E., Bigiel F., de Blok W. J. G., Madore B., Thornley M. D., 2008, AJ, 136, 2782
- Obreschkow et al. (2009) Obreschkow D., Croton D., DeLucia G., Khochfar S., Rawlings S., 2009, ApJ, 698, 1467
- Obreschkow & Rawlings (2009a) Obreschkow D., Rawlings S., 2009a, ApJL, 696, L129
- Obreschkow & Rawlings (2009b) —, 2009b, MNRAS, 394, 1857
- Prochaska et al. (2005) Prochaska J. X., Herbert-Fort S., Wolfe A. M., 2005, ApJ, 635, 123
- Robertson & Kravtsov (2008) Robertson B. E., Kravtsov A. V., 2008, ApJ, 680, 1083
- Sanders et al. (1984) Sanders D. B., Solomon P. M., Scoville N. Z., 1984, ApJ, 276, 182
- Springel et al. (2005) Springel V., et al., 2005, Nat, 435, 629
- Tacconi et al. (2006) Tacconi L. J., et al., 2006, ApJ, 640, 228
- Trujillo et al. (2006) Trujillo I., et al., 2006, ApJ, 650, 18
- Walter et al. (2004) Walter F., Carilli C., Bertoldi F., Menten K., Cox P., Lo K. Y., Fan X., Strauss M. A., 2004, ApJL, 615, L17
- Young (2002) Young L. M., 2002, AJ, 124, 788