Short-term variability and PSD analysis of the radio-loud AGN 3C 390.3
Abstract
We investigate the short-term variability properties and the power spectral density (PSD) of the Broad-Line Radio Galaxy (BLRG) 3C 390.3 using observations made by XMM-Newton, RXTE, and Suzaku on several occasions between October 2004 and December 2006. The main aim of this work is to derive model-independent constraints on the origin of the X-ray emission and on the nature of the central engine in 3C 390.3. On timescales of the order of few hours, probed by uninterrupted XMM-Newton light curves, the flux of 3C 390.3 is consistent with being constant in all energy bands. On longer timescales, probed by the 2-day RXTE and Suzaku observations, the flux variability becomes significant. The latter observation confirms that the spectral variability behavior of 3C 390.3 is consistent with the spectral evolution observed in (radio-quiet) Seyfert galaxies: the spectrum softens as the source brightens. The correlated variability between soft and hard X-rays, observed during the Suzaku exposure and between the 2 XMM-Newton pointings, taken 1 week apart, argues against scenarios characterized by the presence of two distinct variable components in the 0.5–10 keV X-ray band. A detailed PSD analysis carried out over five decades in frequency suggests the presence of a break at days at a 92% confidence level. This is the second tentative detection of a PSD break in a radio-loud, non-jet dominated AGN, after the BLRG 3C 120, and appears to be in general agreement with the relation between , , and , followed by Seyfert galaxies. Our results indicate that the X-ray variability properties of 3C 390.3 are broadly consistent with those of radio-quiet AGN, suggesting that the X-ray emission mechanism in 3C 390.3 is similar to that of nearby Seyfert galaxies without any significant contribution from a jet component.
Subject headings:
Galaxies: active – Galaxies: nuclei – X-rays: galaxies1. Introduction
Relativistic bipolar outflows, generally emitting most of their energy in the radio range, are one of the most dramatic manifestations of the presence of supermassive black holes in Active Galactic Nuclei (AGN). Although it is widely accepted that these ejections are closely related to the accretion process onto the central black hole, the details of this link are still unknown.
A promising approach for tackling this problem is to investigate the X-ray properties of AGN with jets (generally called radio-loud AGN) and carry out a systematic comparison with their radio-quiet counterparts, the Seyfert galaxies. Unlike optical and UV light, X-rays are not significantly attenuated and are less affected by dilution from the host galaxy and are thought to be produced in the inner most regions of the accretion flow, thus may provide the most direct view of the central engine.
Broad-line radio galaxies (hereafter BLRGs) are one of the best classes of radio-loud AGN for this comparative analysis; they have optical and UV spectral properties similar to Seyfert galaxies, but they also host large-scale radio jets that are absent in their radio-quiet counterparts. Past X-ray spectroscopic studies, employing ASCA, RXTE and BeppoSAX data, have shown that BLRGs have weak Fe K lines and weak or absent Compton reflection humps at energies keV, a hallmark of Seyfert 1 galaxies (e.g., Woźniak et al. 1998; Sambruna et al. 1999; Eracleous et al. 2000; Zdziarski & Grandi 2001; Grandi et al. 2006). These findings have been confirmed by recent studies that made use of higher quality spectra provided by Chandra and XMM-Newton (e.g., Ballantyne et al. 2004, Ballantyne 2005; Ogle et al. 2004; Lewis et al. 2005; Gliozzi et al. 2007). Indeed, the weakness of the Fe K line and the Compton reflection continuum are very important observational clues, since they represent a major difference between radio-loud and radio-quiet AGN. However, the origin of this difference is still debated (see Gliozzi et al. 2007 for a detailed discussion on the competing models).
The importance of temporal studies lies in that they may provide model-independent information that complements the findings from spectral studies and possibly breaks the spectral degeneracy. Indeed, the similarity of the temporal and spectral variability properties of 2 BLRGs (including 3C 390.3) with those of Seyfert galaxies, led us to rule out a jet origin for the bulk of X-ray flux from these BLRGs and provided tight constraints on the jet contribution (Gliozzi et al. 2003a).
Past temporal studies indicate that the flux variability of 3C 390.3 is associated with spectral variability, in the sense that the spectrum softens as the flux increases. The presence of flux and spectral variability has been observed separately in the 2–15 keV band with RXTE (Gliozzi et al. 2003a, 2006), in the 2-10 keV energy band using ASCA and Ginga (Leighly et al. 1997), as well as at softer energies (0.1–2.4 keV) with ROSAT (Leighly et al. 1997). Importantly, all the above results, are based either on long-term (months to years) monitoring campaigns or on multiple observations spanning several years, but none addresses specifically the short-term variability. Although in the literature there are several studies based on individual observations of 3C 390.3 with different X-ray satellites (e.g., EXOSAT from Inda et al. 1994; ASCA from Eracleous et al. 1996, or BeppoSAX from Grandi et al. 1999), they all are focused on the spectral analysis and the temporal analysis is generally limited to few sentences indicating that the flux appears to be constant on timescales shorter than 1 day.
The apparent absence of short-term variability in 3C 390.3 seems to be in line with scaling relations inferred from power spectral density studies of radio-quiet AGN (see McHardy et al. 2006 and references therein). However, the lack of short-term variability in this AGN has never been tested by a satellite with the capabilities of XMM-Newton, which combines a very high throughput with highly elliptical orbits. These capabilities produce high quality uninterrupted light curves that have revealed the presence of short-term variability also in unexpected AGN classes, such as LINERs or low-luminosity Seyfert galaxies (e.g., Gliozzi et al. 2003b, 2008; Papadakis et al. 2009).
Taking advantage of the unique capabilities of XMM-Newton we perform for the first time a thorough analysis of the temporal and spectral variability of 3C 390.3 on timescales of a few hours. This study is complemented by a similar analysis on timescales of 2 days, based on high quality variability data from Suzaku and from RXTE. These data are then combined with long-term RXTE monitoring data to produce the first power spectral density (PSD) of 3C 390.3. A detailed analysis of the time-averaged spectral properties is reported in a companion paper by Sambruna et al. (2009) and can be summarized as follows: 1) the broad-band 0.4–100 keV continuum is well described by a power law with and a high-energy cut-off at 175 keV; 2) reprocessing by two different “reflectors” (one neutral with and one ionized with 2700) is required; 3) the Fe K line profile is well fitted by a narrow component centered at 6.4 keV plus a broad component at 6.6 keV (apparently from He-like Fe).
This paper is organized as follows. In we describe the observations and data reduction. The short timescale (from few hours to 2 days) flux and spectral variability analyses are reported in and , respectively. In we perform a PSD analysis combining the short-time scale light curves from this paper with long-time scale light curves from past RXTE monitoring campaigns. In we discuss the main results, and finally in we summarize the main conclusions. Hereafter, we adopt , and (Bennet et al. 2003); with the assumed cosmological parameters, the luminosity distance of 3C 390.3 (z=0.056) is 247 Mpc. For the temporal analysis we make use of the test to assess the significance of the variability and consider a light curve significantly variable if the probability of the null hypothesis (i.e., the source being constant) is less than 1%.
2. Observations and Data Reduction
We observed 3C 390.3 with XMM-Newton on 2004 October 10 and 17 for 50 ks and 20
ks, respectively. All of the EPIC cameras (Strüder et al. 2001;
Turner et al. 2001) were operated in small window mode to prevent
photon pile-up, and with medium filters, due to the presence of bright
nearby sources in the field of view. The data reduction has been
performed following the standard procedure with
the XMM-Newton Science Analysis Software (SAS) 7.1; a detailed
description is given in Sambruna et al. (2009).
2.1. XMM-Newton
In order to cover the harder part of the X-ray band, up to 40 keV, 3C 390.3 was also observed by RXTE. Unfortunately, the RXTE coverage, which was intended to be simultaneous to the XMM-Newton observations, was carried out on 2005 January 12 and 13, i.e. nearly two months after the XMM-Newton observations, due to scheduling problems. Because of the well known long-term temporal and spectral variability of 3C 390.3, the RXTE data cannot be safely combined with the EPIC data for a broadband spectral analysis. Nevertheless, the RXTE observation, which has a total exposure of 80 ks spanning a 2-day interval, is useful for investigating the variability on intermediate timescales at higher energies.
The RXTE observations (both the new observations presented here and
the older observations used for the PSD analysis) were carried out
with the Proportional Counter Array (PCA; Jahoda et al. 1996), and the
High-Energy X-Ray Timing Experiment (HEXTE; Rotschild et al. 1998)
instruments. Here we will consider only PCA data, because the
signal-to-noise ratio (hereafter S/N) of the HEXTE data is too low for
a meaningful analysis. The PCA data were screened according to the
following acceptance criteria: the satellite was out of the South
Atlantic Anomaly (SAA) for at least 30 minutes, the Earth elevation
angle was , the offset from the nominal optical
position was , and the parameter ELECTRON-2 was
. The last criterion excludes data with high particle
background rates in the Proportional Counter Units (PCUs). The PCA
background light curves were determined using the model
developed at the RXTE Guest Observer Facility (GOF) This model is
implemented by the program pcabackest v.2.1b and is applicable
to “faint” sources, i.e., those with count rates . All the above tasks were carried out with the help
of the REX script provided by the RXTE GOF, which calls the
relevant programs from the FTOOLS v.6.5 software package and
also produces response matrices and effective area curves for the
specific time of the observation. Data were initially extracted with
16 s time resolution and then re-binned to different bin widths for
different applications. The short-term temporal analysis is
restricted to PCA, STANDARD-2 mode, 2–15 keV, Layer 1 data, because
that is where the PCA is best calibrated and most sensitive. For the
PSD study we restricted the analysis to the 2–10 keV energy band,
since this is the common energy range for RXTE, Suzaku, and XMM-Newton.
PCUs 0 and 2 were turned on throughout the monitoring
campaign. However, since the propane layer on PCU0 was damaged in May
2000, causing a systematic increase of the background, we
conservatively use only PCU2 for our analysis. All quoted count rates
are therefore for one PCU.
Suzaku observed 3C 390.3 on 2006 December 14–16 for a total exposure time of 100 ks. We used the cleaned event files obtained from version 2 of the Suzaku pipeline processing, according to standard screening criteria. The XIS0, XIS1, and XIS3 source light curves were extracted from circular regions of radius 29 centered on the source and combined in order to increase the S/N; background light curves were extracted from four circular regions offset from the source. For the HXD-PIN data reduction and analysis we followed the latest Suzaku data reduction guide, and used the rev2 data, which include all the 4 cluster units and the best background available, model D, which has a systematic uncertainty of at 1 level111ftp://legacy.gsfc.nasa.gov/suzaku/doc/hxd/suzakumemo-2008-03.pdf. See Sambruna et al. (2008) for a more detailed description of the Suzaku data reduction.
3. Short-Time Scale Flux Variability
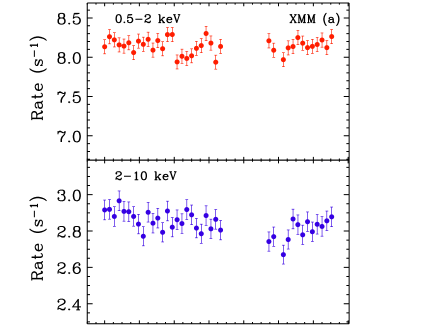
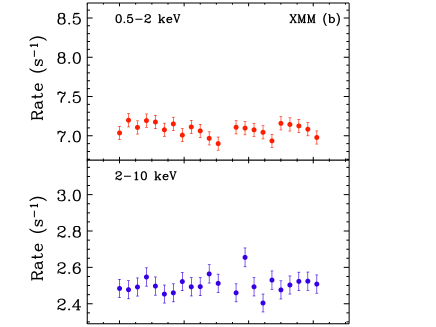
Figures 1a and 1b show the EPIC pn light curves of the soft (0.5–2 keV; top panels) and hard (2–10 keV; bottom panels) count rate on 2004 October 10 and October 17. Hereafter, for the sake of simplicity, we will refer to the 2 XMM-Newton pointings as observations A and B, respectively. The average 2–10 keV fluxes during these two observations were and erg cm-2 s-1, respectively. In order to allow a direct comparison between observations A and B, we have kept the same vertical scales in Fig. 1a and b. In this way, the significant decrease in count rate is easily discernible. Specifically, between the first and the second exposure, the EPIC pn average count rate decreases from to in the 0.5–10 keV energy band. A visual inspection of Fig. 1 suggests that, despite the presence of some small-amplitude variations during observation A, within each individual exposure the soft and hard count rates do not vary significantly. The lack of short-term variability is formally confirmed by a test and by the fractional variability analysis, whose results are reported in Table 1 and Table 2, respectively.
| Date | Instrument (Satellite) | 0.5–2 keV variability | 2–10 keV variability | ||||
|---|---|---|---|---|---|---|---|
| (yyyy/mm/dd) | () | /dof | /dof | ||||
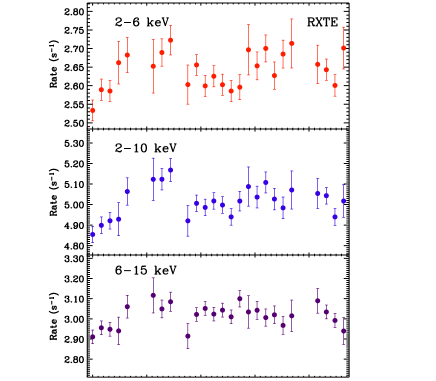
| 2004/10/10 | EPIC pn (XMM) | 41.08/37 | 0.30 | 47.20/37 | 0.12 | ||
| 2004/10/17 | EPIC pn (XMM) | 20.01/21 | 0.52 | 19.07/21 | 0.58 | ||
| 2005/01/12-13 | PCA (RXTE) | 58.37/24 | |||||
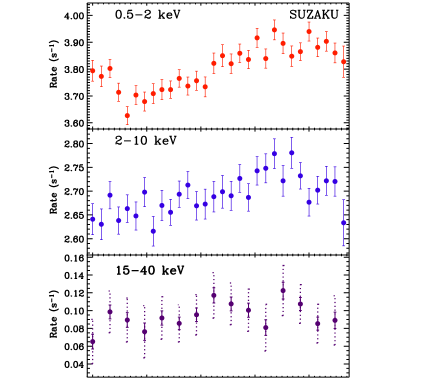
| 2006/12/14-16 | XIS (Suzaku) | 105.24/29 | 42.97/29 | ||||
| Date | Instrument (Satellite) | HR variability | ||||
|---|---|---|---|---|---|---|
| (yyyy/mm/dd) | /dof | |||||
| 2004/10/10 | EPIC pn (XMM) | 38.92/37 | 0.38 | |||
| 2004/10/17 | EPIC pn (XMM) | 21.61/21 | 0.42 | |||
| 2005/01/12-13 | PCA (RXTE) | 24.22/24 | 0.45 | |||
| 2006/12/14-16 | XIS (Suzaku) | 37.7/29 | 0.13 | |||
a The soft band is 0.5–2 keV for XMM-Newton and Suzaku, whereas for RXTE it is 2–6 keV.
b Similarly, the hard band corresponds to 2–10 keV for XMM-Newton and Suzaku, and to 6–15 keV for RXTE.
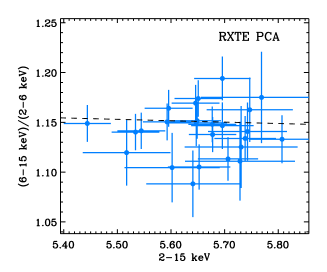
3.1. RXTE
RXTE observed 3C 390.3 on 2005, January 12 and 13, when the source was in a very high brightness state: the average 2–10 keV flux was erg cm-2 s-1 with a corresponding luminosity of erg s-1, which is slightly higher than the maximum value registered in the two-year RXTE monitoring campaign (Gliozzi et al. 2006). The left panel of Figure 2 shows the light curves in the 2–6 keV (top panel; ), 2–10 keV (middle panel; ), and 6–15 keV (bottom panel; ) energy bands, respectively. Since the RXTE PCA is best calibrated in the 2–15 keV energy band, a direct comparison with the soft EPIC pn light curve described above cannot be performed. Nevertheless, RXTE allows a direct comparison in the 2–10 keV range and also the investigation of the harder X-rays up to 15 keV. On timescales of the order of 2 days, the source count rate is clearly variable in the 2–10 keV energy band (Table 1). The fact that the harder band is only marginally variable (it is variable at a 95% confidence level) can be ascribed to the lower data quality at higher energies.
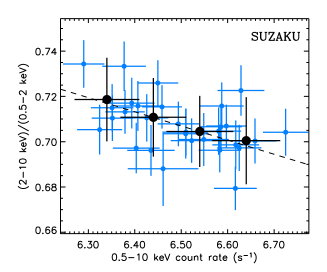
3.2. Suzaku
Suzaku observed 3C 390.3 on 2006 December 14–16, when the source was in a brightness state similar to that observed by XMM-Newton 2 years earlier (erg cm-2 s-1). The XIS 0.5–2 keV and 2–10 keV light curves are shown in the top and middle panels of Fig. 2b. Just as with the RXTE PCA light curves, both XIS light curves show significant (and correlated) variability on timescales of 2 days, confirmed by a test whose results are reported in Table 1.
The HXD PIN instrument aboard Suzaku offers for the first time the opportunity to investigate the variability of 3C 390.3 at harder X-ray energies. Using the latest background file, we extracted light curves in the 15–40 keV and 40–70 keV ranges; no variability was detected in the harder energy band (), while significant variability () seems to be present in the 15–40 keV energy band, which is shown in the bottom panel of Fig. 2b. However, if we increase the PIN background level by applying systematic corrections at 1, 2 and 3 levels, we obtain values of , 0.16, and 0.52, respectively. Suzaku observations thus indicate that there is significant variability in the energy range 0.5–10 keV, while above 15 keV the uncertainties on the HXD background prevent us from drawing strong conclusions.
In summary, on short timescales (few hours) the flux of 3C 390.3 is consistent with the hypothesis of being constant in all energy bands. On longer timescales (i.e., considering the two XMM-Newton observations together or the 2-day RXTE and Suzaku coverage) the flux variability becomes significant.
4. Short-Time Scale Spectral Variability
In order to study the spectral variability of 3C 390.3, we use simple methods such as the variation of the hardness ratio with time and with total count rate, and the fractional variability in different energy bands. These can provide useful information without any a priori assumption about the shape of the X-ray continuum. Thus, the results from the study of these plots can be considered as “model-independent”.
To investigate the presence of spectral variability, we first apply a test to the time series of the hardness ratio , where 2–10 keV and 0.5–2 keV for XMM-Newton and Suzaku, whereas for RXTE 6–15 keV and 2–6 keV. The results of this test are reported in Table 2 and suggest that there is no significant spectral variability on timescales of a few hours, while on a time scale of 2 days (Suzaku observation) marginally significant spectral variability seems to be present. It is worth noting that even between XMM-Newton observations A and B only marginally significant spectral variability seems to occur: the average increases from to , which is a effect. This is a direct consequence of the fact that the soft and hard count rates vary by the same amount: they both decrease by 12% in one week (see Fig. 1).
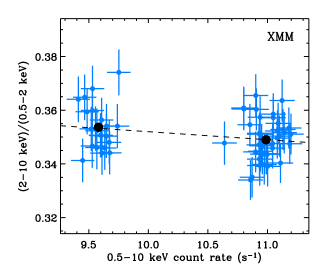
Spectral variability can be further investigated by plotting versus
the total count rate. Figure 3 shows the -count
rate plots for XMM-Newton (left panel), RXTE (middle panel), and Suzaku (right panel), respectively. The superimposed dashed lines represent
the best-fitting straight lines, which were obtained using the routine
fitexy (Press et al. 1997) that accounts for the errors not
only on the y-axis but along the x-axis as well. Specifically, this
analysis yielded: for XMM-Newton,
for RXTE and
for Suzaku, respectively. In summary,
while XMM-Newton and RXTE observations show very flat negative slopes
that are consistent with the hypothesis of constancy, Suzaku shows a
negative trend (i.e., a steepening of the spectrum with increasing
source flux) that is significant at a level. This result
is confirmed by a non-parametric Spearman test that yields a rank correlation
value of -0.44 and a corresponding chance probability of .
Another simple way to quantify the spectral variability of 3C 390.3, without considering the time ordering of the values in the light curves, is based on the fractional variability parameter . This is a commonly used measure of the intrinsic variability amplitude relative to the mean count rate, corrected for the effect of random errors, i.e.,
| (1) |
where is the variance, the unweighted mean count rate, and the mean square value of the uncertainty associated with each individual count rate. The error on , reported in Table 2, has been estimated following Vaughan et al. (2003). For all individual observations, we computed on the soft and hard energy bands (as defined above), since the relatively short observations and the moderately low count rate do not allow this kind of analysis on multiple narrow energy bands. The results, summarized in Table 2, indicate that the variability amplitudes measured in the 2 energy bands are consistent with each other within the uncertainties. During the Suzaku observation there is marginal evidence () that the soft band is more variable than the hard one.
5. Power Spectral Density Analysis
To estimate the power-spectrum of the source in the 2–10 keV energy band we used: 1) the 1999 and 2000 RXTE light curve, using a 3–day bin size (“rxte-long” light curve, hereafter), 2) the 1996, 2-month long, RXTE light curve, using a 1–day bin size (“rxte-medium” light curve, hereafter), 3) the 2005, 2–day long, RXTE light curve (“rxte-short” light curve, hereafter), 4) the 2006, 2–day long, Suzaku XIS light curve, and 5) the October 10 and 17, 2004, XMM-Newton EPIC pn light curves. We used a 5760 s binning for the rxte-short and XIS light curves, and a 200 s binning for the XMM-Newton light curves. The October 10 2004, XMM-Newton light curve was split in two parts to exclude the hours period of enhanced background activity, which was detected hours after the start of the observation.
All light curves are evenly sampled, with a few missing points (about % of the total number of points). These missing points are randomly distributed over each light curve, and we accounted for them using a linear interpolation between the two bins adjacent to the gaps, adding the appropriate Poisson noise in each case.
We used equation (1) in Papadakis & Lawrence (1993) to compute the periodograms of each light curve, after normalizing them to their mean. The expected Poisson noise power level for the rxte-long and rxte-medium light curves is comparable, and for this reason we combined their periodograms in one file, and we sorted them in order of decreasing frequency (the “low-frequency” periodogram). This combined periodogram can be used for the estimation of the long and medium time scale power spectrum, from a frequency /(few days), down to /(2 years). The rxte-short and XIS light curves also have comparable Poisson noise power level, and we therefore combined their periodograms forming the “medium-frequency” periodogram to estimate the power spectrum at higher frequencies of the order of (a few hours). Finally, we also combined the XMM-Newton periodograms, in an attempt to detect a source signal at even higher frequencies (the “high frequency” periodogram).
Following Papadakis & Lawrence (1993), we binned the three periodograms in log-log space, using bins of size 20, and their equations (18), (19), and (20) (for the estimation of the error of the resulting binned PSD points). Our results are plotted in Fig. 4. Filled triangles indicate the high frequency PSD, estimated using the high-frequency, XMM-Newton periodogram. The solid line indicates the expected Poisson power level. Clearly, at frequencies higher than Hz, we cannot detect any intrinsic variations. The open squares in the same figure indicate the low and medium frequency PSD estimates. At low frequencies, the source PSD shows the familiar “red-noise” power spectral shape.
We fitted the low frequency PSD with a simple power-law model of the form , taking into account the different Poisson noise power levels for the medium-frequency PSD estimate (indicated by the open square around Hz) and the low-frequency PSD (open squares at frequencies lower than Hz). We have also accounted for aliasing effects, as they can be estimated analytically for any given PSD model shape, following the analytical expressions in section 7.1.1 of Priestley (1989). The model describes reasonably well the PSD: the best-fit slope is (errors correspond to 68% confidence limits for two interesting parameters), degrees of freedom (dof), probability of null hypothesis, Pnull, of 4.6%. The dashed line in the left panel of Fig. 4 indicates the best-fit power-law model, and the thick solid black line, the best-fit model after taking into account the different Poisson noise power levels for the low and medium-frequency power spectra (best-fit residuals are shown in the bottom panel of the same figure). The best-fit slope is consistent with the high-frequency PSD slope detected in radio-quiet Seyfert galaxies. The steepness of the intrinsic power spectrum can explain the lack of detection of intrinsic source variations in the XMM-Newton light curves: the expected amplitude at the highest frequencies we can probe is much smaller than the amplitude caused by noise in the XMM-Newton light curves.
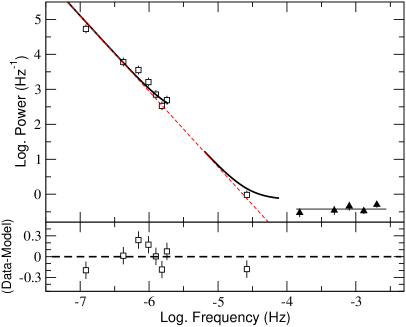
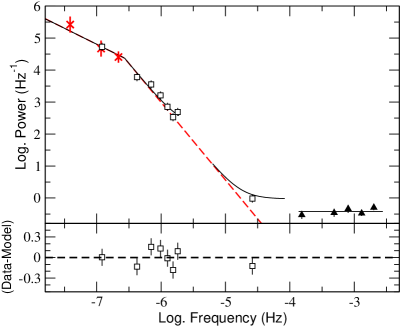
We also tried to fit the PSD with a broken power-law model of the form: , where and , at higher frequencies; is the so called “break-frequency”. Such a model provides a good fit to the PSD of many Seyfert galaxies with and (see, e.g., Uttley, McHardy & Papadakis 2002; Papadakis et al. 2002a; Markowitz et al. 2003). Since the 3C 390.3 PSD does not show a clear slope change at low frequencies, we kept fixed at 1, which is the typical value found in Seyfert galaxies. Note that, in case is left free to vary, all parameters are very poorly constrained, due to paucity of data points at low frequencies. The best-fit parameters are as follows: Hz (68% errors for 3 interesting parameters: high frequency slope, break frequency, and normalization), dof, Pnull=25.2%. The resulting best-fit model is shown in the right panel of Fig. 4 (the symbols are the same as in the left panel), and indicates that it fits the PSD very well. According to an F-test (, ), the broken power-law model provides an improvement of the goodness of fit at a confidence level of 92%, compared to the power-law model. At the same time, the PSD plotted in the right panel of Fig. 4 indicates that the detection of this break-frequency in the power spectrum of the source is determined mainly by the lowest frequency point in the PSD. The points indicated by the crosses in the same panel, show the lowest frequency part of the power spectrum. They correspond to the 20 lowest frequency periodogram ordinates, and were estimated using bins of size 5 and 10, for the higher frequency point. These points indicate that the low frequency end of the PSD does follow a slope which is flatter than the slope of the high frequency PSD. Nevertheless, to be conservative, we consider the detection of a break-frequency in the PSD of 3C 390.3 as tentative.
6. Discussion
In order to put our results in perspective and better understand their implications, it is important to have in mind the values of the fundamental parameters that characterize the accretion process in 3C 390.3, namely the black hole mass, , and the accretion rate in Eddington units, . To be consistent with the companion paper from Sambruna et al. (2009), in the following we assume , which is based on the velocity dispersion presented in Nelson et al. (2004) and is reported by Lewis & Eracleous (2006). However, for completeness and given the large uncertainties, we also consider the value obtained via reverberation mapping (Peterson et al. 2004) Once is determined, readily follows, by determining the bolometric luminosity, , and dividing it by the Eddington luminosity, erg s-1. can be obtained by integrating the broadband spectral energy distribution (SED) of 3C 390.3. A detailed compilation of broadband data of 3C 390.3 ranging from the radio to the hard X-rays has been presented by Sambruna et al. (2009), yielding a bolometric luminosity in the range 1–4 erg s-1 (this luminosity range is a direct consequence of the long-term intrinsic variability of 3C 390.3). Combining these values with , we obtain an Eddington ratio ranging between 0.01 and 0.07 (0.03–0.1 for ), which is consistent with the lower end of the accretion rate values typically inferred in Seyfert 1 galaxies (see Vasudevan & Fabian 2009 for a recent compilation). For a source with powerful radio jets as 3C 390.3, it is also important to know the inclination angle, since beamed emission can affect any energy band including the X-rays. Based on radio data, the jet inclination angle in 3C 390.3 lies between 30° and 35° and the estimated jet velocity is (Giovannini et al. 2001). This translates into bulk Lorentz factors in the range , which in turn yield beaming factors in the range , implying that the jet emission can be either de-beamed or beamed but in a moderate way.
The main aim of this work is to utilize the results from the short-term variability and power spectral density analyses to derive model-independent constraints on the central engine of 3C 390.3 and possibly on radio-loud AGN in general. More specifically, our findings can be used to evaluate the competing models proposed to explain the weaker X-ray reprocessing features in BLRGs, namely dilution from the base of the jet, radiatively inefficient flow (RIAF) in the central region, or the presence of a highly ionized reflector.
6.1. Flux variability
Previous X-ray monitoring campaigns have shown that 3C 390.3 is highly variable on timescales ranging from several days to months. For example, using a 9-month light curve of 3C 390.3 from the ROSAT HRI (which probes the 0.1–2.4 keV energy band), Leighly & O’Brien (1997) demonstrated that the soft X-rays are highly variable, displaying large flares with quiescent periods in between, a behavior that and implies a non-linear nature for the variability process. Similarly, two long-term monitoring campaigns with RXTE, spanning respectively 3 months and 2 years, revealed that the source is highly variable also at higher X-ray energies with ranging between 20 and 30% (Gliozzi et al. 2003a; 2006). However, since both ROSAT and RXTE are low-Earth orbit satellites the light curves were continuously interrupted, hampering the study of variability on timescales of hours.
XMM-Newton, with its highly elliptical orbit, has allowed the study of the short-term variability of 3C 390.3 for the first time. The EPIC light curves showed a lack of any significant short-term variability, despite the fact that the source was caught in a fairly high flux state. The lack of short-term variability lends support to the scenario where the jet does not play an important role in the X-ray emission of 3C 390.3 from 2 different points of view. First, it confirms on firmer statistical ground that 3C 390.3 follows the scaling relations typical of radio-quiet AGN that predict the short-term variability to be negligible in AGN with large . Second, it reveals a marked difference with respect to the typical behavior observed in jet-dominated sources, which show strong variability down to timescales of few minutes (e.g., Cui 2004). According to the current blazar paradigm, the observed short-term variability at high energies is a direct consequence of the small size of the emitting region and the observed variability timescales are further shortened by beaming effects: . As a consequence, the lack of short-term variability in 3C 390.3 suggests that the X-ray emitting region is extended and that the beaming effects, if present, are negligible in this energy band.
The 2-day long observations carried out with RXTE and Suzaku confirm that on timescales longer than a few hours, the X-ray emission of 3C 390.3 varies significantly. Additionally, the analysis of Suzaku HXD-PIN data suggests a possible detection of low-amplitude flux changes up to 40 keV. However, the current uncertainties on the HXD background prevent us from drawing strong conclusions.
Important results from the temporal study can also be derived by the PSD analysis, which is the best developed timing technique and the one commonly used for investigating the time variability properties of Galactic black hole systems (GBHs) and AGN. Indeed, recent detailed PSD studies have been used to strengthen the link between GBHs and AGN (e.g., Uttley et al. 2002; Markowitz et al. 2003, McHardy et al. 2004).
The comparison of the PSD frequency break (indicative of a characteristic timescale of the BH system) in GBHs and AGN has provided an alternative way to determine the BH mass in AGN. McHardy et al. (2006) proposed that, in Seyfert galaxies, the break timescale, , scales with and , following the relationship: , where is measured in units of , and in units of erg s-1. Using in the above formula and erg s-1, obtained from the direct integration of the SED, we obtain that ranges between 60 and 234 days (20–66 days for ). Interestingly, this result is consistent with the temporal break inferred from our PSD analysis: days.
McHardy and collaborators (2006) also found a tight correlation between and the full width at half maximum (FWHM) of the line: . Taking into accout the uncertainties on the slope, and using the value derived from our PSD analysis, d, the predicted FWHM() for 3C 390.3 ranges between 2000 and 26,000 , which is fully consistent with the value of 12,700 derived from a time-averaged spectrum over several years (Sergeev et al. 2002).
The agreement between the predicted and the measured value of is important in two respects. First, it lends further support to the detection of the break in the PSD of 3C 390.3. We do note that, owing to the relatively short monitoring baseline of 3C 390.3 (2 years as opposed to 5–10 years used in Seyfert studies), the detection of a break is significant only at the 92% confidence level. Nevertheless, we emphasize that this is the best estimate afforded by the current data and no improvement on the break determination will be possible in the years to come, since 3C 390.3 is not monitored by any X-ray satellite. Second, and perhaps more important, it suggests that the flux variability properties of this BLRG are indistinguishable from those of radio-quiet AGN. In contrast, PSD studies of the most prominent blazars, Mrk 421, Mrk 501, and PKS (i.e., jet-dominated AGN that have been observed with RXTE in long monitoring campaigns) suggest the presence of PSD breaks at frequencies that are nearly two orders of magnitude higher than the tentative break found in 3C 390.3, i.e., at Hz, or day (Kataoka et al. 2001). As a consequence, the variability properties of 3C 390.3 appear to be incompatible with jet emission. On the other hand, the similarity between the variability properties of Seyfert galaxies and 3C 390.3 PSDs suggests that the X-ray variability process, and by extension the X-ray emission mechanism are similar between these two classes of object.
6.2. Spectral Variability
Previous studies, based on RXTE monitoring campaigns over periods ranging from a few months to two years, have revealed that 3C 390.3 shows correlated flux and spectral variations: the source spectrum softens as the source becomes brighter (Gliozzi et al. 2003a, 2006), which is the typical behavior observed in Seyfert galaxies (e.g., Papadakis et al. 2002b). Since these studies were performed in the 2–15 keV energy range, only our December 2005 RXTE observation can be formally compared with previous results. Unfortunately, due to the short duration of that observation and the limited range of the observed flux variations (compared to the long monitoring campaigns), no significant spectral variability is detected.
Thanks to the combination of XIS0, XIS1, and XIS3 data, and their relatively low background level, the Suzaku light curves have higher S/N than RXTE and the -count rate plot clearly indicates that 3C 390.3 is consistent with the typical Seyfert-like behavior over a time interval of 2 days. It is worth noting that, unlike RXTE that covers only the hard X-ray range, Suzaku makes it possible to probe simultaneously soft (i.e., E 2 keV) and hard energies. This is of crucial importance for BLRGs that have generally complex X-ray spectra, which cannot be fitted with a simple power law suggesting possible contributions from different physical components (see, e.g., Sambruna et al. 2009). For example, based on spectral variability results, Kataoka et al. (2007) proposed that the soft X-ray emission of 3C120 (another archetypal BLRG) was dominated by a jet.
In this context, the fact that the Suzaku results are in full agreement with those obtained from an analogous analysis of long-term 2–15 keV RXTE data, suggests that also at softer energies the emission is dominated by the same Comptonized component as in Seyfert galaxies. This conclusion is further confirmed by the fact that soft (0.5–2 keV) and hard (2–10 keV) count rates appear to vary in concert (see Fig. 2 right panel). This result does not exclude the possible presence of an additional component with constant flux (such as some contribution from reflection), but it rules out the presence of a variable component, such as the beamed emission from a jet.
Further support for the latter conclusion comes from the spectral variability analysis of XMM-Newton data: soft and hard count rate appears to vary roughly in concert not only within each single XMM-Newton observation but also between the 2 XMM-Newton pointings that are separated in time by 1 week and in flux by 12%. At this point, one might wonder why XMM-Newton with its superior throughput is unable to detect a statistical significant anti-correlation in the plot at a confidence level higher than . The reason is simply that on short timescales (individual exposures) count rate and are constant, therefore all the information from one exposure virtually collapses to a single data point. As a consequence, the search for a negative trend in the plot is based on 2 data points solely.
7. Summary and Conclusions
We have studied the short-term temporal and spectral variability properties of the BLRG 3C 390.3 using XMM-Newton, RXTE, and Suzaku observations carried out between October 2004 and December 2006. Our new data were then combined with older RXTE data obtained from long-term monitoring campaigns to investigate the PSD in detail. The main findings of our analysis can be summarized as follows:
-
•
On short timescales (i.e., few hours, probed by uninterrupted XMM-Newton observations) the flux of 3C 390.3 in all energy bands is consistent with the hypothesis of being constant. On longer timescales (i.e., considering the two XMM-Newton observations together or the 2-day RXTE and Suzaku coverage) the flux variability becomes significant.
-
•
A detailed PSD analysis carried out over five decades in frequency suggests the presence of a break at days at a 92% confidence level. This is the second tentative detection of a PSD break in a radio-loud, non-jet dominated AGN, after the recent results of the BLRG 3C 120 from Marshall et al. (2009). Importantly, the time scale corresponding to the break frequency is in agreement with the relation between , , and as well as with the relationship, both of which are valid for Seyfert galaxies. Note that, while the relative brevity of the long-term RXTE campaign hampers the significance of the break detection around 40 days, the quality of the data is sufficient to rule out the presence of a break at shorter timescales, which is typically detected in PSDs of jet-dominated sources.
-
•
The 2-day long Suzaku observation indicates that 3C 390.3 shows the typical spectral evolution of Seyfert galaxies in the 0.5–10 keV energy range (the spectrum becomes softer as the source brightens). This confirms previous results, based on long RXTE monitoring campaigns, and expands them to different energy bands and to much shorter timescales.
-
•
The broadly coordinated variability in soft and hard X-rays during the 2-day Suzaku observation and between the 2 XMM-Newton pointings, taken one week apart, suggests a common physical origin for both energy bands, arguing against the presence of an additional variable component (i.e., a jet) emerging at softer energies.
-
•
The lack of short-term flux variability, the frequency break of the PSD, and the Seyfert-like spectral variability consistently argue against a scenario where a jet plays a significant role in the X-ray regime, confirming the results from the time-averaged spectral analysis (Sambruna et al. 2009).
In conclusion, all our results indicate that the flux variability properties of 3C 390.3 are broadly consistent with those of radio-quiet AGN, suggesting that the X-ray variability process and, by extension, the emission mechanism in 3C 390.3 is similar to that of Seyfert galaxies. This, in turn, suggests that the weaker reflection features observed in the X-ray spectrum of 3C 390.3 are not a result of dilution by jet emission, in agreement with the conclusions of the spectral analysis of Sambruna et al. (2009). If variability studies of other BLRGs show similar results, then jet dilution will be disfavored as a general explanation of the weak reflection features in all BLRGs as a class. Of course, the jet can still influence the observed X-ray properties of BLRGs by obscuring the central regions of the accretion disk or by beaming radiation away from the disk surface. The obscuration scenario has been suggested by Sambruna et al. (2009) and Larsson et al. (2008) to account for the lack of reflection from the inner accretion disk in 3C 390.3 and 4C+74.26, respectively. Unfortunately, this scenario would also block from view the region of the accretion flow where the jet is formed. Significant progress can be made by deep broadband observations of a large number of BLRGs so as to sample a wide variety of accretion disk geometries. The variability analysis presented here shows that, as long as the jet angle to line of sight is large enough, such an investigation will not be subject to the effects of jet dilution.
References
- Ballatyne et al. (2004) Ballantyne, D.R., Fabian, A.C., & Iwasawa, K. 2004, MNRAS, 354, 839
- Ballatyne (2005) Ballantyne, D.R. MNRAS, 362, 1183
- Bennet et al. (2003) Bennet, C.L. et al. 2003, ApJS, 148, 1
- Cui (2004) Cui, W. 2004, ApJ, 605, 662
- Eracleous et al. (1996) Eracleous, M., Halpern, J.P., & Livio, M. 1996, ApJ, 459, 89
- Eracleous et al. (2000) Eracleous, M., Sambrunna, R., & Mushotzky, R.F. 2000, ApJ, 537, 654
- Giovannini et al. (2001) Giovannini, G., Cotton, W.D., Feretti, L., Lara, L., & Venturi, T. 2001, ApJ, 552, 508
- (8) Gliozzi, M., Sambruna, R.M., & Eracleous, M. 2003a, ApJ, 584, 176
- (9) Gliozzi, M., Sambruna, R.M., & Brandt, W.N. 2003b, A&A, 408, 949
- Gliozzi et al. (2006) Gliozzi, M., Papadakis, I.E., & Raeth, C. 2006, A&A, 449, 969
- Gliozzi et al. (2007) Gliozzi, M., et al. 2007, ApJ, 664, 88
- Gliozzi et al. (2008) Gliozzi, M., Foschini, L., Sambruna, R.M., & Tavecchio, F. 2008, A&A, 478, 723
- Grandi et al. (1999) Grandi, P., et al. 1999, A&A, 343, 33
- Grandi et al. (2006) Grandi, P., Malaguti, G., & Fiocchi, M. 2006, ApJ, 642, 113
- Inda et al. (1994) Inda, M., et al. 1994, ApJ, 420, 143
- Jahoda et al. (1996) Jahoda, K., Swank, J., Giles, A.B., et al. 1996, Proc.SPIE, 2808, 59
- Kataoka et al. (2001) Kataoka, J., et al. 2001, ApJ, 560, 659
- Kataoka et al. (2007) Kataoka, J., et al. 2007, PASJ, 59, 279
- Larsson et al. (2008) Larsson, J., Fabian, A.C., Ballantyne, D.R., & Miniutti, G. 2008, MNRAS, 388, 1037
- Leighly et al. (1997) Leighly, K.M., et al. 1997, ApJ, 483
- Leighly & O’Brien (1997) Leighly, K.M. & O’Brien, P.T. 1997, ApJ, 481, L15
- Lewis et al. (2005) Lewis, K.T., et al. 2005, ApJ, 622, 816
- Lewis & Eracleous (2006) Lewis, K.T. & Eracleous M. 2006, ApJ, 642, 711
- Markowitz et al (2003) Markowitz, A. et al. 2003, ApJ, 593, 96
- Marshall et al. (2009) Marshall, K., et al. 2009, ApJ, 696, 601
- McHardy et al. (2004) McHardy, I., et al. 2004, MNRAS, 348, 783
- McHardy et al. (2006) McHardy, I., et al. 2006, Nature, 444, 730
- Nelson et al. (2004) Nelson, C.H., Green, R.F., Bower, G., Gebhardt, K., & Weistrop, D. 2004, ApJ, 615, 652
- Ogle et al. (2004) Ogle, P.M. et al. 2004, ApJ, 618, 139
- (30) Papadakis, I.E. & Lawrence, A. 1993, MNRAS, 261, 612
- (31) Papadakis, I.E. et al. 2002a, A&A, 382, L1
- (32) Papadakis, I.E. et al. 2002b, ApJ, 573, 92
- Papadakis et al. (2008) Papadakis, I.E.,Ioannou, Z., Brinkmann, W., & Xilouris, E.M. 2008, A&A, 490, 995
- Peterson et al. (2004) Peterson, B.M., et al. 2004, ApJ, 613, 682
- Press et al. (1997) Press, W.H., Teukolsky, S.A., Vetterling, W.T., & Flannery, B.P. 1997, Numerical Recipes (Cambridge: Cambridge Univ. Press)
- Priestley (1989) Priestley, M.B. 1989, Spectral Analysis and Time Series, Academic Press, London.
- Rotschild et al. (1998) Rotschild, R.E., Blanco, P.R., Gruber, D.E., et al. 1998, ApJ, 496, 538
- Sambruna et al. (1999) Sambruna, R.M., Eracleous, M., & Mushotzky, R. 1999, ApJ, 526, 60
- Sergeev et al. (2002) Sergeev, S.G., Pronik, V.I., Peterson, B.M., Sergeeva, E.A., & Zheng, W. 2002, ApJ, 576, 660
- Strüder et al. (2001) Strüder, L., Briel, U., Dennerl, K., et al. 2001, A&A, 365, L18
- Turner et al. (2001) Turner, M.J., Abbey, A., Arnaud, M., et al. 2001, A&A, 365, L27
- Uttley et al. (2002) Uttley, P., McHardy, I., & Papadakis, I.E. 2002, MNRAS, 332, 231
- Vasudevan & Fabian (2008) Vasudevan, R.V. & Fabian, A.C. 2008, MNRAS, 392, 1124
- Vaughan et al. (2003) Vaughan, S., Edelson, R., Warwick, R.S., & Uttley, P. 2003, MNRAS, 345, 1271
- Woźniak et al. (1998) Woźniak, P.R., Zdziarski, A.A., Smith, D., Madejski, G.M., & Johnson, W.N., 1998, MNRAS, 299, 449
- Zdziarski & Grandi (2001) Zdziarski, A.A. & Grandi, P. 2001, ApJ, 551, 186