e-mail k.potzger@fzd.de, Phone +49-351-2603148, Fax +xx-xx-xxx
XXXX
Non-DMS related ferromagnetism in transition metal doped zinc oxide
Abstract
\abstcolWe review pitfalls in recent efforts to make a conventional semiconductor, namely ZnO, ferromagnetic by means of doping with transition metal ions. Since the solubility of those elements is rather low, formation of secondary phases and the creation of defects upon low temperature processing can lead to unwanted magnetic effects. Among others, ion implantation is a method of doping, which is highly suited for the investigation of those effects. By focussing mainly on Fe, Co or Ni implanted ZnO single crystals we show that there are manifold sources for ferromagnetism in this material which can easily be confused with the formation of a ferromagnetic diluted magnetic semiconductor (DMS). We will focus on metallic as well as oxide precipitates and the difficulties of their identification.
pacs:
61.72.uj, 61.05.cp, 61.72.uj, 75.50.Tt, 75.50.Pp, 76.80.+y1 Introduction: A little history of (diluted) magnetic semiconductors
Magnetic semiconductors are recently considered as one of the main building blocks for future replacement of conventional electronics by spin-electronics or spintronics [1]. The latter is a field of materials research born from the need of higher speed, lower power consumption and smaller integration densities of computational devices. A model device of spintronics was proposed already in the year 1990, i.e. the Datta-Das field effect transistor [2]. The Datta-Das transistor allows the modulation of the spin-polarized electron current flowing through a two dimensional electron gas. In contrast to other devices, due to application of a gate voltage, the spin direction of the electrons and thus the magneto-resistance between source and drain is altered. For creation and detection of spin polarized electron, Datta and Das proposed ferromagnetic iron contacts. The efficiency of spin injection from metals, as well as other materials, into semiconductors was recently described by A. M. Bratkovsky [3]. The main obstacle is the large conductivity mismatch between the ferromagnetic metal and the semiconductor. The latter strongly reduces the spin polarization in the semiconductor down to below 0.1% [4] even for a spin polarization of 99% in the metal contact. Thus, low conductivity mismatch at 100% spin polarization is required. Among other solutions like tunnel barriers or layers between the metal and the semiconductor, the use of ferromagnetic semiconductors as source contacts is proposed. A well known semiconductor with spin polarized charge carriers is EuO. EuO has a band gap of 1.12 eV and a Curie temperature of 69 K. The spin splitting of the conduction band amounts to 0.6 eV. By means of doping, the conductivity of EuO can be tuned. These basic properties are shortly reviewed by A. Schmehl et al. [5], who showed that the spin polarization of charge carriers in epitaxial EuO exceeds 90%. Moreover, a heterostructure based on EuO grown on GaN or Si was realized. The low Curie temperature of EuO, however, makes it inappropriate for everyday electronics. Therefore, efforts for increasing its Curie temperature as well as mining for alternative spin-injectors are undertaken. One alternative is considered to be a ferromagnetic diluted magnetic semiconductor (DMS). DMS materials have been investigated already about 30 years ago [6]. The investigations concentrated mainly on II-VI semiconductors like CdSe or CdTe doped with up to 45% of Mn2+. These compounds, although paramagnetic, exhibit extraordinary properties at low temperatures and/or large magnetic fields. Such effects as giant Faraday rotation, bound magnetic polaron, giant Zeeman splitting of the electronic (band and impurity) levels originate from the magnetic exchange interaction between the sp electrons of the semiconductor host and the localized d-electrons of the Mn impurity. The exchange integral was actually determined to be larger for p-d than for s-d interaction. Thin film DMS based on Mn doped III-V semiconductors have been grown successfully in the 1990 ies by low temperature molecular beam epitaxy, i.e. InMnAs [7] and GaMnAs [8]. The field of DMS was greatly pushed in the year 2000 when Ga1-xMnxAs was, both experimentally and theoretically, found to be ferromagnetic up to 110 K. The mechanism of the ferromagnetic interaction is based on the exceptional case that Mn doping introduces shallow acceptors and thus holes into the valence band of the GaAs that are antiferromagnetically coupled to the local Mn moments. T. Dietl calculated the Curie temperature of different p-type semiconductors doped with Mn ions [9]. He found that it is proportional to the concentration of the impurities and to the squire root of the p-type charge carrier concentration. Recently, the Curie temperature of Ga1-xMnxAs could be increased up to 173 K by means of increasing its crystalline quality and the number of Mn impurities up to 6.8% [10]. Room-temperature ferromagnetism has been predicted for 5% Mn doped p-type ZnO or GaN. Note that the predictions have been criticised recently [11]. Later, the theory was extended to n-type material with V, Cr, Fe, Co or Ni dopants [12]. The Curie temperature for those cases is predicted to scale with the square root of the impurity concentration. Note that for selected TM there are sometimes exceptions from the equilibrium solubility limits, i.e. wurtzite Zn1-xTMxO with x5% can be formed. One example is Rinmans green (well known since 1780), a pigment basing on Zn1-xCoxO, created from firing of a mixture of ZnO and CoO powders. Recent experiments on the creation of Zn1-xCoxO thin films with controlled transport properties has been performed by pulsed laser deposition, but especially high quality films only show paramagnetism [13, 14, 15, 16, 17]. Besides ferromagnetic order induced by indirect d-d exchange, defect mediated coupling of the local d-electrons was recently considered. J. M. D. Coey et al. developed a model where triplet molecular orbitals form an impurity band. If narrow enough, the impurity band can split spontaneously. On the other hand it can also indirectly couple localized electrons (if present) [18]. As point defects for mediation of ferromagnetic coupling, e.g. between dispersed Co ions, usually oxygen vacancies or Zn interstitials are considered [19, 20]. Those are believed to provide n-type charge carriers. In ref. [20], Zn interstitials have been introduced and removed in a controlled way, altering the magnetic properties of Co doped ZnO. On the other hand Zn vacancies are also proposed to mediated TM d-electrons by other groups [21, 22, 23, 24]. In Ref. [24] the authors identified a deep acceptor trap due to Zn vacancies and this finding suggests the possibility of hole-mediated ferromagnetism in ZnO. Kittilstved et al. recently pointed out the important role of uncompensated p-type dopants for the creation of ferromagnetic Mn-diluted ZnO [25]. Further evidence for defects enhancing ferromagnetism in Co doped ZnO is given in Refs. [26, 27]. The common feature about the above mentioned research is the indirect magnetic coupling of localized d-moments leading to spin-polarized currents. By creating various layered architectures basing on TM, but mainly Co doped ZnO, magneto-resistance effects have been observed which proof the creation of such currents from the exchange interaction between localized and itinerant charge carriers [28, 29, 30, 31]. Especially the combination of magneto-optical measurements and anomalous Hall effect is mentioned to confirm this effect [32]. In our paper we would like to point out sources for non-intrinsic, i.e. non DMS related ferromagnetic properties in order to sharpen the eye against false interpretation.
2 Analysis techniques
In table 1, we shortly give an overview of analysis techniques we used during our research and point out relevant information provided by the methods. The main obstacle about choosing the right analysis technique arises from the fact that magnetic signals detected in transition metal doped ZnO usually are small so that they are sometimes only detectable by SQUID magnetometry. This technique, however, is an integral method. There are several modi for data acquisition like magnetization vs. field, temperature or time measurements giving deeper insight about the character of the magnetic ordering. Nevertheless there are several pitfalls about using SQUID recently collected in ref. [33]. Therefore it is desired to use element specific analysis methods in order to correlate the magnetic properties with the element responsible for them. One of the most basic methods in investigating of TM impurities as well as intrinsic defects with unpaired spins in ZnO is electron paramagnetic resonance (EPR). As technique, EPR spectroscopy is based on a detection of resonance absorption of electromagnetic energy corresponding to transitions between electron-spin energy levels split by internal effects (crystal field anisotropy, exchange interactions, spin-orbital effects) and/or by an applied magnetic field. Mn, Fe, and Cu impurities as well as single crystals have been investigated by EPR already a few decades ago. For Cu doped ZnO [34], a 2+ state indicating Zn substitution was found. The main conclusion is the extension of the Cu t2 acceptor wave function towards the nearest neighbours in the crystal. Mn impurities in ZnO have been observed by EPR already in 1958[35]. One of the most interesting 3d impurities in ZnO is Fe, since it occurs, although substitutional, in a 3+ oxidation state [36]. The general tendency of Fe to develop the Fe3+ state in II-VI materials can be understood from the stable 3d5 configuration achieved (similar to Mn2+ in III-V compounds). Recently, the mechanism of charge compensation of the Fe3+ centers in hydrothermal ZnO single crystals was investigated [37]. It was proposed that nearest neighbour vacancies act as compensators. We would like to add that in such case the Fe3+ center would also stabilize such vacancy. Using EPR, it is also possible to investigate paramagnetic properties of intrinsic defects in ZnO like zinc [38] or oxygen vacancies [39, 40, 41]. Usually electron irradiation is used for defect formation.
Another element specific analysis technique is Mössbauer spectroscopy. Although spin-split sublevels of the nucleus are investigated, properties of the local electrons like charge state or magnetic ordering can be made. The parameters investigated are the isomer shift, the quadrupole and the magnetic hyperfine splitting at the nucleus. Early investigations on solid solutions of 57Fe, Zn and O mainly revealed oxide spinel secondary phases to be responsible for magnetic sextets observed [42, 43]. There are other methods basing on radioactive probes which definitely have the potential to give more insight into the origin of ferromagnetic properties in TM doped ZnO. One is perturbed angular correlation spectroscopy (PAC) mainly using 111In/111Cd as a probe. Since it is easily incorporated into Zn substitutional lattice sites [44] and does not exhibit local magnetic moments, it can serve as a probe for the spin polarization of the s electrons polarized by ferromagnetically aligned d-electrons.
A method for element specific analysis of the magnetic properties of TM doped ZnO is x-ray magnetic circular dichroism (XMCD) available a synchrotron radiation sources. The technique bases on the dichroic absorption of left- and right circular synchrotron light at a fixed magnetic field or at a fixed helicity while the field direction is reversed. Until now, there are no reports on low-field dichroic signals of TM doped ZnO based DMS which are not doubtlessly related to ferromagnetic inclusions. In contrast, the investigation of paramagnetic Co doped ZnO with perfect Wurtzite structure became very popular in recent years. One report combining high quality level preparation as well as analysis showed purely paramagnetic properties with a magnetization of 4.8 per Co ion. There is evidence for antiferoomagnetic coupling. For TM doped ZnO containing metallic ferromagnetic secondary phases, XMCD is especially valuable because the metallic/ionic character can be distinguished while simultaneously the magnetization can be determined [17].
| Method | Device | Information |
|---|---|---|
| SQUID11footnotemark: 1 | QD MPMS XL 7T |
- Exact determination of moment
- Purely integral method |
| CEMS22footnotemark: 2 |
- Hyperfine parameters at 57Fe nucleus
- Isotope specific - Large information depth in crystal |
|
| XMCD33footnotemark: 3 | Synchrotron |
- Spin-and orbital moment
- Surface and bulk sensitive - All advantages of XAS |
| XAS44footnotemark: 4 | Synchrotron |
- Charge states
- Crystal field splitting - Element specific |
| RBS/C55footnotemark: 5 | Ion beam lab |
- Absolute impurity concentration
- Impurity lattice position - Lattice disorder |
| XRD66footnotemark: 6 | Siemens D5005 |
- Identification of second crystalline phases
- Crystalline lattice quality |
| SR-XRD77footnotemark: 7 | Synchrotron | - Larger sensitivity than lab-XRD |
| HR-XRD88footnotemark: 8 | Siemens D5005 | -HR reciprocal space mapping (RSM) for strain or imperfections determination |
| TEM99footnotemark: 9 | FEI Titan |
- High resolution real space method for second phase or defect characterization
- Non-integral method |
| PAS1010footnotemark: 10 |
- Characterization of open volume defects
- Insensitive to negatively charged defects |
|
| AFM/MFM1111footnotemark: 11 | Veeco/DI Multi-mode |
- Characterization of surface structure
- Simultaneous recording of magnetic force gradients |
superconducting quantum interference
device
22footnotemark: 2 conversion electron Mößbauer spectroscopy
33footnotemark: 3 x-ray magnetic circular dichroism
44footnotemark: 4 x-ray absorption spectroscopy
55footnotemark: 5 Rutherford backscattering/channelling
66footnotemark: 6 x-ray diffraction
77footnotemark: 7 synchrotron radiation x-ray
diffraction
88footnotemark: 8 high resolution x-ray diffraction
99footnotemark: 9 transmission
electron microscopy
1010footnotemark: 10 positron annihilation spectroscopy
1111footnotemark: 11 atomic/magnetic force microscopy
3 Unintended ferromagnetism - role of the substrates
Ferromagnetic hysteresis and irreversibility of the temperature dependence in TM doped ZnO might have other sources than the formation of a ferromagnetic DMS. If the signals are small, one has especially to consider the role of the substrates. Typical substrates for the growth of thin films of ZnO or related materials are typically Al2O3, LaAlO3, YSZ, MgO or ZnO. The commercial sources for single crystalline oxide substrates nowadays are still limited. We mainly used substrates purchased from CRYSTEC, CRYSTAL or MATECK (Germany). Table 2 contains the typical preparation methods for these materials one has to keep in mind while analysing their magnetic properties. Al2O3 is of high hardness and therefore used as abrasive, e.g. in ball mills. At high temperatures alumina acts reducing and therefore is used for the reduction of iron oxide to metallic iron [45]. Therefore, Al2O3 is most sensitive on contamination with metallic Fe during production or handling. Yttria stabilized ZrO2 (YSZ) has comparable properties to Al2O3. It also acts reducing on iron oxide upon annealing at high temperatures [46]. Due to its lower hardness as compared to steel (7-8 Mohs) ZnO is less sensitive to contamination from handling with steel tools.
| Crystal | Growth method | Hardness (Mohs) |
|---|---|---|
| Al2O3 | Edge Defined Film Fed Growth (EFG) | 9 |
| YSZ | Skull melting | 8.7 |
| LaAlO3 | Verneuill Czochralski | 6.5 |
| MgO | Arc fusion | 5.5 |
| ZnO | Hydrothermal | 4.5 |
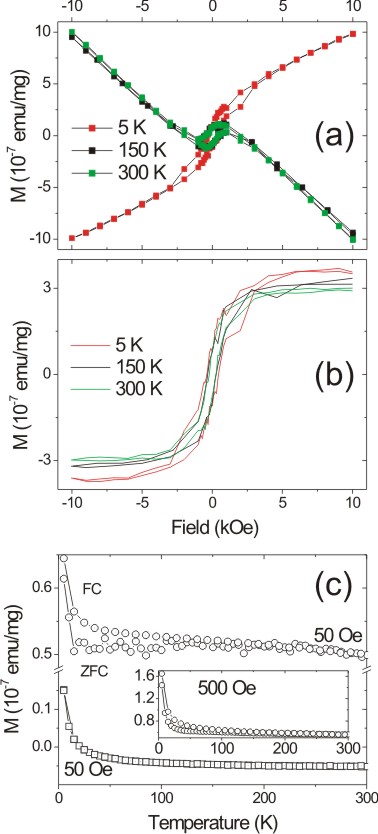
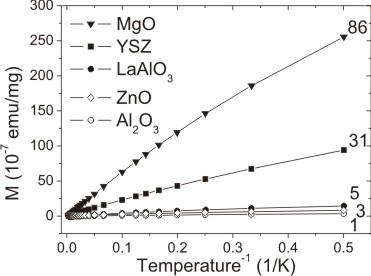
In addition, note that single crystalline oxide substrates do not exhibit the high purity of, e.g. Si, due to the different growth methods. They are contaminated both with spurious elements as well as defects in the crystalline lattice. The latter range from point defects (pm scale) over point defect agglomerates (nm scale) to microscopic defects like grain boundaries. A recent paper on point defects in ZnO single crystals investigated by PAS (Table 1) was recently published by G. Brauer et al. [47]. The authors showed that the kind of defect in virgin materials depends on the preparation method. While pressurized melt grown crystals contain Zn+-O divacancies, hydrothermal crystals exhibit a defect likely based on a Zn vacancy. Confirming paramagnetic contamination, Fig. 1 displays the temperature dependence of the magnetization (M-1/T) of the different substrates at a magnetic field of 10 kOe applied parallel to the sample surface. The paramagnetic contamination is largest for MgO substrates and lowest for Al2O3 substrates. Despite the large contamination with paramagnetic impurities we did not experience any ferromagnetic signal in none of the substrates with one exception. Fig. 2 displays the magnetization vs. magnetic field (M-H) a well as zero-field-cooled/field cooled (ZFC/FC) M-T measurements for a weakly ferromagnetic YSZ(001) virgin sample. A hysteretic behaviour in both the M-H and the ZFC-FC curves can clearly be seen. The saturation magnetization is very low reaching about 3.5 emu/mg. Since the sample mass was 229 mg, this value corresponds to a moment of 8 emu. This value again corresponds to 4 Fe atoms in metallic state, if the magnetization of 2.2 per atom is assumed. The origin of the ferromagnetic signal, however, is by no means clear. Due to the low saturation moment as well as its nearly temperature independence, a contamination with metallic Fe due to abrasion is likely. Such contamination for similar substrates, i.e. due to handling with stainless steel tweezers, has been shown earlier [48]. On the other hand, it should be noted that it is nearly impossible to really detect such a low amount of metallic Fe. Therefore, such assumption would be highly speculative and might lead to false generalization of the origin of weak ferromagnetic signals in oxides. Instead, the creation of weak unconventional ferromagnetism by both spurious TM as well as defects has been stated very recently [18]. Paramagnetic defects in oxides are well know. One of the first observations of unconventional ferromagnetism in oxides was made by J. M. D. Coey et al. on HfO2 [49]. This material is especially interesting because it does not contain any d-electrons. The explanation of the ferrromagnetic properties in HfO2 was given along with the assumption of triplet ground states or low lying excited states due to point defects. Another approach is given by A. Hernando et al. [50]. As a first step, the authors assume broken symmetries such as domain boundaries. These boundaries lead to orbital states that are sometimes of large radii. Intra-orbital ferromagnetic spin correlations induce the alignment of the momenta. All these results are, however, still under strong debate.
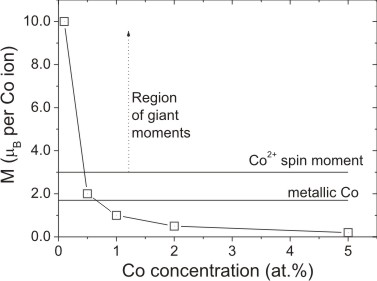
Summarizing, three sources are recently believed to provide a weak unintended ferromagnetic signal in substrates, i.e. contamination with iron due to handling, spurious elements forming magnetic clusters and defects. Along with unintended ferromagnetism, a phrase occurring quite often in literature, i.e. giant magnetic moments (GMM), has to be discussed. Usually GMM denote a larger net moment per TM dopant ion than can be expected from its atomic spin moments. Since the unwanted ferromagnetic signal from the substrates is not directly related to the TM concentration in the films, GMM might seemingly occur. There are, however, only a few experiments where the GMM is assigned directly to the TM dopant, e.g. from element specific spectroscopy [51]. Note that such GMM are also predicted theoretically for very tiny clusters containing transition metals [52]. If integral magnetometry is applied and low concentrations of the dopant are present, a ferromagnetic background from the substrate can easily account for seemingly GMM in ferromagnetic DMS. Thus the magnetization, i.e. the moment per dopant atom, appears to vary along with the dopant concentration, although the TM dopant does not provide any ferromagnetic contribution. Fig. 3 shows such a fiction case ZnO doped with different concentrations of Co. At higher concentrations the magnetization appears to be closer to the value for metallic Co but to reach giant values at lower concentrations. Unintended ferromagnetic signals like for the substrates of course may also lead to ferromagnetic properties of the thin TM doped ZnO film itself. Contamination with Fe from handling, however, is rather unlikely since the face of the film usually is not touched and ZnO itself is rather soft (table 2). The other two unintended sources, i.e. defects without involvement of the d-moments, as well as tiny clusters, involving TM elements will be discussed in section 4 and 5.
4 Role of the defects
4.1 Intrinsic defects in ZnO
Magnetic moments of p-like electrons are by no means surprising. It is well known that molecular oxygen develops paramagnetic moments which even couple antiferromagnetically at low temperatures [53]. Using synchrotron radiation x-ray magnetic circular dichroism, recently -electrons have been discovered to be the source for ferromagnetism in proton irradiated carbon [54]. Since defects appear to be relevant for magnetic properties also in ZnO, we would like to briefly review papers dealing with those defects. One of the most instructive recent theoretical papers on native point defects in ZnO was given by A. Janotti et al. [55]. Here, the authors also give a critical review of experimental results. Thus, we would like to summarize the main results from their paper. The starting points are the six possible point defects in the ZnO Wurtzite lattice, i.e. oxygen or zinc vacancy, oxygen or zinc interstitial and oxygen or zinc antisite. Although only six, the variety of defects is likely much larger due to different possible charge states or pair as well as complex formation. The authors made clear that two of them which are often considered as candidates not only for n-type conductivity but for mediation of ferromagnetic coupling, are unlikely to be present in ZnO under equilibrium conditions. These defects are the O vacancy (VO) and the Zn interstitial (Zni). Both VO and Zni exhibit high formation energies in n-type ZnO, even in extreme Zn-rich conditions, therefore, they are unlikely to be formed. Moreover, VO is a deep rather than a shallow donor with the (2+/0) transition level at 1 eV below the bottom of the conduction band; therefore it cannot be responsible for the often observed n-type conductivity in ZnO. Note that oxygen vacancy in ZnO has been recently identified by Vlasenko and Watkins [41] using optical detected electron paramagnetic resonance (ODEPR). They emphasized that the VO related EPR signals could be observed only after electron irradiation. This is consistent with the fact that VO is not present in ZnO under equilibrium, i.e., it has high formation energy in n-type ZnO as predicted by Janotti et al. [55]. Zinc interstitial (Zni) is a shallow donor in ZnO. However, it exhibits a very low migration barrier, thus, Zni is mobile even below room temperature. Hence, isolated Zni is unstable and it is unlikely to be present in detectable concentrations in n-type ZnO. The zinc vacancy (VZn) has the lowest formation energy in n-type ZnO among all intrinsic (native) point defects. VZn is a deep acceptor and acts as a compensating center in n-type ZnO. Interestingly, Janotti et al. [55] proposed VZn as one of the causes of the often-observed green luminescence in ZnO. The oxygen interstitial (Oi) also has a high energy. It is stable as electrically inactive split interstitial Oi0 (split) in p-type ZnO, or as a deep acceptor at the octahedral site Oi1-(oct) in n-type ZnO. Zn antisite (ZnO) is a shallow donor, but it is unlikely to form in n-type ZnO due to its exceedingly large energy of formation. Oxygen antisite (OZn) has even higher formation energies and are also unlikely be present in ZnO under equilibrium conditions. The authors also provided temperatures, at which the defects are expected to become mobile. The annealing temperatures are given in table 3. The relevant point defects are predicted to anneal anneal out at low or modest temperatures.
| Defect | Tanneal (K) |
|---|---|
| Zni2+ | 219 |
| VZn2- | 539 |
| VO2+ | 655 |
| VO0 | 909 |
| Oi0 (split) | 335 |
| Oi2-(oct) | 439 |
.
Summarizing the paper we find that point defects are unlikely to be associated to the often-observed n-type conductivity in ZnO. Nevertheless, VO and Zni can act as compensating centers in p-type ZnO. The lowest energy defect in n-type ZnO is the zinc vacancy which acts as deep acceptor, partially compensating the n-type conductivity. On the other hand, point defects are formed under non-equilibrium conditions. They become mobile and thus might disappear at moderate temperatures or even room temperature.
An experimental study corresponding to those findings has been performed by D. Sanyal et al. [57]. The group was ball-milling ZnO powder and subsequently annealing it in air up to 873 K. Applying positron annihilation spectroscopy (PAS), they found mainly Zn vacancies inside the as-milled powders. These vacancies disappear upon annealing at 873 K while O-vacancies start to appear at such high temperatures. Unlike metallic clusters, defects very often appear, grow and disappear again due to continuation or intensivation of certain treatment. Such observation has been made by N. G. Kakazey et al. [58] while grinding ZnO powder. Using EPR he identified different paramagnetic defects dominated by Zn vacancy and O vacancy formation. Note that due to the grinding process the signals of the defects initially increase but decrease after a certain grinding time. Finally we would like to focus shortly on the creation of microscopic defects due to heavy destructive treatment of the ZnO lattice. These defects are a result of agglomeration of point defects and can lead to low dimensional structures within ZnO. A very instructive example is given by the bombardment of single crystalline ZnO with heavy ions [59]. After bombardment of ZnO single crystals with Au ions at an energy of 300 keV and up to a fluence of 4 cm-2 the authors found
-
•
Oxygen loss close to the surface
-
•
point defect clusters and planar defects parallel to the basal plane of the ZnO wurtzite structure
-
•
Precipitate formation, likely Zn enriched regions
-
•
No full amorphisation of the ZnO substrate reflecting dynamic annealing
4.2 Defects induced ferromagnetism
.
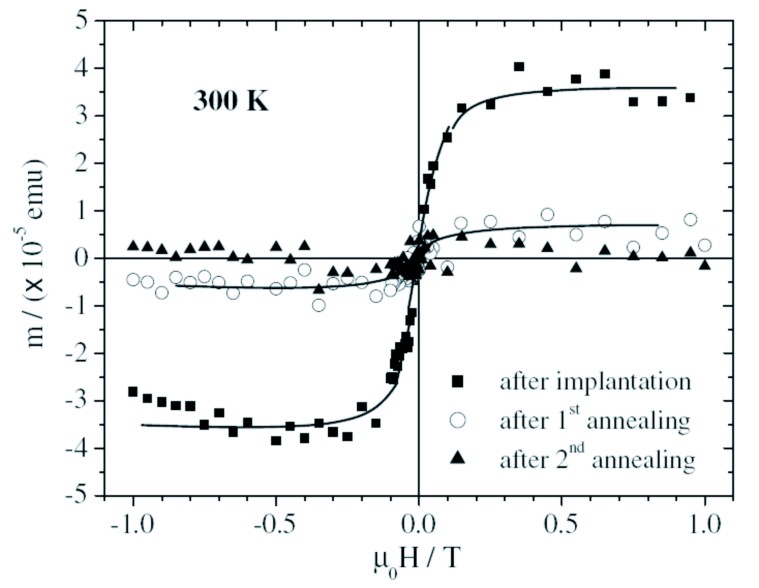
The creation of ferromagnetic signals in pure, but defective ZnO has been investigated recently by several groups, e.g., in laser ablated ZnO thin films [61]. In the paper of Borges et al. [56], ferromagnetic properties have been introduced in ZnO by means of Ar ion implantation. Although spurious elements could be detected inside the crystals, the authors could assign the ferromagnetic properties to defects induced by the implantation. As in our papers published slightly later (see below), the authors used reciprocal space mapping in order to detect crystal lattice disorder. After implantation, the crystals showed broadening of the (0004) diffraction peak indicating enhanced strain or grain boundaries. Although being a prerequisite for ferromagnetism, these microstructural defects are not fully responsible for it since it disappears after annealing at 773 K for a few hours (Fig. 4).
Thus, the presence of a point defect appears to be the real source of the observed ferromagnetism. The poisoning effect of ferromagnetic signals originating from defects, however, is largest if the ZnO is intentionally doped by TM ions in order to create ferromagnetic DMS. A superb article on the field was recently published by M. Gacic et al. [62] where Co doped ZnO thin films were created by means of pulsed laser deposition at a typical temperature of 873 K. The films exhibited ferromagnetic properties at room temperature. Demonstrating the large value of element specific electronic spectroscopy, the authors proved, that the properties do not arise from the element Co. Also no metallic Co clusters have been detected. In fact the Co ions were paramagnetic. Thus, they associated the ferromagnetic signal to defects. Consequently, also no indirect ferromagnetic coupling between the Co ions is established by those defects. A very similar experiment was performed by Xu et al. [63]. In this paper, Cu doped ZnO thin films have been grown by PLD under nitrogen atmosphere. It was clearly proven, that defects, rather than the Cu spins lead to ferromagnetic properties. The origin of the ferromagnetism was assigned to Zn vacancies rather than O vacancies. For our own investigation investigation [60] we
-
•
Lowered the crystalline quality of the substrates intentionally by means of pre annealing them Zn face up in high vacuum at a temperature of 1073 K for 30 min. The temperature ramp was 60 K per minute for heating up and 2 K per minute for cooling down.
-
•
Investigated the formation of the delicate defect responsible for the ferromagnetic properties by either implantation with Fe ions at different fluences or/and post-annealing in vacuum at different temperatures.
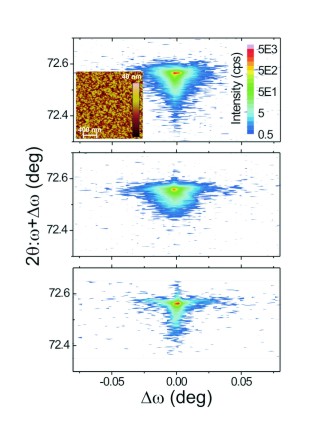
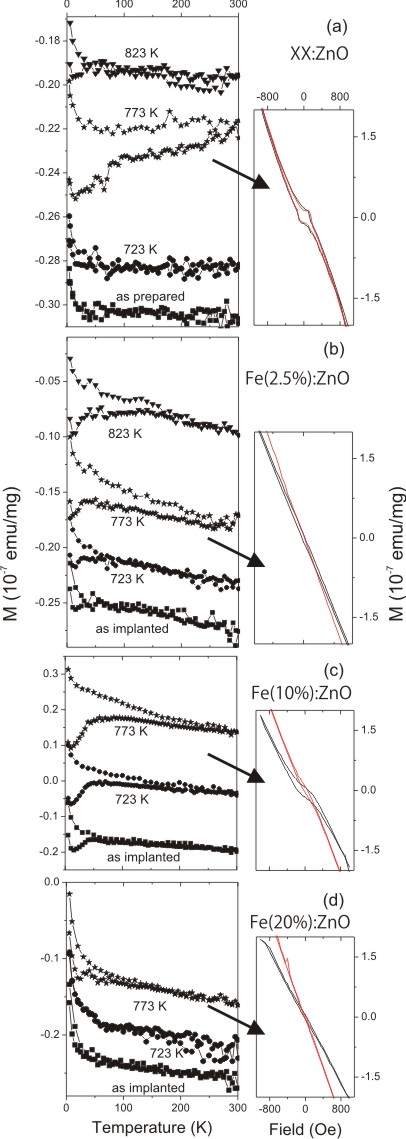
For the creation of the relevant defect we applied Fe+ ion implantation at a temperature of 253 K, an energy of 80 keV and fluences of 0, 1, 4, and 8 cm-2. Corresponding to the maximum atomic concentration in the implanted profile, we named the samples XX:ZnO, Fe(2.5%):ZnO, Fe(10%):ZnO, and Fe(20%):ZnO. The profiles were calculated using the TRIM program [64]. The introduction of microscopic defects is rather easy to be analyzed. Fig. 5 shows the RSM of a pre-annealed crystal after implantation plus post-annealing and the AFM picture of its surface. The surface roughness increased from 0.25 nm to 5 nm. RSM also reveals an increase of strain/grain boundaries after such treatment [60]. The profiles were calculated using the TRIM program [64]. Fig. 6 instructively shows the behaviour of the ferromagnetic properties and thus the defect due to implantation: The splitting of the ZFC/FC curves recorded at 100 Oe initially increases with increasing fluence but drops again at the largest fluence. Moreover, we discovered that mild post-annealing in vacuum of all of the samples leads to a similar effect like the implantation. Exemplarily for XX:ZnO and Fe(2.5%):ZnO [Fig. 6 (a, b)] we observe an initial increase with post-annealing temperature and finally a drop at higher temperatures. This behavior fits the phenomenology of defect induced ferromagnetism. Note that the drop of the thermomagnetic irreversibility temperature Tirr, i.e. the bifurcation temperature of ZFC and FC curves, is more drastic for XX:ZnO. Moreover, we experienced a degradation of the ferromagnetic properties for XX:ZnO after exposing it for a few days at ambient conditions [60].
In conclusion, defects can lead to unintended weak ferromagnetism in oxides, i.e. in substrates, or deposited TM:ZnO films. The ferromagnetic signals are not related to ordering of the TM 3d moments. The major unintended ferromagnetic signals are, however, secondary inclusions. We will mainly discuss our work in the following section.
5 Role of secondary phases
5.1 Introduction
The appearance of ferromagnetic secondary phases in TM doped ZnO, a candidate for future spintronics devices, has been investigated for the last 10 years. The reason is that such clusters can lead to unwanted ferromagnetic signals that can be confused with a ”real” ferromagnetic DMS. On the other hand, the clusters can influence necessary magneto-transport properties due to the introduction of large amounts of metal-semiconductor interfaces. One of the first papers on the characterization of metallic clusters created from a popular TM dopant, Co, in ZnO was given by Pearton et al [65]. After implantation of 3-5 at.% Co at a temperature of 623 K he found crystallographically oriented hcp Co clusters to be present in the ZnO single crystals. These clusters, although tiny, lead to room temperature ferromagnetic properties of the whole sample. While these clusters are rather ”easy” to detect by means of x-ray diffraction, other clusters require high resolution structural analysis (see below). Especially clusters consisting only of a few atoms are nearly impossible to be detected but might lead to pronounced magnetic properties. Although we will not deal with such clusters here, it is worth to mention two papers on the topic. The first, theoretical article considers small (MnO)x clusters with x9 [66]. These clusters show exciting stability dictated by their underlying magnetic configuration. The authors found atomiclike magnetic moments ranging from 4 to 5 per MnO unit. Despite the antiferromagnetism in bulk MnO, (MnO)x clusters with x=1-7, 9 show ferromagnetic coupling with a localization of the moments at the Mn site. The same group [52] pointed out the relevance of N doped Mn clusters to the ferromagnetic signal of Mn doped GaN. These clusters are expected to exhibit moments of almost 5 per Mn. For TM doped ZnO indeed small oxide inclusions have been found, namely planar CuO nanophases of sizes ranging from 1 to 10 nm [67]. The authors prepared ZnO thin films doped with 1 at.% Cu exhibiting ferromagnetic properties by means of radio-frequency sputtering. They related the ferromagnetic signal to the presence of the embedded planar CuO nanophases. An element specific prove of the relevance of the Cu 3d9 moment was not given. Nevertheless, the observed ferromagnetism was assigned to uncompensated Cu 3d spins of the surface Cu ions.
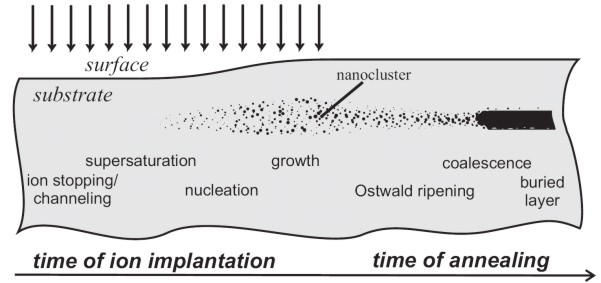
Turning back to less exotic clusters we would like to review the principles of the formation of secondary phases from a supersaturated solid solution. It is usually created by application of non-equilibrium preparation techniques like ion implantation or low temperature thin film growth. Fig. 7 shows a scheme of the formation of nanoclusters for a supersaturated solid solution after high-fluence ion implantation and subsequent annealing [68]. Supposing high enough mobility of the monomers and low enough energy of the formation of a secondary phase, its nucleation can already happen during implantation. Further implanting or post-implantation annealing leads to the precipitation of clusters. The size evolution of the clusters is described by Ostwald-ripening and coalescence. For a very high ion implantation fluence, coalescence of nano-clusters occurs, resulting in the formation of buried layers (Fig. 7).
Note that the phenomenon of spinodal decomposition has been discussed recently [11]. Spinodal decomposition describes density fluctuations of the dopant driven by attractive chemical pair interactions, e.g. of the dispersed Mn ions in GaMnAs or GaMnN. These can lead to nanoscale regions of ferromagnetic DMS due to enhancement of TM concentration. Spinodal decomposition only occurs in a parameter window, where the mobility of the dopant monomers is low and the energy of the formation of a second phase cannot be reached, e.g. long-time exposure of the sample to room temperature. The fluctuations in composition are relatively small and thus different from nucleation which usually is accompanied by large fluctuations of composition.
Actually, magnetic nanoclusters have been intentionally formed in GaAs by ion beam synthesis [69, 70]. While these clusters are ”wanted”, TM doped ZnO might show ”unwanted” magnetic second phases [71]. In the following, we will discuss the secondary phase formation in Fe, Co and Ni implanted ZnO, and compare their differences in crystalline structures and in annealing behaviors.
Before performing sample characterization, we first introduce the magnetic behavior of a nanoparticle system. Such that we have some clues to choose the analysis method.
For magnetic nanoparticles, a critical size may be reached, below which the formation of magnetic domains becomes energetically unfavorable. The critical diameter is given by
| (1) |
where is the exchange constant, the effective anisotropy energy density, and the saturation magnetization [72]. The critical diameter is 15 nm for Fe and 35 nm for Co [72].
The magnetism of a single nanoparticle in a solid matrix follows the Néel process [73]. If the particle size is sufficiently small, above a particular temperature (so-called blocking temperature of TB) thermal fluctuations dominate and the particle can spontaneously switch its magnetization from one easy axis to another. Such a system of superparamagnetic particles does not show hysteresis in the M-H curves above TB; therefore the coercivity (HC) and the remanence (MR) are zero. Below the blocking temperature, the particle magnetic moment is blocked and its magnetization depends on its magnetic history. Phenomenologically there are two characteristic features in the temperature dependent magnetization of a nanoparticle system. One is the irreversibility of the magnetization under a small applied field (e.g. 50 Oe) after zero field cooling and field cooling (ZFC/FC) [73]. The other is the drastic drop of the coercivity and the remanence at a temperature close to or above TB [74][75].
Obviously one question is whether one can judge the origin of ferromagnetic properties from the temperature dependence of ZFC/FC magnetization. At least, a system of DMS nanoparticles, e.g. nanostructured Mn-doped InP [77], behaves exactly the same as normal magnetic nanoparticles. Moreover, Roshko et al. used the Preisach model in order to calculate the ZFC/FC magnetization for a conventional ferromagnet [78]. The thermal fluctuation energy in a ferromagnet is very small so that blocking and activation only occur very close to Curie temperature (TC). They found that ZFC/FC curves have similar shape as that of a superparamagnetic nanoparticle system, but with a maximum in ZFC curve just below TC. Additionally some frustrated systems, e.g. a spin glass, also show slow dynamical behavior, which results in the irreversibility of the magnetization after zero field cooling and field cooling [79]. Therefore, it is impossible to unambiguously judge the magnetic origin, i.e. secondary phase, spinodal-decomposition, nano-DMS, and spin-glass, by ZFC/FC magnetization measurement alone. For this purpose one has to correlate the structural and magnetic properties. Since the majority of the groups are using XRD for structural characterization, we will focus on that technique discussing our results in more detail. We used both synchrotron radiation (SR) XRD and conventional XRD.
Structural analysis was achieved both by synchrotron radiation x-ray diffraction (SR-XRD) and conventional XRD. SR-XRD was performed at the Rossendorf beamline (BM20) at the ESRF with an x-ray wavelength of 0.154 nm. Conventional XRD was performed with a Siemens D5005 equipped with a Cu-target source. In XRD measurement, we use 2- scans to identify crystalline precipitates, and pole figures (azimuthal -scan) for determining their crystallographical orientation.
5.2 Metallic secondary phases (Fe, Co, Ni)
5.2.1 Fe implanted ZnO
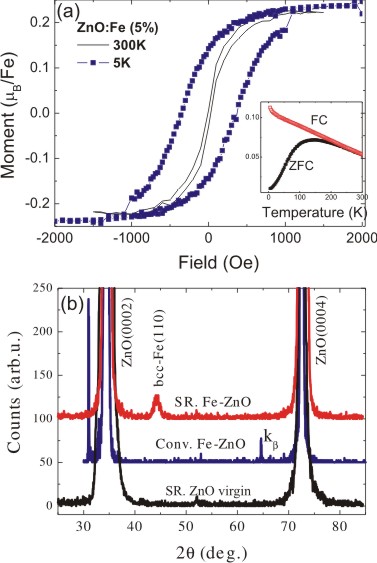
We pick out the ZnO single crystals implanted with Fe as an example to show the possible misinterpretation of the observed ferromagnetism in transition metal implanted ZnO. Fig. 8(a) shows the magnetization measurement on the sample implanted with Fe, with the field along the sample surface. The implantation temperature is 623 K and the Fe fluence is 41016 cm-2. This fluence corresponds to 5% maximum atomic concentration of the Gauss-like shaped Co+ implantation profile [64]. Note that for ion implantation the concentration usually is given with respect to the total atomic density and not as x from Zn1-xTMxO. At both 5 K and 300 K, the sample shows ferromagnetism. However with increasing temperature, its coercivity and remanence are decreased drastically: from 360 Oe at 5 K to 10 Oe at 300 K, and 0.14 /Fe to 0.01 /Fe, and this is a strong indication of superparamagnetism, which has been confirmed by the measurement of ZFC/FC magnetization. The inset of Fig. 8(a) shows ZFC/FC curves with an applied field of 50 Oe. A distinct difference in ZFC/FC curves was observed. ZFC curves show a gradual increase (deblocking) at low temperatures, and reach a broad peak with a maximum, while FC curves continue to increase with decreasing temperature. The broad peak in the ZFC curves is due to the size distribution of Fe NCs.
Of course in order to confirm the existence of nanoscale metallic Fe precipitates one needs structural support. Fig. 8(b) shows symmetric 2/ scans for the sample performed at conventional XRD and SR-XRD. Obviously no secondary phases could be detected by conventional XRD, where the sharp peaks, at 234.4∘ and 272.6∘, are from bulk ZnO. In contrast to conventional XRD, the much higher x-ray intensity in SR-XRD allows one to detect also small amounts of very tiny nanoparticles. At 244.5∘, a rather broad and low intensity peak originating from alpha-Fe(110) with a theoretical Bragg angle of 2=44.66∘ occurs. The nanoparticle size is estimated to be around 8 nm using the Scherrer formula [80]. Apart from alpha-Fe, no other Fe-oxide (Fe2O3, Fe3O4, and ZnFe2O4) particles are detected. By combining the magnetic and structural measurements, it is reasonable to conclude that metallic -Fe nanoparticles have formed upon implantation at 623 K with the fluence of 41016 cm-2, and they are responsible for the ferromagnetism. The saturation moment at 5 K is around 0.24 /Fe. By comparing with the bulk Fe with a saturation magnetization of around 2.2 /Fe, around 11% of Fe in this sample is in metallic state. This is further confirmed by CEMS measurement.
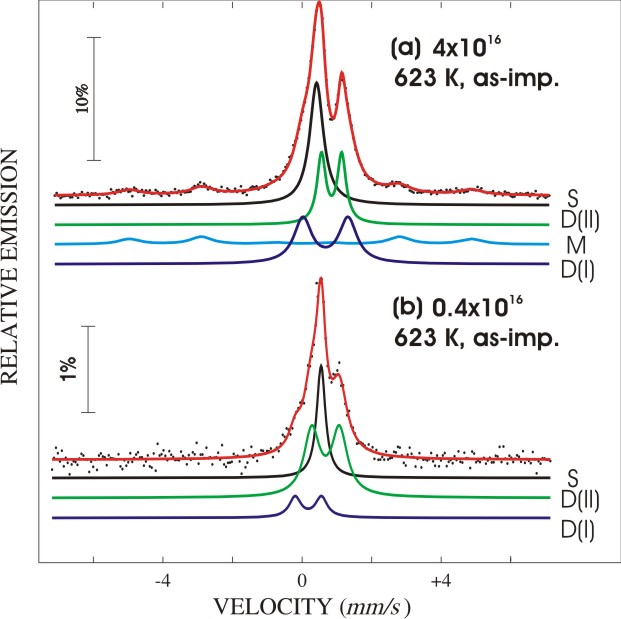
Fig. 9(a) show CEMS spectrum for Fe implanted ZnO at 623 K with a fluence of 41016 cm-2. The majority of Fe are ionic states Fe3+ (singlet S) and Fe2+ (doublet D(I) and D(II)), while a considerable fraction of a sextet associated to -Fe is present (sextet M). The amount of metallic Fe obtained from CEMS simulation is 12.5%. It is in quite good agreement with the results by magnetization measurement. On the other hand, these Fe2+ and Fe3+ ions could be dispersed inside ZnO matrix.
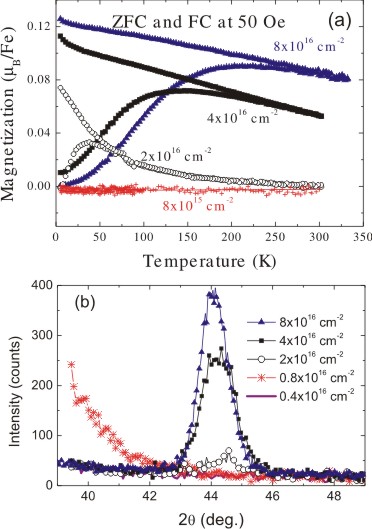
Now we would like to find out, if lowering of the fluence results in the avoidance of metallic secondary phases. Fig. 10(a) shows the ZFC/FC magnetization curves in a 50 Oe field for different fluences of Fe implanted ZnO. The FC curves for low fluences of 11015 (not shown to avoid overlap) and 81015 cm-2 completely overlap with the corresponding ZFC curves at zero level. No superparamagnetic particles are present in the two samples. For larger fluences (above 21016 cm-2), the irreversibility in ZFC/FC curves was observed.
Correspondingly SR-XRD reveals the same trend for metallic Fe formation. Fig. 10(b) shows the SR-XRD pattern (focused on Fe(110) peak) as a function of fluence. At a low fluence (11015 to 81015 cm-2), no crystalline Fe NCs could be detected, while above a fluence of 21016 cm-2), an Fe(110) peak appears and increases with fluence. The inset shows a wide range scan for the high fluence sample (41016 cm-2). The full width at half maximum (FWHM) of the Fe(110) peak decreases with fluence, indicating a growth of the average diameter of these NCs, according to the Scherrer formula [80]. Note, that not only the presence of tiny metallic TM clusters is relevant for magnetic properties but also the crystallographic orientation with respect to the host matrix. However, no texture behavior is found even for the highest fluence sample in pole figure measurements on Fe(110) and Fe(200) (not shown). This could be due to the difference in the crystalline symmetry of hexagonal ZnO (six fold symmetry) and bcc-Fe (four fold symmetry). For a bcc-crystal, one cannot find a six-fold symmetry viewed from any direction. In contrast, hcp-Co(0001) and fcc-Ni(111) NCs, which are six-fold symmetric, are found to be crystallographically oriented inside ZnO matrix. This will be shown in the next section.
As a cross-check to confirm no metallic Fe in the samples with low Fe fluence, Fig. 9(b) shows the CEMS spectrum of Fe implanted ZnO at 623 K with a fluence of 0.41016. The singlet S and doublet D(I) are attributed to Fe3+, while the doublet D(II) is from Fe2+. No Fe0 state could be detected.
With post-implantation annealing, one expects that the metallic Fe nanoparticles grow driven by Ostwald ripening. According to magnetization measurement, we found that the annealing at 823 K results in the growth of -Fe nanoparticles. During annealing at 1073 K the majority of the metallic Fe is oxidized; after a long term annealing at 1073 K, crystallographically oriented ZnFe2O4 NCs form, which will be discussed in the section 5.3.
5.2.2 Co and Ni implanted ZnO
In this section, the formation of Co and Ni nanocrystals inside ZnO upon implantation will be discussed. Co or Ni ions were implanted into ZnO at 623 K with the fluence from cm-2 to cm-2. The maximum atomic concentration thus ranges from 1% to 10%. Already in the as-implanted samples, Co or Ni NCs have formed, and they exhibit superparamagnetic properties.
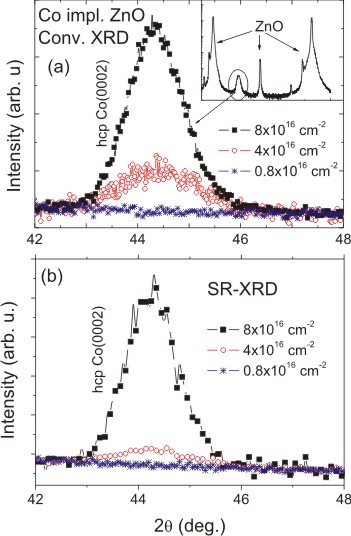
Both conventional and synchrotron XRD techniques were employed to check the formation of secondary phases in Co or Ni implanted ZnO. Obviously conventional XRD already can detect the formation of metallic Co nanocrystals as shown in Fig. 11(a). At a low fluence (0.81016 cm-2), no crystalline Co nanocrystals could be detected. At large fluences starting from 41016 cm-2 the hcp-Co(0002) peak appears (Using approaches presented in Ref. [81] we are able to identify the Co phase to be hcp and not fcc). SR-XRD reveals the same fluence dependence of Co nanocrystals [Fig. 11(b)]. XRD reveals similar results for Ni implanted ZnO (not shown), i.e. Ni NCs start to form at the Ni fluence of 41016 cm-2.
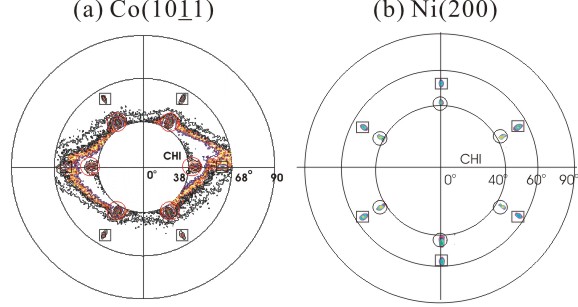
Fig. 12 (a) and (b) show the pole figure of hcp-Co(101) and fcc-Ni(200), respectively. The radial coordinate is the angle () by which the surface is tilted out of the diffraction plane. The azimuthal coordinate () is the angle of rotation about the surface normal. The pole figure shows poles of hcp-Co(101) at 61.9∘, and Ni(200) at 54.8∘, respectively. Both exhibit a sixfold symmetry. Since ZnO(102) and hcp-Co(101) have similar Bragg angle, the poles of ZnO(102) also show up at 42.8∘ with much more intensities. The results are consistent with the theoretical Co(101) pole figure viewed along [0001], and Ni(200) pole figure viewed along [111] direction, respectively. Therefore, we can conclude that these Co and Ni NCs are crystallographically oriented with respect to the ZnO matrix. The in-plane orientation relationship is hcp-Co[100]ZnO[100], and Ni[112]ZnO[100], respectively. Due to the hexagonal structure of Co and sixfold symmetry of Ni viewed along [111] direction, it is not difficult to understand their crystallographical orientation onto hexagonal-ZnO.
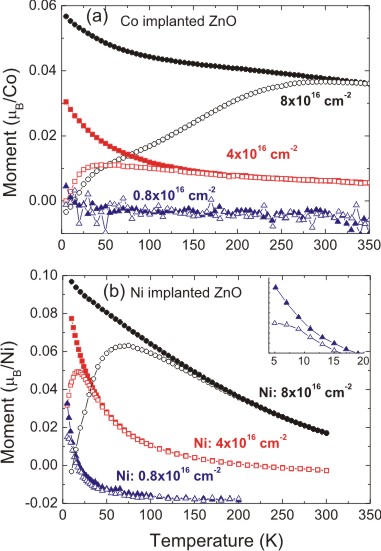
Correspondingly, magnetization measurements reveal similar fluence dependence of the formation of metallic Co or Ni nanocrystals. Fig. 13(a) shows the temperature dependent magnetization curves after ZFC/FC with H Oe. Knowing the formation of hcp-Co from XRD, it is reasonable to assume that hcp-Co NCs are responsible for the magnetic behavior. For bulk hcp-Co crystals, the magnetic moment is 1.7 /Co at 0 K. Assuming the same value for Co NCs and using the saturation magnetization measured at 5 K, around 17% and 26% of implanted Co ions are in the metallic state for the fluence of 4 and 81016 cm-2, respectively. Similar results are observed for Ni implanted ZnO. Fig. 13(b) shows the ZFC/FC magnetization curves for Ni implanted ZnO with different fluences. Comparing with Co, Ni has a much lower anisotropy energy density. For similar sizes of Ni NCs, the blocking temperature is therefore much lower than that of Co.
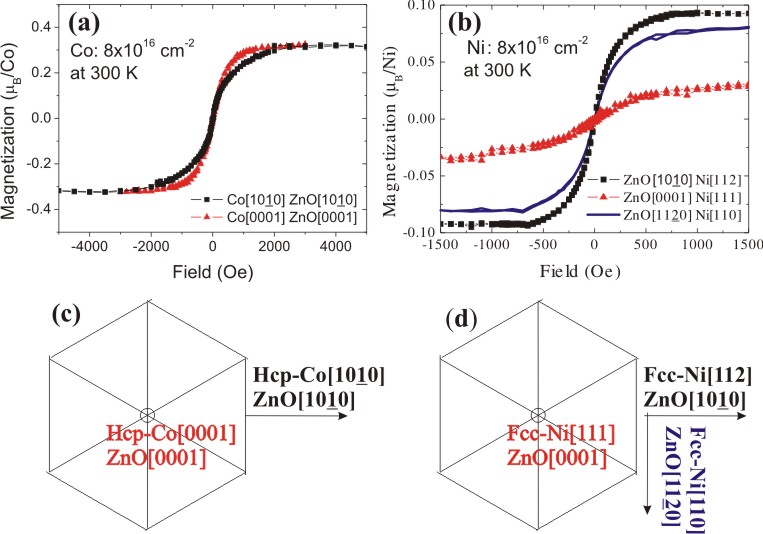
Aiming at special features of magnetic anisotropy, Fig. 14(a) shows the comparison of the magnetization along ZnO[100] and [0001] at 300 K for Co and Ni, respectively. Fig. 14(c) shows the orientation relationship between hcp-Co and ZnO, and the measurement geometry. Obviously Co[0001] is the easy axis, the same as a bulk hcp-Co crystal. The intersection of both curves gives an effective anisotropy field of 3000 Oe. Fig. 14(b) shows the same measurement of Ni implanted ZnO, while (d) shows the orientation relationship between fcc-Ni and ZnO, and the measurement geometry. In contrast to bulk Ni where [111] is the easy axis, here the easy axis is Ni[112] and the hard axis is Ni[111]. Moreover, as shown in Fig. 14(b), another in-plane direction Ni[110] is also an easy axis. Within the applied field, the magnetization curve along the hard axis does not intersect with that along the easy axis. The effective anisotropy field is much larger than 1500 Oe. That means that there are other contributions to the anisotropy dominating over the crystalline magnetic anisotropy. By XRD measurement (Fig. 15), we can evaluate the lattice constant of Co or Ni nanocrystals. Actually we find both of them are tensilely strained in the perpendicular direction. This lattice strain results in the magnetoelastic energy, which could over-dominated the magnetocrystalline anisotropy energy. Comparing with hcp-Co, Ni has a much smaller (two orders of magnitude) magnetocrystalline anisotropy constant. Therefore the magnetoelastic anisotropy energy dominates the total anisotropy energy, resulting in the in-plane anisotropy. On the other hand, the hcp-Co NCs in the as-implanted sample still keep the bulk like anisotropy behavior.
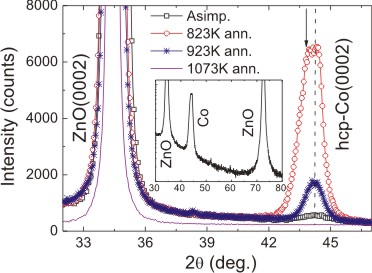
In order to further investigate the Co implanted ZnO, post-annealing was also performed in high vacuum at temperatures ranging from 823 K to 1073 K for 15 min for the sample with Co fluence of 41016 cm-2. Fig. 15 shows the development of Co NCs upon thermal annealing. The peak area and crystallite size calculated using the Scherrer formula [80] are compared in table I. A broad scan (the inset of Figure 15) reveals only one peak from Co besides the ZnO peaks. Using an XRD -scan (see Ref. [81]), we find only hcp-Co in the as-implanted sample and the sample annealed at 923 K, while both fcc- and hcp-Co are present in the sample annealed at 823 K. Note that the peak area of Co in Figure 15, which is an approximate measure of the amount of Co NCs, increases drastically after 823 K annealing, while decreases after 923 K annealing. It is reasonable to attribute this change to the formation and disappearance of fcc-Co. The fcc-Co is probably oxidized to the amorphous CoO after 923 K annealing, while finally all Co NCs are oxidized to an amorphous state after annealing at 1073 K.
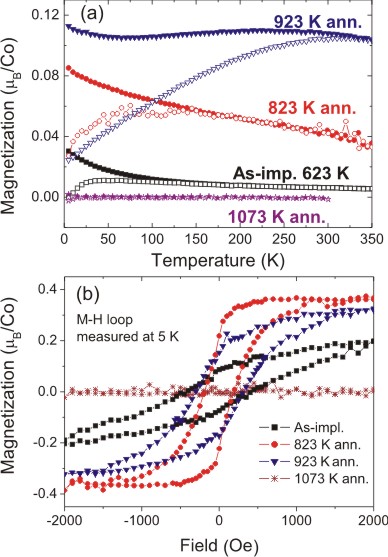
The structural phase transformation of Co NCs results in corresponding magnetic properties as revealed by SQUID. Fig. 16(a) and (b) show the ZFC/FC magnetization curves and magnetization loops, respectively, for all samples annealed at different temperatures. No significant magnetization response is detected for the sample annealed at 1073 K. The saturation magnetization is increased after annealing at 823 K, while decreased again after annealing at 923 K. This reflects the formation and oxidation of fcc-Co as found by XRD (see Fig. 15).
Similar annealing results were found for Ni implanted sample (not shown). The mild temperature annealing (823 K) only slightly increases the grain size of Ni. The annealing at 923 K drastically decreases the peak area, while the grain size also decreases. The Ni NCs were completely oxidized to amorphous state after 1073 K annealing, and thus are non-detectably by XRD.
5.3 Oxide secondary phases
Oxide precipitates of TM are usually expected upon preparation at large oxygen partial pressure. Consequently, a ferromagnetic, metastable, oxygen-vacancy-stabilized Mn2-xZnxO3-δ phase have been identified in Mn doped ZnO created by solid state reaction [82]. Possible simple secondary oxide phases of transition metals occurring in TM doped ZnO are mentioned in Ref. [71]. As a bulk material, some of them are antiferromagnetic, like MnO, NiO, and CoO. Others are ferromagnetic or ferrimagnetic, like CrO2, Fe3O4, and -Fe2O3. Later on Zhou et al. using Raman spectroscopy found the existence of antiferromagnetic cobalt oxides like CoO and Co3O4 already in intermediately doped ZnO [83]. Nayak et al. applied first-principles calculation and Monte Carlo simulation of a classical Heisenberg model for Co doped ZnO and found the formation of cobalt oxide system for larger Co concentrations [84]. Taking into account nanoscale precipitates, the situation becomes more complicated. E.g. non-compensated spins at the surfaces of antiferromagnetic clusters might provide substantial ferromagnetic signal [85].
Another source for ferromagnetic signals are inverted spinels involving both Zn and O elements. For example, ferrimagnetic spinel (Zn,Mn)Mn2O4 has been found in Mn doped ZnO [86]. The sample has a very large coercivity of 5500 Oe at 5.5 K and a Curie temperature of 43 K. Exchange bias is clearly observed below 22 K, which is attributed to the exchange interaction between ferrimagnetic (Zn,Mn)Mn2O4 and spin-glass-like (or antiferromagnetic) phase in manganese oxides. Another example is ZnCo2O4. By Raman spectroscopy ZnCo2O4 was identified in Co doped both ZnO nanostructures [87] and thin films [88]. None of the two papers attributed the observed ferromagnetism to spinel ZnCo2O4, which, however, does show ferromagnetic behavior [89]. Concerning our own investigation, we show the synthesis of Zn-ferrites by Fe implantation into ZnO and post-annealing. By this we would like to point out that oxides NC can account for a ferromagnetic signal, although a bulk material can be antiferromagnetic.
5.3.1 ZnFe2O4 nanocrystals
Figure 17(a) shows the SR-XRD patterns for the as-implanted and annealed samples. After annealing at 823 K for 15 min, larger and more Fe nanoparticles are formed as compared to the as-implanted state. This is reflected by an increase and the sharpening of the corresponding peak at 44.4∘ in the 2- scan. After annealing at 1073 K for 15 min, the Fe(110) peak almost disappeared and the sample already shows an indication for the presence of ZnFe2O4. After 3.5 hours annealing at 1073 K, crystalline and oriented ZnFe2O4 particles are clearly identified.
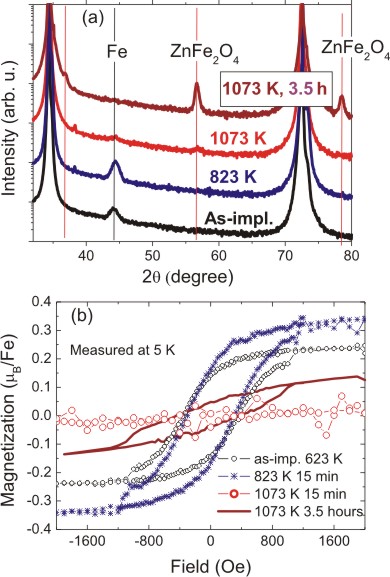
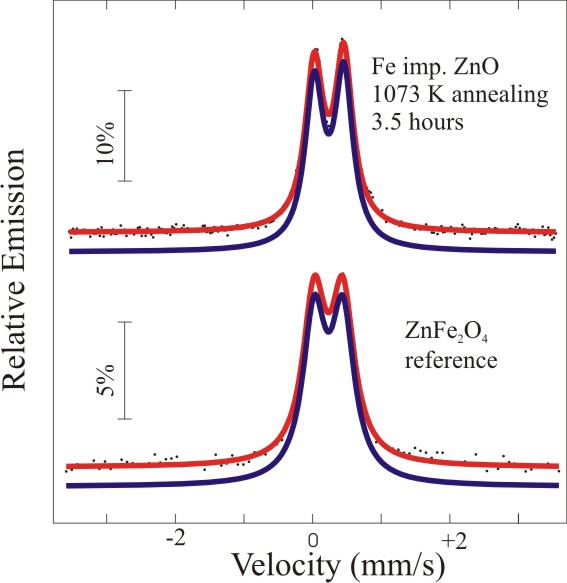
The formation of Zn-ferrites is further confirmed by CEMS (Figure 18). After 3.5 hours annealing, the CEMS pattern exhibits only one quadrupole split line typical for ZnFe2O4 at room temperature [91, 92].
Figure 17(b) shows the magnetization versus field reversal (M-H) at 5 K. Magnetic hysteretic loops are observed for the as-implanted sample, which contains -Fe nanoparticles. After annealing at 823 K for 15 min, the ferromagnetism is enhanced, i.e. Fe nanoparticles are growing in size and amount. However, after annealing at 1073 K for 15 min, no hysteresis loop is observed. Probably the majority of Fe particles were oxidized to some amorphous nonmagnetic compound, as in the case for Ni and Co, also at 1073 K annealing. The magnetism evolution is in a good agreement with the XRD measurement. After annealing at 1073 K for 3.5 hours, the hysteretic behavior is observed again, which - according to the SR-XRD - cannot come from Fe nanoparticles. It results from partially inverted ZnFe2O4, which is ferrimagnetic [91, 92, 93], in contrast to bulk ZnFe2O4. The explanation for such behavior is additional occupation of tetrahedral A sites by Fe and octahedral B sites by Zn (as shown in Eq. 2 and 3). The intra-site interaction of the magnetic moment of the cations on the B sites is much weaker than the A B inter-site one. The Fe3+ ions between A and B sites couple antiferromagnetically, which leaves some net spins from the non A-B paired Fe3+ ions.
Normal spinel:
| (2) |
Inverted spinel:
| (3) |
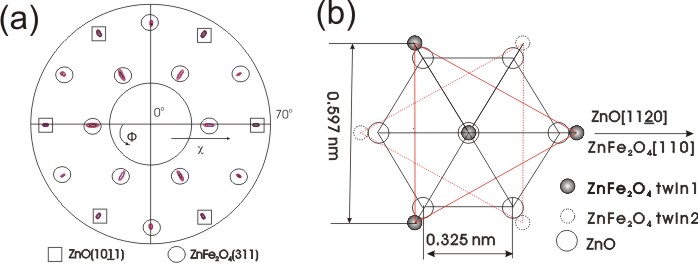
In Fig. 17(a), the XRD pattern for the sample after 3.5 hours annealing at 1073 K shows only three peaks of ZnFe2O4(222) (333) and (444), which means that the crystallites of ZnFe2O4 are not randomly, but highly oriented. The surface orientation is ZnFe2O4(111)ZnO(0001). The crystallographical orientation of ZnFe2O4 was revealed by the XRD pole figure. Fig. 19(a) shows the pole figure for ZnFe2O4(311). Poles of ZnFe2O4(311) at 29.5∘and 58.5∘, respectively, with sixfold symmetry, are visible. Since ZnO(1011) (2=36.25∘) has a close Bragg angle with ZnFe2O4(311) (2=35.27∘), the poles of ZnO(101) also show up at 61.6∘ with much more intensities. The result is consistent with the theoretical ZnFe2O4(311) pole figure viewed along [111] with rotation twins. The in-plane orientation relationship is ZnFe2O4[110]ZnO[110]. Fig. 19(b) shows the schematics for the crystallographical orientation of ZnFe2O4 onto ZnO. Due to the fcc structure of ZnFe2O4 (a=0.844 nm), it is not difficult to understand its epitaxy onto hcp-ZnO (a=0.325 nm) with twin-crystallites of ZnFe2O4 of an in-plane rotation by 60∘. The coherence length of crystallites is around 20 nm in the out-of-plane direction. The in-plane coherence length is evaluated to be also as large as 20 nm by measuring the diffraction of (311) at 80∘(not shown), nearly parallel with the surface [94]. Due to the fcc structure of ZnFe2O4 (a=0.844 nm), it is not difficult to understand its crystallographical orientation onto hcp-ZnO (a=0.325 nm) with twin-crystallites of ZnFe2O4 of an in-plane rotation by 60∘. The lattice mismatch between ZnFe2O4 and ZnO is 6%.
5.3.2 NiFe2O4 and NiFe2O4
Generally, spinel ferrites (MFe2O4, M=Ni, Co, Fe, Mn, Zn) have a large variety of magnetic properties and have significant potential application in millimeter wave integrated circuitry and magnetic recording [95]. We also synthesized NiFe2O4 and CoFe2O4 by (Ni, Fe) and (Co, Fe) co-implantation, respectively [96]. The charge states of Ni, Fe and Co, as well as the phase formation of spinel have been confirmed by x-ray absorption. Nanocrystalline NiFe2O4 and CoFe2O4 are as soft and hard magnet, respectively, embedded inside ZnO. In the view of lattice mismatch, our results suggest the epitaxy of spinel ferrites onto ZnO, and even a multi-layered MFe2O4/ZnO structure given the growth method compatibility by pulsed laser deposition or molecular beam epitaxy for both materials [95, 97]. Thus, a hybrid structure of spinel ferrites/semiconducting ZnO could be a potential candidate for magneto-electronics devices.
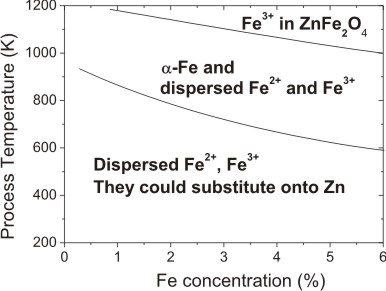
Summarizing our study on Fe implanted ZnO single crystals we present a phase diagram of Fe in ZnO depending on the implantation parameters, i.e. fluence, energy, and annealing temperature as shown in Figure 20. Note that the materials studied in this research are ZnO bulk crystals grown by hydro-thermal method. They are semi-insulating in the as-purchased state with n-type carrier concentration of 1012-1014 cm-3. The phase diagram will likely be different for epitaxial-ZnO and for p-type ZnO.
5.4 Hidden secondary phases
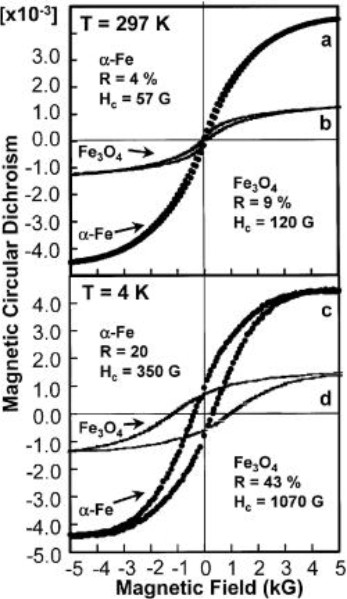
”Hidden” ferromagnetic secondary phases, i.e. CoZn clusters involving metallic Co have been found recently by Kaspar et al. in epitaxial Co doped ZnO [98]. Thus, they identified the origin of ferromagnetism appearing after annealing the samples in Zn vapor. Conventional characterization techniques indicate no change after treatment. Element specific methods like x-ray absorption fine structure are necessary to identify the secondary phase as ferromagnetic. CoZn may form during deposition or postgrowth processing under low-oxygen or vacuum conditions, even in the absence of Zn vapor. They say: ”CoZn is a particularly insidious ferromagnetic secondary phase, since its low moment per Co and low Curie temperature are in line with the expected properties of ferromagnetic Co:ZnO. Thus, in the absence of careful materials characterization, undetected CoZn could mimic intrinsic ferromagnetism in Co:ZnO.” Note that the change of ferromagnetic properties in oxides containing metallic TM clusters has been investigated much earlier for Fe clusters in YSZ [46]. The Fe within those clusters changes from metallic to ionic, dependent which annealing atmosphere, i.e. reducing or oxidizing, is applied (Fig. 21).
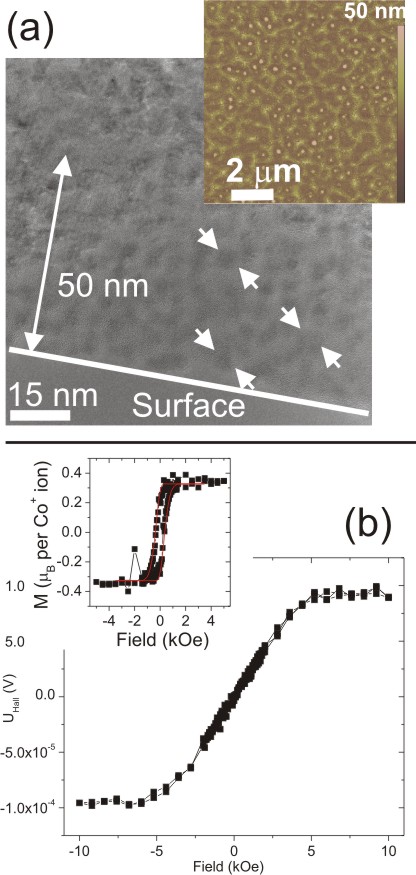
One reason for ”hidden” ferromagnetic clusters is their low crystallinity in the sense of reduced long range crystalline order or even amorphous phases. Such phases can occur for both metallic or oxide clusters of TM. The structural disorder can even influence the magnetic properties. As found during our research [99], such regions are created during implantation of Co+ ions into ZnO(0001) crystals located at a liquid-nitrogen cooled target. The fluence was 1.61017 cm-2 at an energy of 80 keV corresponding to an atomic concentration of 25%. At such large fluence, superparamagnetic clusters are formed which cannot be detected by the common XRD-scans and also can be easily overlooked in TEM due to the dominant crystalline background from the Wurtzite ZnO. Fig. 22 shows a compilation of those results. Fig. 22(a) shows a TEM micrograph of an amorphousd dominated near-surface region with small crystalline inclusions (white arrows). The upper right inset shows an AFM micrograph of the surface of the sample. The latter displays regular hillock-like structures created by the implantation. Fig. 22(b) shows the Hall measurement at 5 K in perpendicular geometry yielding anomalous Hall effect (AHE). SQUID magnetometry (inset) shows a saturation magnetization of 0.35 per Co ion implanted. Recent element-specific measurements using XMCD show that the ferromagnetic order mainly originates from metallic Co with an admixture of ordered ionic Co.
6 Summary, conclusions and comparison with other publications
The main message of this article is the following: There are manifold sources for - especially weak - ferromagnetic hysteresis in TM implanted ZnO single crystals. Ferromagnetic DMS has not been observed.
Nanoscale clusters of intrinsic defects containing (antiferromagnetically) interacting spins which are uncompensated at the surface can easily be confused with regions of ferromagnetic DMS, especially due to non-monotonic dependence on the doping concentration. In part 4 we showed strong evidence that a combination of microscopic defects in ZnO with delicate point like defects, both created upon energy impact, leads to weak ferromagnetic properties. In some cases, the ferromagnetic properties degrade or disappear after exposure to ambient conditions for some days or due to annealing at temperatures in the range of 1073 K. We would like to again point out that energy impact on low quality ZnO yields larger decomposition tendency than on high quality ZnO single crystals. In that way, nanoscale defect clusters can be formed easily in the pre-annealed samples and either reoxidize or annihilate with microscopic defects after annealing at large temperatures. The tiny defect responsible for the ferromagnetic properties remains unidentified. Intuitively, defects resulting from O-excess are not easily acceptable. On the other hand, the above preparation techniques decomposing ZnO can leave regions with Zn- and O-excess behind, even if a net oxygen loss occurs. The assumption of oxygen p-states to be the origin of the ferromagnetism would suggest defect magnetism to be a rather universal phenomenon in oxides. We do not want to completely exclude an influence of spurious TM contamination like Fe or Cu. Especially, since they are also attracted by the microscopic defects, i.e. the local concentration of TM contaminants might be much larger than for the whole sample. However, the above considerations make a scenario involving intrinsic defects of ZnO most likely.
In part 5 of this article, we presented metallic cluster formation in Fe, Ni and Co implanted ZnO single crystals. A general feature of such clusters is superparamagnetism, i.e. reduced critical temperatures, making the identification the the materials via the Curie temperature impossible. A correlation between magnetometry as well as high-resolution structural analysis helps, e.g., to understand the appearance of magnetic out-of-plane anisotropy in Co:ZnO and the XRD-invisibility of metallic Fe in Fe:ZnO. At mild implantation temperatures, the majority of the implanted ions, however, is in ionic state. Those ions are paramagnetic exhibiting Ni2+, Co2+, and mixed Fe2+/3+ oxidation states. Surprisingly, ZnO implanted with Co at low temperatures exhibits a huge amount of Co substitutional sites in the Wurtzite lattice [100]. After implantation of the pre-annealed crystals and post-annealing [101] no crystalline secondary phases could be detected for Fe or Ni implanted samples. The suppression of the cluster formation can be explained by microscopic defects created by the pre-annealing. These can act as sinks for the implanted TM ions where amorphous non-magnetic Zn-TM-O complexes are formed. Note that energy impact on low quality ZnO yields larger decomposition tendency than on high quality ZnO single crystals [102] which might promote the formation of such complexes during post-annealing. Large local concentration of TM ions achieved either by large fluences implanted or large annealing temperatures leads to the formation of inverted spinels. Those are ferrimagnetic and also lead to magnetic hysteresis loops. Besides crystalline ferro(i)magnetic clusters, low crystallinity in the sense of reduced long range structural order, or even amorphous regions have been found. Those are generally not detectable by common XRD scans.
Comparing our results with other groups, we realized that there is unfortunately only limited interest in the investigation of secondary phase formation in TM doped ZnO. The pioneering work on Co implanted ZnO revealed metallic Co clusters to be the main reason for ferromagnetism [65]. We extended these investigations to metallic Fe and Ni clusters. Inverted ZnTM2O4 spinel materials are well known for some decades. They are prepared intentionally for various technological applications. In spintronics, the interest in inverted spinel ZnTM2O4 rises due to its simultaneous ferromagnetic and semiconducting properties. One example is ZnCo2O4 with magnetic and semiconducting properties [89]. On the other hand, Co ions in structurally perfect films of the model system Zn1-xCoxO without second phases are proven to be paramagnetic [17]. These observations correspond to our results, although disorder has been introduced by the ion implantation. Recently it has been shown that a serious source for ferromagnetic properties of nanoparticles is uncompensated surface spins. Such spins can occur for any (antiferromagnetically) interacting paramagnetic electrons such as d electrons from TM and unpaired p-like electrons from intrinsic defects. The former has been discussed for ZnO containing CuO-clusters [67]. They are also known for pure CoO [103] or NiO [104] nanoparticles. Note that large saturation magnetization has been achieved for CoO nanoparticles in ref. [103]. Uncompensated surface spins are nearly ruled out as the only source for the observed room-temperature ferromagnetism. Defect induced ferromagnetism, as in our case, has been observed in Ar+ irradiated ZnO [56]. There is only limited potential for application of defect induced ferromagnetism. Suggestions to overcome the superparamagnetic limit in magnetic recording media was made by Hernando et al. [50] since defect induced ferromagnetism appears to show different temperature dependence as compared to the conventional one.
The example of ferromagnetic GaMnAs, however, proofs that our results do not exclude the existence of ZnO based DMS. Instead, more experimental work has to be done while monitoring unwanted magnetic properties by appropriate analysis methods. Alternative materials to TM diluted ZnO are TM based ferromagnetic spinels. The rich family of those spinels offers wide possibilities of tuning the bandgap, electronic conduction parameters and magnetic properties by selecting appropriate TM and inversion grade.
We would lime to thank E. Christalle, M. Missbach, A. Kunz, A. Scholz, J. Kreher, C. Neisser, H. Felsmann, as well as J. Schneider, S. Eisenwinder, and F. Ludewig for technical support. For scientific support as well as fruitful discussions we would like to thank M. Helm and W. Möller, J. Fassbender, W. Skorupa, A. Mücklich, R. Grötzschel, A. Shalimov, J. Grenzer, K. Kuepper, H. Schmidt, B. Schmidt, G. Brauer, H. Reuther, C. Bähtz, F. Eichhorn, V. Cantelli, T. Hermannsdörfer, T. Papageorgiou, Q. Xu, A. Janotti, M. Lorenz, E. Arenholz, J. D. Denlinger, S. Gemming, N. Volbers, J. Sann, S. Lautenschläger, W. Anwandt, G. Talut, G. Zhang.
The author (S.Z.) thanks for the financial funding from the Bundesministerium für Bildung und Forschung (FKZ03N8708).
References
- [1] S. A. Wolf, D. D. Awschalom, R. A. Buhrman, J. M. Daughton, S. von Molnar, M. L. Roukes, A. Y. Chtchelkanova, and D. M. Treger, Science 294(5546), 1488–1495 (2001).
- [2] S. Datta and B. Das, Appl. Phys. Lett. 56, 665–667 (1990).
- [3] A. M. Bratkovsky, Rep. Prog. Phys. 71, 026502 (2008).
- [4] G. Schmidt, D. Ferrand, L. W. Molenkamp, A. T. Filip, and B. J. van Wees, Phys. Rev. B 62, R4790–R4793 (2000).
- [5] A. Schmehl, V. Vaithyanathan, A. Herrnberger, S. Thiel, C. Richter, M. Liberati, T. Heeg, M. Rockerath, L. F. Kourkoutis, S. Muhlbauer, P. Boni, D. A. Muller, Y. Barash, U. Schubert, Y. Idzerda, J. Mannhart, and D. G. Schlom, Nat. Mater. 6, 882 (2007).
- [6] J. K. Furdyna, J. Appl. Phys. 64, R29–R64 (1988).
- [7] H. Munekata, H. Ohno, S. Vonmolnar, A. Segmuller, L. L. Chang, and L. Esaki, Phys. Rev. Lett. 63, 1849–1852 (1989).
- [8] H. Ohno, A. Shen, F. Matsukura, A. Oiwa, A. Endo, S. Katsumoto, and Y. Iye, Appl. Phys. Lett. 69, 363–365 (1996).
- [9] T. Dietl, H. Ohno, F. Matsukura, J. Cibert, and D. Ferrand, Science 287, 1019–1022 (2000).
- [10] T. Jungwirth, K. Y. Wang, J. Mašek, K. W. Edmonds, J. König, J. Sinova, M. Polini, N. A. Goncharuk, A. H. MacDonald, M. Sawicki, A. W. Rushforth, R. P. Campion, L. X. Zhao, C. T. Foxon, and B. L. Gallagher, Phys. Rev. B 72, 165204 (2005).
- [11] K. Sato, H. Katayama-Yoshida, and P. H. Dederichs, Jpn. J. Appl. Phys. 44, L948–L951 (2005).
- [12] K. Sato and H. Katayama-Yoshida, Physica E 10, 251–255 (2001).
- [13] Q. Xu, L. Hartmann, H. Schmidt, H. Hochmuth, M. Lorenz, R. Schmidt-Grund, D. Spemann, and M. Grundmann, J. Appl. Phys. 100, 013904 (2006).
- [14] Q. Xu, L. Hartmann, H. Schmidt, H. Hochmuth, M. Lorenz, R. Schmidt-Grund, C. Sturm, D. Spemann, M. Grundmann, and Y. Liu, J. Appl. Phys. 101, 063918 (2007).
- [15] Y. Liu, Q. Xu, H. Schmidt, L. Hartmann, H. Hochmuth, M. Lorenz, M. Grundmann, X. Han, and Z. Zhang, Appl. Phys. Lett. 90, 154101 (2007).
- [16] Q. Xu, L. Hartmann, H. Schmidt, H. Hochmuth, M. Lorenz, R. Schmidt-Grund, C. Sturm, D. Spemann, and M. Grundmann, Phys. Rev. B 73, 205342 (2006).
- [17] A. Ney, K. Ollefs, S. Ye, T. Kammermeier, V. Ney, T. C. Kaspar, S. A. Chambers, F. Wilhelm, and A. Rogalev, Phys. Rev. Lett. 100, 157201 (2008).
- [18] J. M. D. Coey, M. Venkatesan, and C. B. Fitzgerald, Nat. Mater. 4, 173–179 (2005).
- [19] H. S. Hsu, J. C. A. Huang, Y. H. Huang, Y. F. Liao, M. Z. Lin, C. H. Lee, J. F. Lee, S. F. Chen, L. Y. Lai, and C. P. Liu, Appl. Phys. Lett. 88, 242507 (2006).
- [20] K. R. Kittilstved, D. A. Schwartz, A. C. Tuan, S. M. Heald, S. A. Chambers, and D. R. Gamelin, Phys. Rev. Lett. 97, 037203 (2006).
- [21] G. Weyer, H. P. Gunnlaugsson, R. Mantovan, M. Fanciulli, D. Naidoo, K. Bharuth-Ram, and T. Agne, J. Appl. Phys. 102, 113915 (2007).
- [22] W. Yan, Z. Sun, Q. Liu, Z. Li, Z. Pan, J. Wang, S. Wei, D. Wang, Y. Zhou, and X. Zhang, Appl. Phys. Lett. 91, 062113 (2007).
- [23] D. Karmakar, S. K. Mandal, R. M. Kadam, P. L. Paulose, A. K. Rajarajan, T. K. Nath, A. K. Das, I. Dasgupta, and G. P. Das, Phys. Rev. B 75, 144404 (2007).
- [24] Q. Xu, H. Schmidt, L. Hartmann, H. Hochmuth, M. Lorenz, A. Setzer, P. Esquinazi, C. Meinecke, and M. Grundmann, Appl. Phys. Lett. 91, 092503 (2007).
- [25] K. R. Kittilstved and D. R. Gamelin, J. Am. Chem. Soc. 127, 5292 (2005).
- [26] C. Song, S. N. Pan, X. J. Liu, X. W. Li, F. Zeng, W. S. Yan, B. He, and F. Pan, J. Phys.: Condens. Matter 19, 176229 (2007).
- [27] F. Pan, C. Song, X. Liu, Y. Yang, and F. Zeng, Mater. Sci. Eng. R 62, 1 (2008).
- [28] C. Song, Y. C. Yang, X. W. Li, X. J. Liu, F. Zeng, and F. Pan, Appl. Phys. Lett. 91, 172109 (2007).
- [29] C. Song, X. J. Liu, F. Zeng, and F. Pan, Appl. Phys. Lett. 91, 042106 (2007).
- [30] Q. Xu, L. Hartmann, S. Zhou, A. Mcklich, M. Helm, G. Biehne, H. Hochmuth, M. Lorenz, M. Grundmann, and H. Schmidt, Phys. Rev. Lett. 101, 076601 (2008).
- [31] S. Ramachandran, J. Prater, N. Sudhakar, D. Kumar, and J. Narayan, Solid State Commun. 145, 18 (2008).
- [32] A. J. Behan, A. Mokhtari, H. J. Blythe, D. Score, X. H. Xu, J. R. Neal, A. M. Fox, and G. A. Gehring, Phys. Rev. Lett. 100, 047206 (2008).
- [33] A. Ney, T. Kammermeier, V. Ney, K. Ollefs, and S. Ye, J. Magn. Magn. Mater., in press (2008).
- [34] R. E. Dietz, H. Kamimura, M. D. Sturge, and A. Yariv, Phys. Rev. 132(Nov), 1559 (1963).
- [35] P. B. Dorain, Phys. Rev. 112, 1058 (1958).
- [36] W. M. Walsh and L. W. Rupp, Phys. Rev. 126, 952 (1962).
- [37] D. Azamata and M. Fanciullia, Physica B 401-402, 382 (2007).
- [38] D. Galland and A. Herve, Phys. Lett. A 33, 1 (1970).
- [39] J. M. Smith and W. E. Vehse, Phys. Lett. A 33, 147 (1970).
- [40] F. H. Leiter, H. R. Alves, A. Hofstaetter, D. M. Hofmann, and B. K. Meyer, phys. stat. sol. (b) 226, R4 (2001).
- [41] L. S. Vlasenko and G. D. Watkins, Phys. Rev. B 71, 125210 (2005).
- [42] D. C. Dobbon, J. W. Linett, and M. M. Eahman, J. Phys. Chem. Solids 31, 2727 (1970).
- [43] K. Tanaka, Y. Nakahara, K. Hirao, and N. Soga, J. Magn. Magn. Mater. 131, 120 (1994).
- [44] S. Deubler, J. Meier, R. Schuetz, and W. Witthuhn, Nucl. Inst. Meth. B 63, 223 (1992).
- [45] T. Paananen, K. Heinänen, and J. Härkki, ISIJ Int. 43, 597 (2003).
- [46] S. Honda, F. A. Modine, A. Meldrum, J. D. Budai, T. E. Haynes, and L. A. Boatner, Appl. Phys. Lett. 77, 711 (2000).
- [47] G. Brauer, W. Anwand, W. Skorupa, J. Kuriplach, O. Melikhova, J. Cizek, I. Prochazka, C. Moisson, H. von Wenckstern, H. Schmidt, M. Lorenz, and M. Grundmann, Superlattices Microstruct. 42, 259 (2007).
- [48] D. W. Abraham, M. M. Frank, and S. Guha, Appl. Phys. Lett. 87, 252502 (2005).
- [49] M. Venkatesan, C. B. Fitzgerald, and J. M. D. Coey, Nature 430, 650 (2004).
- [50] A. Hernando, P. Crespo, M. A. García, E. F. Pinel, J. de la Venta, A. Fernández, and S. Penadés, Phys. Rev. B 74, 052403 (2006).
- [51] D. Riegel, H. J. Barth, L. Büermann, H. Haas, and C. Stenzel, Phys. Rev. Lett. 57, 388 (1986).
- [52] B. K. Rao and P. Jena, Phys. Rev. Lett. 89(18), 185504 (2002).
- [53] Y. A. Freiman and H. J. Jodl, Phys. Rep. 401, 1 (2004).
- [54] H. Ohldag, T. Tyliszczak, R. Höhne, D. Spemann, P. Esquinazi, M. Ungureanu, and T. Butz, Phys. Rev. Lett. 98, 187204 (2007).
- [55] A. Janotti and C. G. V. de Walle, Phys. Rev. B 76, 165202 (2007).
- [56] R. P. Borges, R. C. da Silva, S. M. aes, M. M. Cruz, and M. Godinho, J. Phys.: Conden. Matter 19, 476207 (2007).
- [57] D. Sanyal, T. K. Roy, M. Chakrabarti, S. Dechoudhury, D. Bhowmick, and A. Chakrabarti, J. Phys.: Conden. Matter 20, 045217 (2008).
- [58] N. G. Kakazey, T. V. Sreckovic, and M. Ristic, J. Mater. Sci. 32, 4619 (1997).
- [59] S. O. Kucheyev, J. S. Williams, C. Jagadish, J. Zou, C. Evans, A. J. Nelson, and A. V. Hamza, Phys. Rev. B 67(Mar), 094115 (2003).
- [60] S. Zhou, K. Potzger, G. Talut, H. Reuther, K. Kuepper, J. Grenzer, Q. Xu, A. Mücklich, M. Helm, J. Fassbender, and E. Arenholz, J. Phys. D: Appl. Phys. 41, 105011 (2008).
- [61] N. H. Hong, J. Sakai, and V. Brizé, J. Phys.: Condens. Matter 19, 036219 (2007).
- [62] M. Gacic, G. Jakob, C. Herbort, H. Adrian, T. Tietze, S. Brück, and E. Goering, Phys. Rev. B 75, 205206 (2007).
- [63] Q. Xu, H. Schmidt, S. Zhou, K. Potzger, M. Helm, H. Hochmuth, M. Lorenz, A. Setzer, P. Esquinazi, C. Meinecke, and M. Grundmann, Appl. Phys. Lett. 92, 082508 (2008).
- [64] J. Ziegler, J. Biersack, and U. Littmark, The stopping and range of ions in matter (Pergamon, New York, 1985).
- [65] D. P. Norton, M. E. Overberg, S. J. Pearton, K. Pruessner, J. D. Budai, L. A. Boatner, M. F. Chisholm, J. S. Lee, Z. G. Khim, Y. D. Park, and R. G. Wilson, Appl. Phys. Lett. 83, 5488–5490 (2003).
- [66] S. K. Nayak and P. Jena, Phys. Rev. Lett. 81(14), 2970 (1998).
- [67] C. Sudakar, J. S. Thakur, G. Lawes, R. Naik, and V. M. Naik, Phys. Rev. B 75, 054423 (2007).
- [68] K. H. Heinig, T. Mueller, B. Schmidt, M. Strobel, and M. Moeller, Appl. Phys. A 77, 17 (2003).
- [69] P. J. Wellmann, J. M. Garcia, J. L. Feng, and P. M. Petroff, Appl. Phys. Lett. 71, 2532–2534 (1997).
- [70] J. Shi, J. M. Kikkawa, R. Proksch, T. Schaffer, D. D. Awschalom, G. Medeirosribeiro, and P. M. Petroff, Nature 377, 707–710 (1995).
- [71] Z. W. Jin, T. Fukumura, M. Kawasaki, K. Ando, H. Saito, T. Sekiguchi, Y. Z. Yoo, M. Murakami, Y. Matsumoto, T. Hasegawa, and H. Koinuma, Appl. Phys. Lett. 78, 3824–3826 (2001).
- [72] M. Farle, Proceedings of the 36th IFF Spring School, in: Magnetism goes Nano, (Juelich, Germany, 2005), p. C4.2.
- [73] M. Respaud, J. M. Broto, H. Rakoto, A. R. Fert, L. Thomas, B. Barbara, M. Verelst, E. Snoeck, P. Lecante, A. Mosset, J. Osuna, T. O. Ely, C. Amiens, and B. Chaudret, Phys. Rev. B 57, 2925–2935 (1998).
- [74] C. P. Bean and J. D. Livingston, J. Appl. Phys. 30, S120–S129 (1959).
- [75] S. R. Shinde, S. B. Ogale, J. S. Higgins, H. Zheng, A. J. Millis, V. N. Kulkarni, R. Ramesh, R. L. Greene, and T. Venkatesan, Phys. Rev. Lett. 92, 166601 (2004).
- [76] S. Zhou, K. Potzger, G. Talut, H. Reuther, J. von Borany, R. Grötzschel, W. Skorupa, M. Helm, J. Fassbender, N. Volbers, M. Lorenz, and T. Herrmannsdörfer, J. Appl. Phys. 103, 023902 (2008).
- [77] P. Poddar, Y. Sahoo, H. Srikanth, and P. N. Prasad, Appl. Phys. Lett. 87, 062506 (2005).
- [78] T. Song and R. Roshko, Physica B 275, 24–27 (2000).
- [79] Y. Takano, A. Arai, Y. Takahashi, K. Takase, and K. Sekizawa, J. Appl. Phys. 93, 8197–8199 (2003).
- [80] B. D. Cullity, Elements of X-ray Diffractions (Reading, Addison-Wesley, 1978).
- [81] S. Zhou, K. Potzger, J. von Borany, R. Grötzschel, W. Skorupa, M. Helm, and J. Fassbender, Phys. Rev. B 77, 035209 (2008).
- [82] D. C. Kundaliya, S. B. Ogale, S. E. Lofland, S. Dhar, C. J. Metting, S. R. Shinde, Z. Ma, B. Varughese, K. V. Ramanujachary, L. Salamanca-Riba, and T. Venkatesan, Nat. Mater. 3, 709–714 (2004).
- [83] H. Zhou, L. Chen, V. Malik, C. Knies, D. M. Hofmann, K. P. Bhatti, S. Chaudhary, P. J. Klar, W. Heimbrodt, C. Klingshirn, and H. Kalt, physica status solidi (a) 204, 112 (2006).
- [84] S. K. Nayak, M. Ogura, A. Hucht, S. Buschmann, H. Akai, and P. Entel, physica status solidi (a) 205, 1839 (2008).
- [85] T. Dietl, T. Andrearczyk, A. Lipińska, M. Kiecana, M. Tay, and Y. Wu, Phys. Rev. B 76, 155312 (2007).
- [86] R. K. Zheng, H. Liu, X. X. Zhang, V. A. L. Roy, and A. B. Djurisic, Appl. Phys. Lett. 85, 2589–2591 (2004).
- [87] X. Wang, J. Xu, X. Yu, K. Xue, J. Yu, and X. Zhao, Appl. Phys. Lett. 91, 031908 (2007).
- [88] K. Samanta, P. Bhattacharya, R. S. Katiyar, W. Iwamoto, P. G. Pagliuso, and C. Rettori, Phys. Rev. B 73, 245213 (2006).
- [89] H. J. Kim, I. C. Song, J. H. Sim, H. Kim, D. Kim, Y. E. Ihm, and W. K. Choo, J. Appl. Phys. 95, 7387 (2004).
- [90] S. Zhou, K. Potzger, H. Reuther, G. Talut, F. Eichhorn, J. von Borany, W. Skorupa, M. Helm, and J. Fassbender, J. Phys. D-Appl. Phys. 40, 964 (2007).
- [91] C. N. Chinnasamy, A. Narayanasamy, N. Ponpandian, K. Chattopadhyay, H. Guerault, and J. M. Greneche, J. Phys.-Condens. Matter 12, 7795–7805 (2000).
- [92] H. H. Hamdeh, J. C. Ho, S. A. Oliver, R. J. Willey, G. Oliveri, and G. Busca, J. Appl. Phys. 81, 1851–1857 (1997).
- [93] Z. H. Zhou, J. Wang, J. M. Xue, and H. S. O. Chan, Appl. Phys. Lett. 79, 3167–3169 (2001).
- [94] H. Heinke, V. Kirchner, S. Einfeldt, and D. Hommel, Appl. Phys. Lett. 77, 2145–2147 (2000).
- [95] Y. Suzuki, Annu. Rev. Mater. Res. 31, 265–289 (2001).
- [96] S. Zhou, K. Potzger, Q. Xu, K. Kuepper, G. Talut, A. Mücklich, M. Helm, J. Fassbender, E. Arenholz, and H. Schmidt, Phys. Rev. B, to be published (2009).
- [97] U. Ozgur, Y. I. Alivov, C. Liu, A. Teke, M. A. Reshchikov, S. Dogan, V. Avrutin, S. J. Cho, and H. Morkoc, J. Appl. Phys. 98, 103 (2005).
- [98] T. C. Kaspar, T. Droubay, S. M. Heald, M. H. Engelhard, P. Nachimuthu, and S. A. Chambers, Phys. Rev. B 77, 201303 (2008).
- [99] K. Potzger, S. Zhou, Q. Xu, A. Shalimov, R. Groetzschel, H. Schmidt, A. Mücklich, M. Helm, and J. Fassbender, Appl. Phys. Lett. 93, 232504 (2008).
- [100] K. Potzger, K. Kuepper, Q. Xu, S. Zhou, H. Schmidt, M. Helm, and J. Fassbender, J. Appl. Phys. 104, 023510 (2008).
- [101] K. Potzger, S. Zhou, H. Reuther, K. Kuepper, G. Talut, M. Helm, J. Fassbender, and J. D. Denlinger, Appl. Phys. Lett. 91, 062107 (2007).
- [102] V. A. Coleman, H. H. Tan, C. Jagadish, S. O. Kucheyev, and J. Zou, Appl. Phys. Lett. 87, 231912 (2005).
- [103] D. P. Dutta, G. Sharma, P. K. Manna, A. K. Tyagi, and S. M. Yusuf, Nanotechnology 19, 245609 (2008).
- [104] J. B. Yi, J. Ding, Y. P. Feng, G. W. Peng, G. M. Chow, Y. Kawazoe, B. H. Liu, J. H. Yin, and S. Thongmee, Phys. Rev. B 76, 224402 (2007).