Spitzer detection of PAH and silicate features in post-AGB stars and young Planetary Nebulae
Abstract
We have observed a small sample of hot post-AGB stars with the InfraRed Array Camera (IRAC) and the InfraRed Spectrograph (IRS) on-board the Spitzer Space Telescope. The stars were selected from the literature on the basis of their far-Infrared excess (i.e., post-AGB candidates) and B spectral type (i.e., close to the ionization of the envelope). The combination of our IRAC observations with 2MASS and IRAS catalog data, along with previous radio observations in the cm range (where available) allowed us to model the SEDs of our targets and find that in almost all of them at least two shells of dust at different temperatures must be present, the hot dust component ranging up to K. In several targets grains larger than 1 m are needed to match the far-IR data points. In particular, in IRAS 17423-1755 grains up to 100 m must be introduced to match the emission in the mm range.
We obtained IRS spectra to identify the chemistry of the envelopes and found that more than of the sources in our sample have mixed chemistry, showing both mid-IR bands attributed to Polycyclic Aromatic Hydrocarbons (PAH) and silicate features. The analysis of the PAH features indicates that these molecules are located in the outflows, far away from the central stars. We consider the larger than expected percentage of mixed-chemistry targets as a selection bias towards stars with a disk or torus around them. Our results strengthen the current picture of mixed chemistry being due to the spatial segregation of different dust populations in the envelopes.
Subject headings:
Infrared: general, Stars: AGB and post-AGB, Planetary Nebulae: general1. Introduction
Planetary Nebulae (PNe) evolve from intermediate mass stars. During their evolution they go through the Asymptotic Giant Branch (AGB) and then into the PN phase, ending their days as white dwarfs. The formation and early evolution of PNe are a poorly understood phase of stellar evolution. In particular, it is not clear yet how the spherically symmetric AGB circumstellar shells transform themselves into the non spherical symmetries observed in the envelopes of evolved PNe. During their AGB phase stars lose most of their initial mass, their mass loss rates ranging from 10-7 up to 10-4 M⊙ yr-1. The star develops a wind that carries away from its photosphere the enriched material produced by nucleosynthesis and dredged up from the core to the surface. This ejected material eventually cools down and creates a circumstellar envelope of dust and gas, whose chemistry is determined by the C/O ratio in the stellar outer regions (Hiriart & Kwan,, 2000). When the star has evolved past the tip of the AGB, the dust and gas circumstellar envelope is typically so thick that the star cannot be detected at optical wavelengths: the expansion and subsequent dilution of the envelope leads to the optical detection of post-AGB stars. The end of the post-AGB evolution can be identified as the onset of the ionization in the envelope, when the central star reaches temperatures around 20–30 K. The ionization is in fact considered as the beginning of the PN phase.
Studies of the infrared (IR) properties of AGB and post-AGB stars have determined that in O-rich envelopes silicate features at 10 and 18 m are first seen in emission during the AGB, then in absorption when the envelope becomes optically thick, and then again in emission, after the envelope becomes optically thin to the mid-IR radiation (García-Lario & Perea Calderon,, 2003). A similar evolutionary scheme is observed in C-rich envelopes, although with different spectral features. Low-mass O-rich stars are not expected to develop an optically thick envelope, therefore the silicate features are never seen in absorption in these stars (García-Lario & Perea Calderon,, 2003).
A small fraction of post-AGB stars and PNe show both O-rich and C-rich features and are therefore classified as mixed-chemistry objects. The origin of their mixed chemistry is still uncertain. For example, in the Red Rectangle this has been explained as due to the presence of a circumbinary disk that was formed when the star was still O-rich and then served as a silicate reservoir, while the C-rich features originate in the dredged-up outflow (Waters et al., 1998, ). A different scenario has been proposed for high mass stars, in which hot bottom burning would convert 12C into 14N and change a C-rich envelope back into an O-rich one (Justanott et al.,, 1992).
Many observational programs have been carried out to find new planetary and proto-planetary nebulae among unidentified IRAS sources with far infrared colors similar to those of known PNe (Pottasch et al.,, 1988; Parthasarathy & Pottasch,, 1989), with the final aim of understanding PN formation through the discovery and analysis of new Transition Objects (TO). In these sources the physical processes associated with PN formation, such as dynamical shaping, are still occurring and, as the number of known TO is extremely small, the identification and study of new samples is relevant for further testing current models of stellar evolution.
To detect new TO, we have selected a sample of stars classified in the literature as post-AGB on the basis of their IRAS colors and optical spectra. We have selected our stars from lists of post-AGB candidates available in the literature (Parthsarathy et al.,, 2000; Suárez et al.,, 2006), with the constraint of a B-type spectral classification and far-IR excess. The B spectral type implies the central star can be hot enough to have started to ionize the circumstellar envelope. This maximizes the chance that the objects are right in the transition from post-AGB to PN, although misclassifications cannot be ruled out. Radio observations of this sample were carried out to check for the presence of free-free emission from ionized shells. These observations have been reported in Umana et al., (2004) and Cerrigone et al., 2008a .
To further characterize our sample, we performed observations with the Spitzer Space Telescope. Mid-IR observations probe the extended envelopes that surround post-AGB stars and young PNe, which are in most cases only partly ionized. The main goals of such observations are to assess the morphology of the neutral gas and dust components and to characterize their mineralogy. Comparing the results of these observations to the properties of the ionized gas, as derived from previous radio observations, could in principle provide important clues on the shaping of the nebulae.
2. Observations
As a follow-up to our radio detections, we observed 26 objects with the Spitzer Space Telescope (Spitzer). Infrared imaging was performed with the InfraRed Array Camera (IRAC) (Fazio et al.,, 2004) at 3.6, 4.5, 5.8, and 8.0 m to search for faint extended emission. The observations were carried out in several Spitzer campaigns in 2006 and 2007 (Program ID: 30036). The IRAC observations were performed in High Dynamic Range mode. For each target we obtained 8 dithered frames, for a total on source time of about 96 s per IRAC channel. Basic Calibrated Data (BCD) were retrieved from the Spitzer archive (pipeline versions: S14.0.0, S15.0.5, and S16.1.0), cleaned to correct such artifacts as mux-bleeding and banding and then coadded using IRACproc (Schuster et al.,, 2006). The photometry was performed by PSF subtraction in the final mosaics. This technique has been specifically developed to perform photometry even in heavily saturated objects (Marengo et al.,, 2007). The method derives Vega magnitudes of saturated stars by fitting the low level features of the saturated PSF (diffraction spikes and PSF wings) with a model of the IRAC PSF obtained from a sample of bright stars (Marengo et al.,, 2006). The PSF is directly normalized to the IRAC observation of Vega, therefore, by fitting it to the observed sources, magnitudes can be calculated with an accuracy within 1–3% independently of the standard IRAC flux calibration (Schuster et al.,, 2006).
Observations with the InfraRed Spectrograph (IRS; Houck et al.,, 2004) were performed within the same program in 2006 and 2007. The observations were carried out in low spectral resolution mode (R60–120), covering the 5–38 m range, to assess the chemistry of the envelopes. Each target was observed in all the available low resolution modules (SL and LL) with a ramp time of 6 s per cycle. Two cycles per module were typically performed. Those targets with IRAS 12 flux below 1 Jy were observed for 3 cycles in the 5.2–14.5 modules, to keep a high enough S/N (typically 50). The IRS pipeline version S17.2.0 (partial) BCDs were retrieved from the archive. The sky subtraction was performed taking advantage of the way the data are acquired by default. Each module has two sub-modules (SL2 and SL1, LL2 and LL1) observing at the same time, but not in the same direction. Since the two sub-modules do not point the same target at the same time, when one is on-target, the other is performing a sky observation. The data taken by SL1 (LL1) when SL2 (LL2) is on target can then be used as a sky frame for a subsequent SL1 (LL1) pointing and vice versa. For each BCD, we have averaged all the off-target observations and subtracted this from the single on-target BCDs. The spectrum was extracted in every BCD with SPICE using the optimal point source extraction option. For each target, all its extracted spectra were then averaged and combined into one using SMART111SMART was developed by the IRS Team at Cornell University and is available through the Spitzer Science Center at Caltech. (Higdon et al.,, 2004).
3. Results
3.1. IRAC photometry
IRAC has proved to be a very sensitive instrument, revealing previously unseen structures in the outer shells of expanded PNe (Hora et al.,, 2004). Since the nebulae in our sample are typically very compact and IR-bright, which is normal for their evolutionary status, their core emission dominates the inner few arcsec near the central source. This unfortunately usually prevents us from detecting any weak extended emission near the core, but, by PSF subtraction, does not prevent us from measuring the fluxes of our sources. Given the size of the PSF, an upper limit of 5′′ to the sizes of the nebulae can be estimated (Marengo, private communication).
In Table 1 we list the photometric results obtained. For a comparison of our results to previous observations in the literature (i.e., Hora et al., (2008); Phillips & Ramos Larios, (2008)), we show in Figure 1 four color-color diagrams based on IRAC data. As already shown in Hora et al., (2008), PNe do not seem to follow any specific track on the IRAC versus diagram. We find our targets to be generally located in an area ranging from 0 to 3 in and from 0 to 1 in . This region is included in the area where PNe are found in the two works mentioned above. A comparison of the versus diagram to the analogous one in Hora et al., (2008) shows that the stars in our sample have on average lower values of , which may be explained if PAH emission features are present (see § 3.2); the spread in indicates that different dust temperatures can be found in these objects, with the radio-detected ones (i.e., hotter central stars) being redder in .
| Target | F3.6 | F4.5 | F5.8 | F8.0 | F24 |
|---|---|---|---|---|---|
| IRAS ID | mJy | mJy | mJy | mJy | Jy |
| 01005+7910 | 175.6 9.1 | 189.2 9.8 | 460.0 24.0 | 2004.1 104.4 | 18.1 0.9 |
| 06556+1623 | 759.2 39.5 | 898.5 46.8 | 1045.5 54.5 | 1210.0 63.0 | 2.8 0.2 |
| 09470-4617 | 70.2 3.7 | 89.9 4.7 | 191.7 10.0 | 1233.3 64.3 | 3.5 0.2 |
| 17074-1845 | 17.6 0.9 | 12.0 0.6 | 10.5 0.5 | 47.5 2.5 | 10.7 0.6 |
| 17203-1534 | 18.7 1.0 | 12.8 0.7 | 11.5 0.6 | 24.7 1.3 | 8.9 0.5 |
| 17364-1238 | 10.8 0.6 | 8.2 0.4 | 7.7 0.4 | 9.9 0.5 | 1.1 0.1 |
| 17381-1616 | 4.3 0.2 | 3.6 0.2 | 2.9 0.1 | 33.1 1.7 | 4.4 0.3 |
| 17423-1755 | 3425.6 178.4 | 4492.5 233.8 | 5227.3 272.5 | 5344.2 278.5 | 24.2 1.2 |
| 17542-0603 | 936.3 48.8 | 1057.1 55.0 | 1045.5 54.5 | 1105.7 57.6 | 5.3 0.3 |
| 18040-1457 | 312.1 16.3 | 211.4 11.0 | 209.1 10.9 | 142.5 7.4 | 0.110.11 |
| 18062+2410 | 7.4 0.4 | 9.0 0.5 | 13.5 0.7 | 557.7 29.1 | 16.3 0.9 |
| 18070-2346 | 187.3 9.8 | 119.8 6.2 | 82.1 4.3 | 55.8 2.9 | 1.0 0.1 |
| 18367-1233 | 6532.6 340.3 | 5990.0 311.8 | 5750.0 299.8 | 7125.6 371.3 | –aaNo IRS spectrum available to calculate the 24 m flux density. |
| 18371-3159 | 7.0 0.4 | 6.0 0.3 | 7.7 0.4 | 22.1 1.2 | 5.9 0.3 |
| 18379-1707 | 41.3 2.2 | 38.2 2.0 | 82.1 4.3 | 320.7 16.7 | 29.9 1.0 |
| 18442-1144 | 16.5 0.9 | 18.0 0.9 | 71.9 3.7 | 320.7 16.7 | 12.1 0.6 |
| 19200+3457 | 18.7 1.0 | 13.8 0.7 | 38.3 2.0 | 142.5 7.4 | 1.6 0.1 |
| 19306+1407 | 40.1 2.1 | 30.0 1.6 | 88.5 4.6 | 583.0 30.4 | 47.5 2.9 |
| 19336-0400 | 9.4 0.5 | 9.0 0.5 | 10.5 0.5 | 53.4 2.8 | 6.7 0.4 |
| 19399+2312 | 280.9 14.6 | 179.7 9.4 | 164.3 8.6 | 142.5 7.4 | 0.120.11 |
| 19590-1249 | 14.0 0.7 | 11.2 0.6 | 11.5 0.6 | 25.7 1.3 | 7.9 0.4 |
| 20462+3416 | 24.4 1.3 | 16.3 0.9 | 17.7 0.9 | 27.9 1.5 | 11.1 0.6 |
| 20572+4919 | 936.3 48.8 | 898.5 46.8 | 884.6 46.1 | 1733.2 90.3 | 8.5 0.4 |
| 21289+5815 | 61.1 3.2 | 64.2 3.3 | 92.0 4.8 | 246.7 12.9 | 1.1 0.1 |
| 22023+5249 | 18.7 1.0 | 16.3 0.9 | 37.7 2.0 | 229.0 11.9 | 19.0 1.1 |
| 22495+5134 | 10.4 0.5 | 9.5 0.5 | 12.1 0.6 | 80.2 4.2 | 9.7 0.5 |
Note. — The values in columns 2–5 are calculated by PSF subtraction. The errors include the error in the IRAC zero point magnitudes and a 5% error due to the PSF subtraction method. The values at 24 m listed in column 6 are calculated from IRS spectra.

We also plotted our targets on a H-K versus K- diagram, which can be compared to the JHK diagram in Figure 2. A similar trend can be found in both plots. As shown in van der Veen et al., (1989), the JHK diagram allows us to distinguish different types of sources. Many of our targets are concentrated in the hot star and nebula star regions, as expected for their B spectral type classification. Other targets fall within regions of objects with a hot star and strong dust emission. The presence of a large amount of dust around the central stars is also evident in the versus diagram. Since we do not have MIPS observations of our targets but we have 5–38 m IRS spectra, we calculated the expected 24 m MIPS measurement by convolving our IRS spectra with the MIPS Spectral Response Function and then integrating over the bandpass. Performing this calculation on literature targets with both IRS and MIPS data has produced results compatible, within errors, with the observations, therefore we are confident that our expected MIPS values are reasonable approximations to the actual values. Interestingly, among the radio detected objects in this diagram we can distinguish a group of stars clustered around (4,2), namely IRAS 06556+1623 and 17423-1755, while the others seem to be found in a stripe roughly going from (5,6) to (9,1). After noticing these possible different distributions, we checked the positions of the “central” targets in the other diagrams, thus finding that although the overall distributions of our targets match those observed in Hora et al., (2008), IRAS 06556+1623 and 17423-1755 seem not to follow the trend of the other radio detected objects. In versus and versus , these stars are found respectively around (0.7,0.7) and (1.3,0.7), while in H-K versus K- they are the two top-right radio detected objects (highest H-K and K-).

3.2. IRS spectra
The reduced IRS spectra of the objects in our sample are shown in Figures 3–7. They are split into three groups: C-rich, O-rich, and mixed chemistry. PNe are usually classified as C-rich or O-rich. This classification is linked to the evolution of the central star, because it depends on the possibility for the star to go through a third dredge-up. It is this event that alters the chemistry in the envelope turning it from O-rich into C-rich during the AGB phase (Salaris & Cassisi,, 2005). Because of the stability of the CO molecule, if C is less abundant than O, all C is trapped in CO and then the envelope shows features of molecules containing oxygen (besides CO) and vice versa if O is less abundant than C. It is known however that a minority of stars shows mixed chemistry, with C-bearing and O-bearing molecules.


More than of the stars in our sample show both Polycyclic Aromatic Hydrocarbons (PAH) and silicate features, while a smaller percentage (10%) is expected. Among these mixed-chemistry objects about 70% are radio detected.
We distinguished O-rich and C-rich envelopes on the presence of amorphous silicate (10-m bump) or PAH features (mainly 6.2 and 7.7 m). Objects with both a 10-m silicate feature and PAH transitions were classified as mixed–chemistry. It must be noticed that the SL and LL IRS modules overlap around 14–15 m, therefore this region of the spectra is subject to higher noise. Shifts between the flux levels are also possible. In a few cases, we have scaled the SL spectra to the LL flux level.
All the targets classified as C-rich show 6.2, 7.7, 8.5, and 11.2 m features, commonly attributed to PAH. The shape and strength of the features depend on the excitation status and size of the molecules. We address the properties of these features in the next section.
We do not detect the so-called 21 m feature in any of our targets. This feature has in fact been found in 15 post-AGB stars with F-G spectral types and in two PNe (Molster & Waters,, 2003). Therefore, besides being a rare feature, the chances for its detection are even lower in B stars as those in our sample, because of the harder radiation field from the central star.
The sources IRAS 01005+7910 and 19200+3457 show a strong broad feature around 30 m that has been previously observed in other post-AGB stars and PNe and is attributed to MgS. The peak position and width of this feature change as the temperature of the underlying continuum changes, corresponding to the evolution from post-AGB to PN. The peak is found in the 26–35 m range (Molster et al.,, 2002). It is likely that such emission is present in IRAS 18442-1144 around 34 m, although weaker and with a smaller width. This target and IRAS 06556+1623 show an excess of emission peaking around 17.7 m (Figure 8) that can be explained as due to vibrationally excited C-H bonds (Molster & Waters,, 2003). This emission is also detected in 01005+7910 and 19200+3457 as a very broad feature. IRAS 06556+1623 also shows a weak broad emission underlying the 6.2, 7.7 and 11.2 m features, which is due to PAH molecules as well.
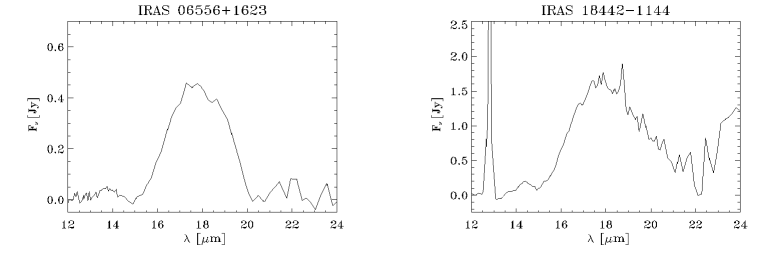
In O-rich targets, as we can see in Figures 4 and 5, the 10 m broad feature from amorphous silicates is clearly seen, although it often appears to be structured. In IRAS 17074-1845, 17203-1534, and 20572+4919 we clearly distinguish the presence of single features contributing to the overall bump.
The shift in shape from the smooth ISM-like feature (clearly peaked at 9.8 m) to the structured plateau-like feature of the material in the Solar System (peaked at 11.3 m) has been explained as due to grain processing, i.e. coagulation of small (0.1 m) grains into large (1–2 m) grains and annealing of amorphous silicates into crystalline magnesium silicates and silica (Bouwman et al.,, 2001).
A correlation of the shape and strength of the 10-m silicate emission feature has been observed in Herbig AeBe and T Tauri stars and it has been interpreted as evidence of grain processing in the circumstellar disks of those stars (van Boeckel et al.,, 2003; Przygodda et al.,, 2003).
The shape of the feature can be estimated by comparing the continuum-subtracted flux ratio at 11.3 and 9.8 m to the peak-to-continuum ratio. We have performed this comparison for our O-rich targets. Mixed-chemistry sources were not included because of the PAH 11.2 m feature, which would affect the flux estimates. IRAS 18435-0052 was not included either, because it shows the 9.8 m feature in absorption, which would clearly make it an outlier. The plot obtained is shown in Figure 9. The data points are sparse in the diagram: though a similar trend as in young stars might be present, we cannot conclude that this is the case. The absence of linear correlation may be explained as due to non-linear effects in highly processed dust (11.3/9.8 flux ratio ), as pointed out by Apai et al., (2005). Our results match with those found by Gielen et al, (2008), who inspected disks around post-AGB stars. The similarity of the results leads us to the conclusion that in spite of the absence of correlation, the dust in our targets shows a high degree of processing, which points to the presence of a stable structure where the grains can have time to grow and anneal. This is a hint for the presence of circumstellar/circumbinary disks in our sources.

As noticed above, IRAS 18435-0052 is the only target in which the silicate bump shows an absorption feature on top of the emission. Since silicates are seen in absorption early after the AGB, the presence of both absorption and emission features may be interpreted as an earlier evolutionary stage for this source. Although this target has been classified as a BII star (Parthsarathy et al.,, 2000), its IRS spectrum indicates major differences to the rest of the sample. Almost all of these targets also show an emission feature around 18 m that can be attributed to amorphous silicates. In Figure 10 we show two examples of this feature.
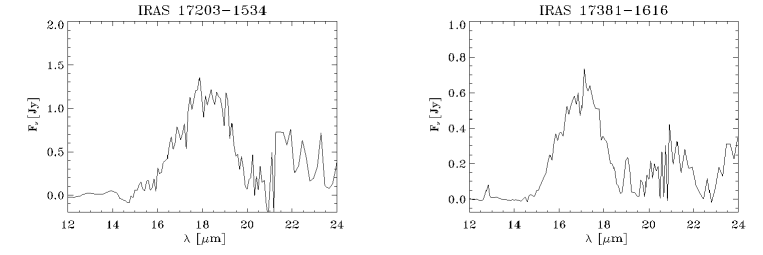
In such targets as 17381-1616, 17460-3114, 19157-0247, 18371-3159, 19336-0400, 19590-1249, 20462+3416, and 22495+5134 crystalline silicate features around 23.7, 27.6 and 33.6 m are visible. The presence of crystalline silicates in post-AGB stars has been previously reported although different hypotheses exist about the production mechanism of these crystals (Molster et al.,, 1999).
In Figures 6 and 7 the spectra of those sources with both silicate and PAH features are shown. The 10 m silicate bump is typically much stronger than the 6.2 and 7.7 m PAH features. The 11.2 m feature is blended with the silicate emission and detected on top of it. Six of these stars also show the [Ne II] 12.8 m line, which proves their ionized status. Four of them also have the [Ar II] 7 m emission line.
3.3. PAH features
The presence of PAH features in post-AGB envelopes is well-known, although it is not yet clear how these molecules are produced (Tielens,, 2008).
As a first step in the analysis of these features, we have classified our targets according to the scheme developed in Peeters et al., (2002), with the exception of IRAS 06556+1623 and 17542-0603 because of their S/N ratio in the 5–11 m range. Almost all of our sources have their peak of the 6.2 m emission feature beyond 6.235 m, which puts them in class B. If we also consider the 7.7 m and 8.5 m features, the stars in our sample show a more complicated picture. While the three A class sources are also classified as A′ and A′′, class B sources spread into a group of intermediate subclasses. Tables 2 and 3 report the classification for every target. The wavelengths calculated do not correspond to the peaks of the features, but to their central (median-flux) wavelengths, which better accounts for the different components within each complex. The 7.7 m features have been classified as A′ or B′ if their central wavelength was respectively smaller or larger than 7.7 m, since the complex appears to be mainly due to two features peaking around 7.6 and 7.8 m.
| Target | Class | ||||
|---|---|---|---|---|---|
| IRAS ID | m | m | m | m | |
| 01005+7910 | 6.231 0.005 | 7.58 0.08 | 8.59 0.03 | 11.21 0.07 | AA′A′′ |
| 09470-4617 | 6.227 0.005 | 7.66 0.03 | 8.60 0.06 | 11.29 0.01 | AA′A′′ |
| 18442-1144 | 6.238 0.001 | 7.64 0.01 | 8.60 0.07 | 11.205 0.004 | BA′A′′ |
| 19200+3457 | 6.24 0.04 | 7.61 0.07 | 8.58 0.02 | 11.250 0.006 | BA′A′′ |
| 18371-3159 | 6.28 0.01 | 7.68 0.09 | 8.61 0.09 | 11.2 0.1 | BA′A′′ |
| 18379-1707 | 6.266 0.004 | 7.62 0.04 | 8.57 0.06 | 11.03 0.06 | BA′A′′ |
| 19306+1407 | 6.240 0.003 | 7.74 0.04 | 8.6 0.1 | 11.30 0.07 | BB′B′′ |
| 19336-0400 | 6.25 0.01 | 7.61 0.02 | 8.70 0.02 | 11.30 0.03 | BA′B′′ |
| 19590-1249 | 6.22 0.06 | 7.58 0.02 | 8.62 0.03 | 11.21 0.03 | AA′A′′ |
| 20462+3416 | 6.25 0.01 | 7.66 0.06 | 8.58 0.04 | 11.26 0.03 | BA′A′′ |
| 21289+5815 | 6.251 0.001 | 7.74 0.03 | 8.64 0.08 | 11.25 0.07 | BB′B′′ |
| 22023+5249 | 6.23 0.01 | 7.69 0.03 | 8.55 0.09 | 11.23 0.07 | BA′A′′ |
| 22495+5134 | 6.25 0.01 | 7.58 0.02 | 8.5 0.1 | 11.45 0.05 | BA′A′′ |
| Target | I6.2 | I7.7 | I8.5 | I11.2 |
|---|---|---|---|---|
| IRAS ID | W m-2 | W m-2 | W m-2 | W m-2 |
| 01005+7910 | 24 1 | 38 2 | 9 1 | 29 3 |
| 09470-4617 | 11.5 0.6 | 19 1 | 2.6 0.5 | 14 1 |
| 18442-1144 | 4.34 0.05 | 8.2 0.3 | 2.2 0.2 | 2.41 0.04 |
| 19200+3457 | 1.77 0.05 | 3.3 0.1 | 0.64 0.06 | 1.10 0.03 |
| 18371-3159 | 0.12 0.02 | 0.25 0.05 | 0.04 0.01 | 0.13 0.05 |
| 18379-1707 | 4.0 0.2 | 5.6 0.4 | 0.5 0.1 | 1.1 0.3 |
| 19306+1407 | 3.98 0.03 | 8.6 0.4 | 0.2 0.1 | 4.9 0.8 |
| 19336-0400 | 0.17 0.03 | 0.74 0.05 | 0.06 0.01 | 0.33 0.04 |
| 19590-1249 | 0.17 0.05 | 0.37 0.05 | 0.03 0.01 | 0.18 0.06 |
| 20462+3416 | 0.49 0.02 | 1.5 0.1 | 0.14 0.03 | 0.28 0.07 |
| 21289+5815 | 1.20 0.02 | 2.2 0.2 | 0.18 0.05 | 0.35 0.07 |
| 22023+5249 | 2.4 0.1 | 4.7 0.2 | 0.6 0.1 | 1.0 0.2 |
| 22495+5134 | 0.31 0.04 | 0.52 0.04 | 0.13 0.03 | 0.6 0.06 |
Peeters et al., (2002) propose that objects in class B contain “fresh” PAH molecules, since the post-AGB stars and PNe they observed fall in this class. Class A objects, which include PDRs and reflection nebulae (ISM-like PAHs), are sources with more processed PAHs.
In the attempt to characterize the PAH population in our targets, we have followed Keller et al, (2008) in their inspection of PAH features in Herbig AeBe stars. We fit a spline to the continuum in the 5–14 m region of the spectra, including in the spline the 10 m bump from amorphous silicates, when present. The continuum-subtracted spectra are shown in Figure 11. We notice that despite the spline subtraction, which should remove the 10 m silicate feature, residual emission in the 9–11 m range remains. As noted above, these features may be due to hot crystalline silicates.

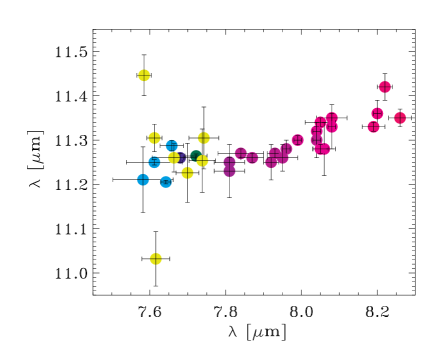
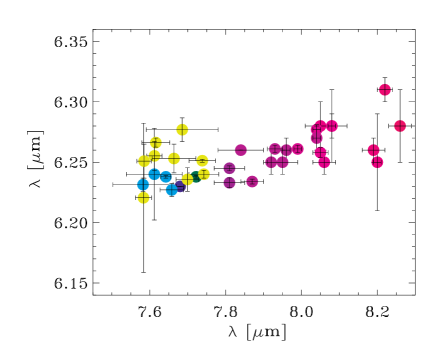
After calculating the central wavelengths as in their study, we compare our results to Keller et al, (2008), who found a correlation between the effective temperature of the central star and the central wavelength of both the 11.2 and the 7.7 m features. Although the astrophysical targets are quite different (young and post-AGB stars), the properties of the PAHs can be compared to determine how these molecules behave in different environments. In Figure 12, we show the correlation between the central wavelengths of the features at 6.2, 7.7, and 11.2 m. A trend with increasing temperature from red to blue wavelengths is clear. With the exception of two outliers (22495+5134 in the top and 18379-1707 in the bottom of the 7.7 vs 11.2 m plot), our data follow the trend in Keller et al, (2008), being located at the high-temperature limit, as expected for stars with an ionized envelope (T 20000 K). Although the plots show a clear correlation, the position occupied by the hot PN NGC 7027 (T K) - shown as a dark green dot just as an example of hot PN - points out that other factors play an important role.
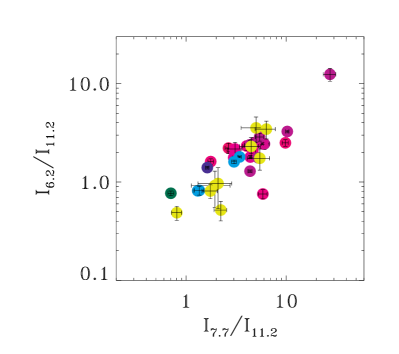
This complicated dependence is evident when inspecting the PAH ionization fraction. Since the intensity of the features in the 6–9 m range relative to that of the 11.2 m one is an order of magnitude higher for ionized than for neutral PAHs (Galliano et al.,, 2008), in Figure 13 we plot II11.2 vs II11.2 ratios. While Keller et al, (2008) could not conclude that a correlation was present in this diagram, the inclusion of our sample allows us to find a remarkable correlation, but no clear link between the ionization fraction and Teff. Our sample of post-AGB stars contains hotter stars than the HAeBe stars in Keller et al, (2008) (Figure 12 and the presence of radio continuum) but it has a somewhat lower fraction of ionized PAHs. This trend for a decrease of ionization fraction in the post-AGB has been reported in Molster et al., (1996) for 3 objects. We find this as a general trend within our sample.
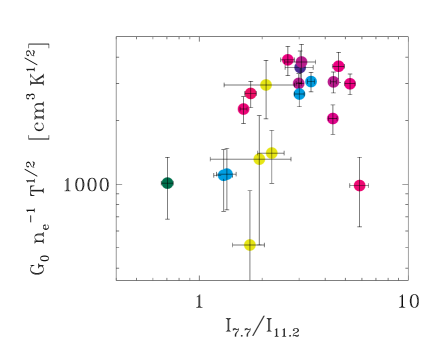
Since the ionization fraction does not seem to correlate with the temperature of the central star, we tried to link it to the local physical conditions experienced by the PAHs, by plotting the II11.2 ratio versus the ionization factor G0neT0.5, where G0 is the radiation field in Habing units, ne the electron density in cm-3, and T the gas temperature in 103 K. We have calculated this parameter by applying the empirical formula in Galliano et al., (2008) that links it to II11.2 in its Lorentzian formulation, since it extends to lower values of II11.2. In Figure 13, we show the result for G0neT (limits of reliability of the formula). Although the data are spread in the plot, a weak correlation can be identified, indicating that the ionization fraction increases with the ionization factor. Once again, no clear correlation with Teff is observed, indicating that the local conditions in the envelope play a major role.
The results of our analysis of the PAH features are somewhat conflicting. On one side we see that the central wavelengths of the features are shifted toward the blue, as expected in photo-processed molecules; on the other side, we find a low ionization fraction, which implies low processing.
We conclude that a higher effective temperature implies a harder field and stronger processing in terms of shift of the central wavelength toward the blue, but not necessarily a higher ionization fraction, this being dependent on the available amount of ionizing photons, thefore on the distance to the central star. Our plots indicate that the PAH molecules in our stars are located in the outflows, where they are subject to a more diluted field. Although the probability of interaction between photons and molecules far from the star is smaller, the hard photons from the central star - when interacting - determine a major damage to the molecules, resulting in the shift in central wavelength. In this scenario, the closer molecules must have been previously destroyed by the radiation field. Since PAH features with red central wavelengths are found in post-AGB stars (RAFGL 2688 is one of the two class C objects in Peeters et al., (2002)), this disruption should occur during the few 103 yr between the early post-AGB and the development of an ionized shell. High-angular resolution observations in the PAH emission ranges are necessary to support such an interpretation, which confirms the idea of C-bearing molecules being located in the outflows of mixed-chemistry nebulae. Finally, it must be noticed that the wavelength shifts observed can be determined not only by photo-processing: nitrogenation can in fact be another explanation (Tielens,, 2008).
3.3.1 Abundance estimate
As shown in Allamandola et al., (1989), the mass that goes into PAHs can be linked to the ratio of the flux emitted in the PAH features to the continuum flux in the far infrared range (FIR), nominally between 40 and 500 m. We have therefore taken advantage of our SED models (see § 4) to calculate the FIR flux by integrating our curves in the mentioned interval.
The fraction of carbon trapped in PAHs can be estimated as (Allamandola et al.,, 1989)
| (1) |
where is the average UV absorption cross section of PAHs per C atom and is the PAH to continuum flux ratio. We assume cm-2 as a typical value for (Tielens,, 2005).
The fraction of C in PAHs can then be estimated as:
| (2) |
Table 4 lists the results of the calculation, along with the estimates of the number abundance of PAH molecules to H nuclei, assuming that the average PAH molecule has 50 C atoms. The errors in the table have been calculated by standard error propagation, including a 15% uncertainty in the model estimation of the underlying continuum.
| Target | fC | NNH | ||
|---|---|---|---|---|
| IRAS ID | 10-2 | 10-2 | 10-8 | 10-8 |
| C-rich | ||||
| 01005+7910 | 6 | 2 | 51 | 19 |
| 09470-4617 | 43 | 37 | 336 | 293 |
| 18442-1144 | 1.0 | 0.3 | 8 | 2 |
| 19200+3457 | 2.7 | 0.9 | 21 | 7 |
| Mixed | ||||
| 18371-3159 | 0.07 | 0.02 | 0.55 | 0.18 |
| 18379-1707 | 1.1 | 0.4 | 8.7 | 2.8 |
| 19306+1407 | 0.48 | 0.15 | 3.7 | 1.1 |
| 19336-0400 | 0.12 | 0.04 | 0.9 | 0.3 |
| 19590-1249 | 0.10 | 0.03 | 0.7 | 0.2 |
| 20462+3416 | 0.12 | 0.03 | 0.9 | 0.3 |
| 21289+5815 | 5.2 | 1.9 | 41 | 15 |
| 22023+5249 | 0.5 | 0.1 | 3.8 | 1.2 |
| 22495+5134 | 0.12 | 0.04 | 1.0 | 0.3 |
Note. — Columns 3 and 5 list the errors associated to fC and NNH calculated including a 15% uncertainty in the estimate of the underlying continuum.
The results show a trend for larger values of and PAH abundance in C-rich stars. In these sources, the values of C fraction range from 1% to 43% (3% is a typical value in the ISM), while those of the PAH abundance are between 7 and 336. With the remarkable exception of IRAS 21289+5815, stars with both PAH and silicate features show lower values: 0.1–1% for and 0.5–8 for the PAH abundance. We notice here that since in our modeling we lack observations in the sub-mm and mm ranges, our estimation of the FIR flux and the values derived from it should be taken with caution.
4. Modeling the Spectral Energy Distribution
To model our targets, we have collected data from the 2MASS (Skrutskie et al,, 2006) and IRAS archives. We have dereddened the 2MASS magnitudes following Schlegel et al., (1998). The intrinsic B-V color indexes have been estimated from Lang, (1999) on the basis of the spectral classifications of the targets, then the magnitude correction was calculated with the derived color excess.
We have used the DUSTY code (Ivezić et al.,, 1999) to solve the problem of radiation transfer in the dust envelopes of our targets.
Our typical first cycle of DUSTY had the following input:
-
-
central source: blackbody curve with temperature matching the spectral type of the target;
-
-
chemistry of the envelope: either 100% silicates or 100% amorphous carbon, depending on IRS features;
-
-
grain size distribution: power law , , , being the grain radius in m;
-
-
density distribution: power law , being the shell radius;
-
-
shell relative thickness: ;
-
-
dust temperature at : adapted to each SED;
-
-
optical depth at 60 m: calculated for each star from IRAS data;
We calculated the opacity at 60 m for each object as
| (3) |
where is the dust temperature, the angular radius of the nebula in arcsec, the flux density at the frequency in erg cm-2 s-1 Hz-1, the Planck function at the temperature in erg cm-2 s-1 Hz-1 sr-1 (Gathier et al.,, 1986). This gives us a first estimate of the opacity, based on the 5′′ upper limit to the envelope sizes derived from our IRAC images. This value of opacity was used in the first cycle of DUSTY and then changed in the following cycles to better match the data.
In several targets we have found that it is not possible to model the SED with only one dust component. DUSTY does not allow the user to include in the model several dust shells at the same time, but it is possible to use the output of a run as an input to a second run, thus approximately reproducing a multi-shell structure. We have successfully applied this technique to the sources that clearly showed a near-IR excess of radiation, pointing out the presence of hot dust. A summary of the input parameters used in our modeling is given in Table 5.
| Target | T⋆aaT⋆ is the blackbody temperature used for the central source. | ChemistrybbSil-Ow, Sil-Oc, Sil-DL, and am-C indicate respectively Ossenkopf warm silicates, Ossenkopf cold silicates, Draine-Lee silicates, and amorphous carbon. See Ivezić et al., (1999) for references. | Grain sizeccMinimum and maximum grain radii used in modeling. | Tdust | RRin | |
|---|---|---|---|---|---|---|
| K | m | K | ||||
| C-rich spectra | ||||||
| 01005+7910 | 20300 | am-C | 0.005–0.26 | 700 | 1000 | 0.16 |
| 0.005–2.5 | 145 | 20 | 7 | |||
| 06556+1623 | 20000 | Sil-Ow 15%, am-C 85% | 0.005–0.26 | 900 | 1000 | 0.61 |
| Sil-DL | 0.005–2 | 135 | 1000 | 3 | ||
| 09470-4617 | 20000 | am-C | 0.005–0.26 | 900 | 1000 | 0.2 |
| 220 | 20 | 2 | ||||
| 17423-1755 | 20000 | am-C | 0.005–100 | 1150 | 445 | 135 |
| 132 | 2 | 80 | ||||
| 80 | 2 | 100 | ||||
| 18442-1144 | 20000 | am-C | 0.005–0.26 | 280 | 2 | 0.4 |
| Sil-Oc | 110 | 1000 | 20 | |||
| 19200+3457 | 7000 | am-C | 0.005–0.26 | 380 | 1000 | 0.27 |
| am-C 80%, Sil-Oc 20% | 110 | 5 | 3.2 | |||
| O-rich spectra | ||||||
| 17074-1845 | 17100 | Sil-Ow | 0.005–0.26 | 320 | 5 | 0.15 |
| Sil-Oc | 120 | 5 | 4.3 | |||
| 17203-1534 | 20000 | Sil-Oc | 0.005–0.26 | 470 | 2 | 0.04 |
| Sil-Oc | 110 | 4 | 2.75 | |||
| 17364-1238 | 7500 | Sil-Ow 50%, am-C 50% | 0.005–0.26 | 450 | 2 | 0.27 |
| Sil-Oc | 100 | 2 | 20 | |||
| 17381-1616 | 24000 | Sil-Ow | 0.005–0.26 | 250 | 3 | 0.15 |
| Sil-Oc | 120 | 3 | 4 | |||
| 17460-3114 | 34700 | Sil-Ow | 0.005–0.26 | 500 | 1000 | 0.02 |
| Sil-Oc | 140 | 2 | 0.017 | |||
| 18062+2410 | 24000 | Sil-Ow | 0.005–0.26 | 320 | 2 | 0.32 |
| Sil-Oc | 160 | 2 | 4 | |||
| 18435-0052 | 3000 | Sil-Ow 95%, am-C 5% | 0.005–0.26 | 1300 | 1000 | 1400 |
| 19157-0247 | 24000 | am-C | 0.005–0.26 | 950 | 1000 | 0.32 |
| am-C 70%, Sil-Oc 30% | 330 | 0.17 | ||||
| 20572+4919 | 12000 | 70% Sil-DL, 30% am-C | 0.005–0.26 | 1300 | 1000 | 4.5 |
| 150 | 1000 | 3.75 | ||||
| Mixed spectra | ||||||
| 17542-0603 | 21000 | am-C | 0.005–0.26 | 1050 | 100 | 1 |
| Sil-Ow | 145 | 3 | 1.45 | |||
| 18371-3159 | 24000 | Sil-Ow 85%, am-C 15% | 0.005–0.26 | 350 | 2 | 0.05 |
| Sil-Oc | 105 | 5 | 2.4 | |||
| 18379-1707 | 24000 | Sil-Ow | 0.005–0.26 | 590 | 3 | 0.1 |
| Sil-Oc | 120 | 2 | 1.7 | |||
| 19306+1407 | 16000 | Sil-Ow 95%, am-C 5% | 0.005–0.26 | 440 | 10 | 1.5 |
| Sil-Oc | 120 | 2.5 | 30 | |||
| 19336-0400 | 24000 | Sil-Ow 85%, am-C 15% | 0.005–0.26 | 320 | 2 | 0.4 |
| Sil-Oc | 105 | 2 | 4.3 | |||
| 19590-1249 | 24000 | Sil-Ow 85%, am-C 15% | 0.005–0.26 | 300 | 2 | 0.035 |
| Sil-Oc | 100 | 2 | 1.5 | |||
| 20462+3416 | 24000 | Sil-Ow 80%, am-C 20% | 0.005–0.26 | 300 | 1000 | 0.034 |
| Sil-Oc | 100 | 1000 | 1.5 | |||
| 21289+5815 | 15000 | Sil-Ow | 0.005–0.26 | 1300 | 100 | 4.8 |
| Sil-Oc | 150 | 100 | 4.6 | |||
| 22023+5249 | 20000 | 90% Sil-Ow, 10% am-C | 0.005–0.26 | 440 | 3 | 0.25 |
| Sil-Oc | 105 | 2 | 6 | |||
| 22495+5134 | 20000 | 30% Sil-Ow, 70% am-C | 0.005–0.26 | 360 | 5 | 0.05 |
| Sil-Oc | 115 | 100 | 7 |
One of the issues encountered in fitting these data involves the actual shape of the 10 m bump. Our models, though often reproducing the overall shape of the SED quite well, fail in reproducing the correct shape of the 10 m bump especially in its longer wavelength part, where it overlaps with the underlying rising continuum. The shape of the feature depends on several factors, including dust temperature, grain size, and composition. Geometrical effects can also play a role, if different dust species are segregated in different regions of the envelopes.
Another issue concerned the fit of the near-IR emission. In several instances DUSTY underestimates the continuum in this range. This can point out the presence of additional hot dust, but another possibility is the presence of a free-free contribution from the ionized envelope, which is neglected in DUSTY. Our radio observations prove to be very useful then, since by modeling the radio emission we can check if the hypothesis of a free-free contribution in the near-IR is valid or not.
We have modeled the radio continuum spectra assuming the central star is surrounded by a shell of ionized gas with constant density. The usual approximation of the Gaunt factor at radio wavelengths typically results into a quick cutoff of the free-free emission in the far-IR, where, compared to the dust emission, such contribution is indeed negligible. Nevertheless, in the near-IR, where the central star and dust fluxes are at a minimum, the free-free contribution to the observed flux may not be much smaller than the contributions from the other emitting components. For example, in the evolved PN IC 4406 a near-IR excess, previously supposed to indicate a hot-dust component, has been explained as a free-free contribution (Cerrigone et al., 2008b, ). Therefore, we decided to estimate the Gaunt factor following Karzas & Latter, (1961) for a 104 K electron temperature, extending the calculation of the emission curve from the cm range to 0.8 m. For details about the radio modeling, see Cerrigone et al., 2008a .
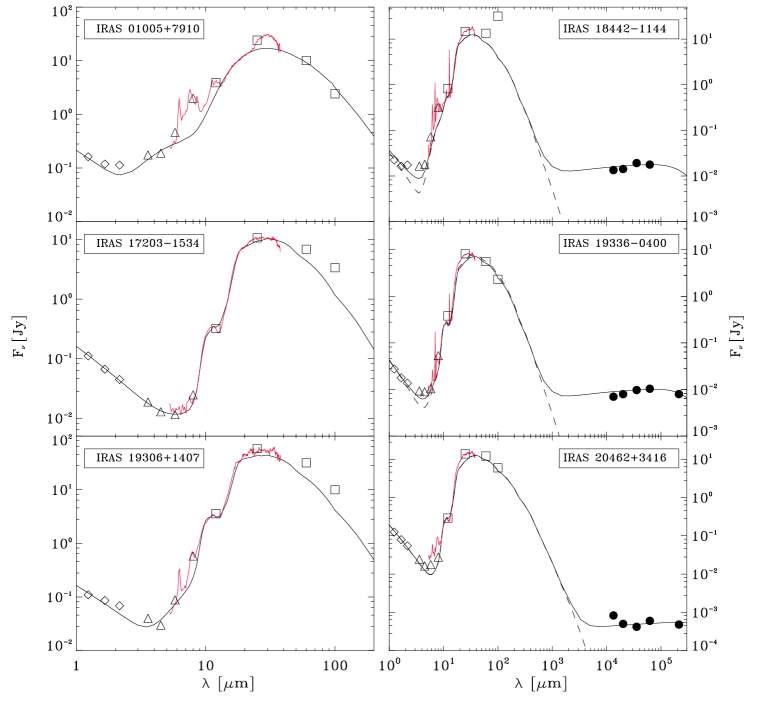
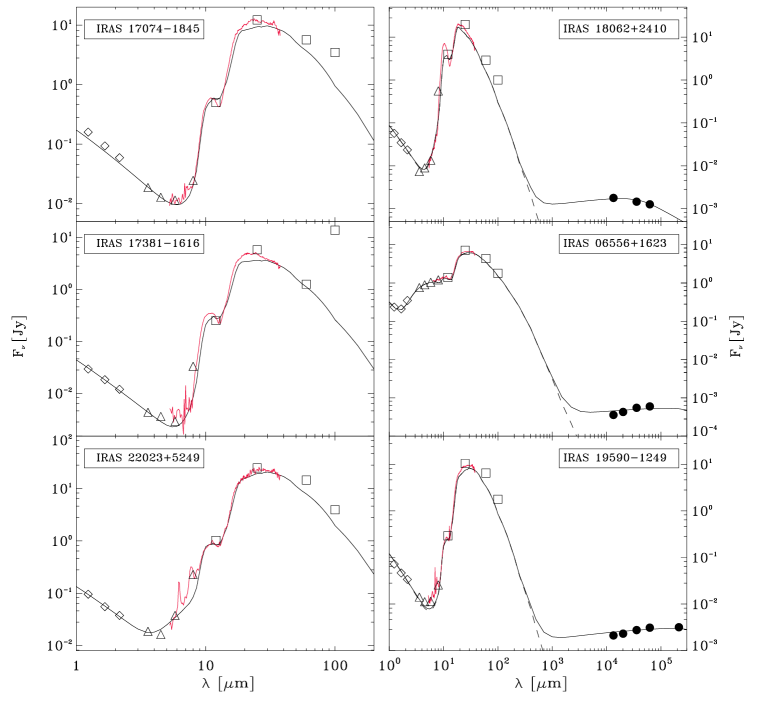
Where radio data were available, we summed up the free-free and dust model contributions. This often results into a substantial correction to the dust-only model, not only in the cm range, as expected, but also in the near-IR. In Figures 14 and 15 we show examples of the performed DUSTY and radio fits for about half of our sample.
During the various trials performed to match the data, we have found that in some sources it is necessary to add an extra-component that does not match chemically with the classification of the target. Specifically, in half of the O-rich targets (IRAS 17364-1238, 17542-0603, 18435-0052, 19157-0247, 20572+4919) we had to include an am-C component to match the observational points. Similarly, in two of the C-rich sources (IRAS 06556+1623 and 19200+3457) we had to include a silicate component. It must be considered that this may be due to limits in the modeling code, in particular the current knowledge of the opacity coefficients in the mid-IR, and does not necessarily represent a mixed-chemistry nature of the targets. IRAS 17423-1755 has been modeled with amorphous carbon grains, although it does not show any PAH features. This target is reported to show C2H2 absorption feature (Gauba & Parthasarathy,, 2004), which indicates it has a C-rich chemistry. Such a chemistry also matches with its featureless mid-IR spectrum. In our attempts to model it with silicates, we have found that if silicates were present they would determine a distinct 10-m emission feature, because of their high temperature (peak in IRAC bands). In two targets showing both PAH and silicate features (IRAS 18379-1707 and 21289+5815) a silicate-only chemistry is sufficient to fit the continuum spectrum.
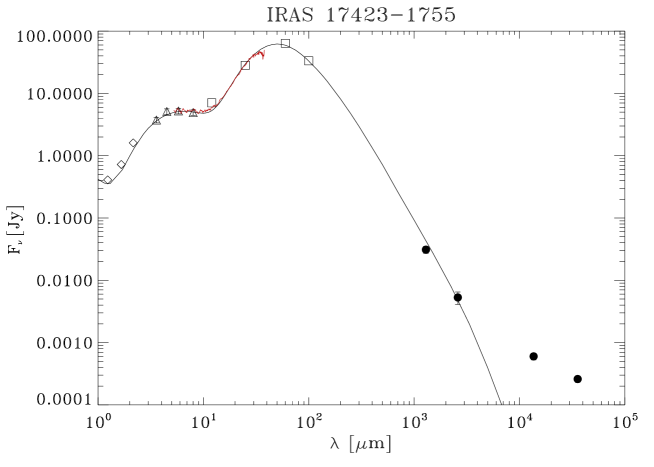
IRAS 17423-1755 is our only target with mm measurements (Huggins et al.,, 2004). We have assumed as size of the dust region the angular size of its CO shell as reported in Huggins et al., (2004), 2′′, with a distance of 5.8 kpc and luminosity 12600 L⊙. When using in DUSTY the opacity calculated at 60 m from the IRAS data, we find that the model highly overestimates the far-IR emission. Changes in the opacity input value do not improve the model, nor do different density distributions (we tried r-1 and r-3). A good match can be obtained if a maximum grain size of 100 m is introduced (Figure 16). This is remarkable, since hints for such large grains have been found so far only in a handful of stars, such as the Red Rectangle (Jura et al.,, 2001). It is interesting to notice that in another target, IRAS 20462+3416, our point at 1 cm seems not to follow the free-free curve, being well above it (see Figure 14). If we combine this to the shape given by the IRAS long-wavelength data points, we can speculate that this target might have an excess of radiation in the sub-mm as well.
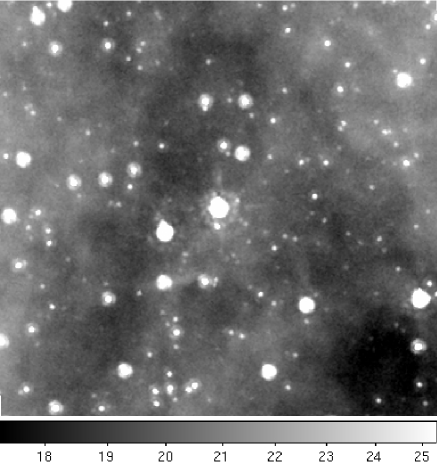
We could not classify IRAS 18367-1233 because the IRAS coordinates turned out to be off-set respect to the actual position of the target, as we can see in our IRAC images. Since the IRAC imaging was not available at the time of the IRS observations, the target resulted to be out of the IRS slits.
4.1. Circumstellar mass calculation
Modeling our sources allows us to estimate the mass of the envelopes of our targets. We follow here the procedure in Sarkar & Sahai, (2006). The mass is estimated as
| (4) |
In Eq. 4 is the inner radius of the envelope, is the outer-to-inner radius ratio, and are the optical depth and the absorption coefficient at 100 m, and is the dust-to-gas mass ratio. No distance information is available for most of our targets, therefore we assume as a typical value of 1016 cm. is the value given as input in DUSTY and is given by the code as an output. For , whose value depends on the evolutionary stage, we consider a typical value of 200. depends on the chemistry of the envelope: we use 92 g cm-2 for amorphous carbon (Cerrigone et al., 2008b, ) and 34 g cm-2 for silicates (Sarkar & Sahai,, 2006). We have used the values for silicates not only in the targets that we have classified as O-rich, but also in mixed-chemistry environments, neglecting any contribution from C-bearing molecules. As already noticed by Sarkar & Sahai, (2006), the code seems to underestimate the amount of cold dust in the envelope or anyhow not to be very sensitive to the contribution from such grains. If we also consider that we lack measurements in the sub-mm/mm range - which would help constrain the cold-dust emission - the values listed in Table 6 are to be regarded as lower limits to the circumstellar mass.
| Target | M |
|---|---|
| 10-3M⊙ | |
| C-rich spectra | |
| 01005+7910 | 20 |
| 06556+1623 | 300 |
| 09470-4617 | 5 |
| 17423-1755 | 100 |
| 18442-1144 | 7 |
| 19200+3457 | 0.7 |
| O-rich spectra | |
| 17074-1845 | 20 |
| 17203-1534 | 700 |
| 17364-1238 | 100 |
| 17381-1616 | 2 |
| 17460-3114 | 0.008 |
| 18062+2410 | 3 |
| 18435-0052 | 700 |
| 19157-0247 | 5 |
| 20572+4919 | 4 |
| Mixed spectra | |
| 17542-0603 | 2 |
| 18371-3159 | 10 |
| 18379-1707 | 400 |
| 19306+1407 | 100 |
| 19336-0400 | 5 |
| 19590-1249 | 1 |
| 20462+3416 | 0.7 |
| 21289+5815 | 3 |
| 22023+5249 | 3 |
| 22495+5134 | 200 |
Note. — These values can be considered as lower limits, since the amount of cold dust may be underestimated.
5. Sources with unclassified spectra
For IRAS 18040-1457, 18070-2346, and 19399+2312 the IRAS measurements must evidently include emission from nearby dust, since in our IRAC images we clearly detect a diffuse nebulosity around these targets (see as an example Figure 17). These sources have quite different IRS spectra, compared to the other targets (Figure 18). Since IRAS data are likely contaminated by ambient dust, the location of these targets in the IRAS color-color diagram is probably wrong, therefore their classification as post-AGB candidates appears dubious. In IRAS 18070-2346, the 18 m silicate feature is detected, although it might be due to the interstellar medium or diffuse nebulosity. IRAS 19399+2312 shows an emission feature around 11.2 m that can be attributed to neutral PAH molecules.

6. Conclusions
The number density of post-AGB/proto-PN is estimated to be around 0.4 kpc-2. As a comparison, the density of AGB stars is 15 kpc-2 and of Main Sequence stars is 2 kpc-2 (Woods et al.,, 2005). Knowledge about this phase is mostly derived from a handful of objects, such as the C-rich source RAFGL 618 and the O-rich object OH231.8+4.2. Because of the paucity of known TO, the identification and study of new TO is very important for testing models of stellar evolution.
Among TO candidates, we have selected hot targets (B spectral type), therefore searching for recently-ionized or close-to-ionize envelopes. 2MASS and IRAS data were combined with our IRAC and radio observations to construct the SEDs of the sample stars. DUSTY modeling shows the presence of more than one emitting component in the dust envelopes and indicates that dust temperatures range from 1000 K to 100 K. The modeling also gives hints about the presence of large ( 1 m) grains, although sub-mm and mm observations are necessary to constrain the SEDs in these ranges, where such grains would give a major contribution. As an example, in IRAS 17423-1755 it is necessary, to account for its mm emission, to have three dust components (at 1150, 132, and 80 K) with grain size up to 100 m (see Fig 16).
The IRS spectra we obtained allow us to classify the TO candidates as C-rich, O-rich, or mixed-chemistry. We have classified as mixed-chemistry objects those stars with both a 10 m silicate bump and PAH features in the 6–11 m range. A possible explanation for the mixed chemistry involves the presence of a circumbinary disk/torus, where O-bearing molecules would be preserved from the third dredge up, while elsewhere in the outflow features from C-bearing molecules would arise. This picture appears to be confirmed by our analysis of the PAH features, which indicates that PAH molecules in our targets are not located close to the central star. Since these objects are typically compact (2′′), sub-arcsec imaging may evidence if different dust species have different spatial distributions.
In most of our targets with O-rich dust, the 10 m silicate emission feature often appears with a structured shape and/or a peak shift to larger wavelengths. Our analysis of the shape and strength of this feature indicates a high degree of dust processing. Such processing, which typically consists in dust growth and crystallization, indicates again the presence of large dust grains and/or of crystalline silicates and more interestingly is a further hint for the presence of a circumstellar/circumbinary disk: a stable structure where the grains can have the time to grow and crystallize.
Whereas the expected fraction of mixed-chemistry envelopes is less than 10%, we find that about 40% of the stars in our sample show both PAH and silicate features. Our sample has been selected on the basis of B optical spectral type and far-IR excess. These two conditions are indeed typical of hot post-AGB stars. Nevertheless, selections based on infrared thermal emission (IRAS fluxes, for instance) introduce a bias towards far-IR bright objects. Among post-AGB stars, objects hosting a disk or torus are stronger IR emitters. These circumstellar (or circumbinary) structures are highly stable and store the dust around the central star/s on a much longer time-scale than in stellar envelopes without a disk/torus (van Winckel,, 2003). As these envelopes are brighter and live longer, selections based on far-IR emission are biased towards stars surrounded by a disk or torus. The higher percentage of mixed-chemistry envelopes in our sample can therefore be connected to a higher percentage of disks (or tori). This confirms the general picture of a disk/torus as a reservoir preserving O-bearing molecules from the third dredge up.
If we refer to the Red Rectangle as an example, mixed chemistry and large grains are linked together by the presence of a disk, where the particles can survive enough orbits to grow by coagulation to sizes as large as 1 mm (Jura et al.,, 1997). With only a few examples of this phenomenon, several hints for it found in this project provide us with candidate targets to test the current understanding of dust processing in PN envelopes.
Facilities: Spitzer (IRAC, IRS)
References
- Allamandola et al., (1989) Allamandola, L. G., Tielens, A. G. G. M. & Barker, J. R., 1989, ApJS, 71, 733
- Apai et al., (2005) Apai, D., Pascucci, I., Bouwman, J., Natta, A., Henning, T. & Dullemond, C. P., 2005, Science, 310, 834
- van Boeckel et al., (2003) van Boeckel, R., Waters, L. B. F. M., Dominik, C., Bouwman, J., de Koter, A., Dullemond, C. P. & Paresce, F., 2003, A&A, 400, L21
- Bogdanov, (2003) Bogdanov, M. B., 2003, Astr. Rep., 47, 480
- Bouwman et al., (2001) Bouwman, J., Meeus, G., de Koter, A., Hony, S., Dominik, C. & Waters, L. B. F. M., A&A, 375, 950
- (6) Cerrigone, L., Umana, G., Trigilio, C., Leto, P., Buemi, C. & Hora, J. L., 2008a, MNRAS, 390, 363
- (7) Cerrigone, L., Hora, J. L., Umana, G. & Trigilio, C., 2008b, ApJ, 682, 1047
- De Frees et al., (1993) De Frees, D. J., Miller, M. D., Talbi, D., Pauzat, F. & Ellinger, Y., 1993, ApJ, 408, 530
- Fazio et al., (2004) Fazio, G. et al., 2004, ApJS, 154(1), 10
- Galliano et al., (2008) Galliano, F., Madden, S. C., Tielens, A. G. G. M., Peeters, E. & Jones, A. P., 2008, ApJ, 679, 310
- García-Lario & Perea Calderon, (2003) García-Lario, P. & Perea Calderón, J. V., 2003, ESASP, 511, 97
- Gathier et al., (1986) Gathier, G. A., Pottasch, S. R. & Pel, J. W., 1986, A&A, 157, 171
- Gathier & Pottasch, (1988) Gathier, R. & Pottasch, S. R., 1988, A&A, 197, 266
- Gauba & Parthasarathy, (2004) Gauba, G. & Parthasarathy, M., 2004, A&A, 417, 201
- Gielen et al, (2008) Gielen, C., van Winckel, H., Min, M., Waters, L. B. F. M. & Lloyd Evans, T., 2008, A&A, 490, 725
- Higdon et al., (2004) Higdon, S. J. U. et al., 2004, PASP, 116, 975
- Hiriart & Kwan, (2000) Hiriart, D. & Kwan, J., 2000, ApJ, 532, 1006
- Hora et al., (2004) Hora, J. L., Latter, W. B., Allen, L. E., Marengo, M., Deutsch, L. K. & Pipher, J. L., 2004, ApJS, 154(1), 296
- Hora et al., (2008) Hora, J. L. et al., 2008, AJ, 135, 726
- Houck et al., (2004) Houck, J. et al. 2004, ApJS, 154, 18
- Huggins et al., (2004) Huggins, P. J., Muthu, C., Bachiller, R., Forveille, T. & Cox, P., 2004, A&A, 414, 581
- Ivezić et al., (1999) Ivezić, Ž., Nenkova, M. & Elitzur, M., 1999, User manual for DUSTY, University of Kentucky Internal Report, accessible at http://www.pa.uky.edu/moshe/dusty
- Joblin et al., (2008) Joblin, C., Szczerba, R., Berné & Szysszka, C., A&A, 2008, 490, 189
- Jura et al., (1997) Jura, M., Turner, J. and Balm, S. P., 1997, ApJ, 474, 741
- Jura et al., (2001) Jura, M., Webb, R. A. & Kahane, C., 2001, ApJ, 550, L71
- Justanott et al., (1992) Justtanont, K., Barlow, M. J., Skinner, C. J. & Tielens, A. G. G. M., 1992, ApJ, 392, L75
- Karzas & Latter, (1961) Karzas, W. J. & Latter, R., 1961, ApJ, 6, 167
- Keller et al, (2008) Keller et al., 2008, ApJ, 684, 411
- Knapp et al., (1995) Knapp, G. R., Bowers, P. F., Young, K. & Phillips, T. G., 1995, ApJ, 455, 293
- Lang, (1999) Lang, K. R., Astrophysical Formulae, Springer, 1999
- Latter et al., (1995) Latter, W. B., Kelly, D. M., Hora, J. L. & Deutsch, L. K., 1995, ApJS, 100, 159L
- Marengo et al., (2007) Marengo, M., Hora, J. L., Barmby, P., Willner, S. P., Allen, L. E., Schuster, M. T. & Fazio, G., 2007, ASPC, 378, 80
- Marengo et al., (2006) Marengo, M. et al. 2006, ApJ, 647, 1437
- Molster et al., (1996) Molster, F. J et al., 1996, A&A, 315, L373
- Molster et al., (1999) Molster, F. J et al., 1999, Nature, 401, 563
- Molster et al., (2001) Molster, F. J. et al., 2001, A&A, 372, 165
- Molster et al., (2002) Molster, F. J., Waters, L. B. F. M. & Tielens, A. G. G. M., 2002, A&A, 382, 222
- Molster & Waters, (2003) Molster, F. J. & Waters, L. B. F. M., 2003, LNP, 609, 121
- Parthasarathy & Pottasch, (1989) Parthasarathy, M. & Pottasch, S. R., 1989, A&A, 225, 521
- Parthsarathy et al., (2000) Parthasarathy, M., Vijapurkar, J. & Drilling, J. S., 2000, A&AS, 145, 269
- Peeters et al., (2002) Peeters, E., Hony, S., Van Kerchoven, C., Tielens, A. G. G. M., Allamandola, L. J., Hudgins, D. M. & Bauschlicher, C. W., 2002, A&A, 390, 1089
- Pottasch et al., (1988) Pottasch, S. R., Olling, R., Bignell, C. & Zijlstra, A. A., 1988, A&A, 205, 248
- Phillips & Ramos Larios, (2008) Phillips, J. P. & Ramos Larios, G., 2008, MNRAS, 386, 995
- Przygodda et al., (2003) Przygodda, F., van Boeckel, R., Àbrahàm, P., Melnikov, S. Y., Waters, L. B. F. M. & Leinert, Ch., 2003, A&A, 412, L43
- Sarkar & Sahai, (2006) Sarkar, G. & Sahai, R., 2006, ApJ, 644, 1171
- Salaris & Cassisi, (2005) Salaris, M. & Cassisi, 2005, S., Evolution of stars & stellar populations (John Wiley & Sons)
- Schlegel et al., (1998) Schlegel, D. J., Finkbeiner, D. P. & Davis, M., 1998, ApJ, 500, 525
- Schuster et al., (2006) Schuster, M.T., Marengo, M., & Patten, B.M. 2006, SPIE Meeting, Orlando, 6720
- Skrutskie et al, (2006) Skrutskie, M. F., et al., 2006, AJ, 131, 1163
- Suárez et al., (2006) Suárez, O., García-Lario, P., Manchado, A., Manteiga, M., Ulla, A. & Pottasch, S. R., 2006, A&A, 458(1), 173
- Tielens, (2008) Tielens, A. G. G. M., 2008, ARA&A, 46, 289
- Tielens, (2005) Tielens, A. G. G. M., 2005, The Physics and Chemistry of the Interstellar Medium, Cambridge, Cambridge University Press
- Umana et al., (2004) Umana, G., Cerrigone, L., Trigilio, C., & Zappalà, R. A., 2004, A&A, 428, 121
- van der Veen et al., (1989) van der Veen, W. E. C. J., Habing, H. J. & Geballe, T. R., 1989, A&A, 226, 108
- van Winckel, (2003) van Winckel, H., 2003, ARA&A, 41, 391
- Volk, (2003) Volk, K., 2003, in IAU Symp. 209, Planetary Nebulae: Their Evolution & Role in the Universe, ed. Kwok, S., Dopita, M. & Sutherland, R., 281
- (57) Waters et al., 1998, Nature, 391, 868
- Woods et al., (2005) Woods, P. M., Nyman, L. Å., Schöier, F. L., Zijlstra, A. A., Millar, T. J. & Olofsson, H., 2005, A&A, 429, 977