Fe implanted ZnO: magnetic precipitates versus dilution
Abstract
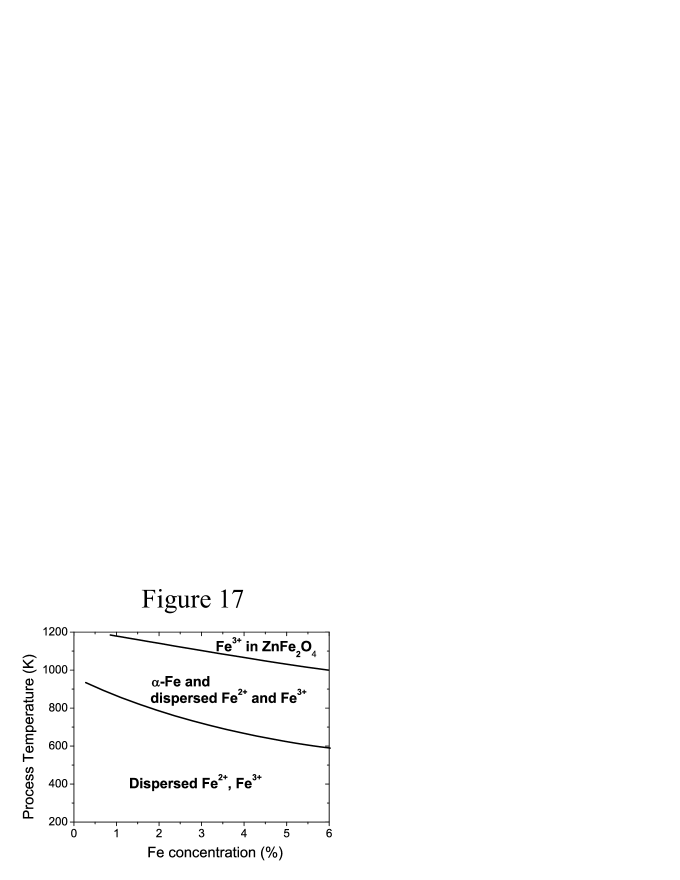
Nowadays ferromagnetism is often found in potential diluted magnetic semiconductor systems. However, many authors argue that the observed ferromagnetism stems from ferromagnetic precipitates or spinodal decomposition rather than from carrier mediated magnetic impurities, as required for a diluted magnetic semiconductor. In the present paper we answer this question for Fe-implanted ZnO single crystals comprehensively. Different implantation fluences and temperatures and post-implantation annealing temperatures have been chosen in order to evaluate the structural and magnetic properties over a wide range of parameters. Three different regimes with respect to the Fe concentration and the process temperature are found: 1) Disperse Fe2+ and Fe3+ at low Fe concentrations and low processing temperatures, 2) FeZn2O4 at very high processing temperatures and 3) an intermediate regime with a co-existence of metallic Fe (Fe0) and ionic Fe (Fe2+ and Fe3+). Ferromagnetism is only observed in the latter two cases, where inverted ZnFe2O4 and -Fe nanocrystals are the origin of the observed ferromagnetic behavior, respectively. The ionic Fe in the last case could contribute to a carrier mediated coupling. However, their separation is too large to couple ferromagnetically due to the lack of p-type carrier. For comparison investigations of Fe-implanted epitaxial ZnO thin films are presented.
I Introduction
Recently, considerable interest has been paid to ”spintronics”, where the spin degree of freedom of the electron carries information in the device. One of the material systems to realize this function are diluted magnetic semiconductors (DMS). In DMS materials, transition or rare earth metal ions are substituted onto cation sites and are coupled with the free carriers to yield ferromagnetism via indirect interaction. In 2000, Dietl et al. Dietl et al. (2000) proposed the mean-field Zener model to understand the ferromagnetism in DMS materials. It has been successfully used to describe the magnetic coupling in (Ga,Mn)As and (Zn,Mn)Te materials. This model predicts that wide bandgap semiconductors (GaN and ZnO) doped with Mn exhibit ordering temperatures above 300 K, provided that a sufficiently large hole density can be achieved (1020 cm-3). Sato et al. used the Korringa-Kohn-Rostoker Green function method based on the local density approximation of density functional theory to calculate the properties of n-type ZnO doped with the 3 TM ions (V, Cr, Mn, Fe, Co, and Ni) Sato and Katayama-Yoshida (2001). The ferromagnetic state, with a TC of around 2000 K, is predicted to be favourable for V, Cr, Fe, Co, and Ni in ZnO while Mn-doped ZnO is antiferromagnetic. These predictions have largely boosted intensive experimental activity on transition metal doped GaN and ZnO. A large number of research groups reported the experimental observation of ferromagnetism in TM (from Sc to Ni) doped ZnO Angadi et al. (2006)Heo et al. (2004)Hong et al. (2005a)Hong et al. (2005b)Ip et al. (2003)Jung et al. (2002)Polyakov et al. (2004)Tuan et al. (2004)Venkatesan et al. (2004) fabricated by various methods including ion implantation. In contrast to these results, other groups reported the observations of antiferromagnetism Bouloudenine et al. (2005)Yin et al. (2006)Sati et al. (2007), spin-glass behavior Fukumura et al. (2001)Jin et al. (2001), and paramagnetism Yin et al. (2006)Rao and Deepak (2005)Zhang et al. (2006) in TM-doped ZnO. Recently it was also found that nanoscale precipitates can substantially contribute to the ferromagnetic properties Norton et al. (2003)Park et al. (2004)Kundaliya et al. (2004)Shim et al. (2005)Potzger et al. (2006)Shinagawa et al. (2006)Talut et al. (2006)Zhou et al. (2006)Zhou et al. (2007a). One method to introduce magnetic dopants into ZnO is ion implantation. It has several advantages, namely the reproducibility, the precise control of the ion fluence, the use of an isotopically pure beam, and the possibility to overcome the solubility limit. The major drawback of ion implantation is the generation of structural defects in the host lattice. However, in several studies it has been demonstrated that ZnO exhibits a high amorphization threshold. Therefore ion implantation is widely used to dope ZnO with transition metal ions. Ref. Hebard et al. (2004) gives a review on transition metal ion implantation into ZnO.
Hydrothermal growth is one of the major methods to fabricate high quality ZnO single crystals Ohshima et al. (2004)Izyumskaya et al. (2007). Hydrothermal grown ZnO single crystals have been widely used for photodiodes Endo et al. (2007), light emitters Gao et al. (2006), DMS Potzger et al. (2006)Li et al. (2006)Fenwick et al. (2007), and substrates for homoepitaxial growth of ZnO films Matsui et al. (2004).
The present paper is dedicated to a comprehensive investigation of the structural and magnetic properties of Fe implanted ZnO bulk crystals grown by the hydrothermal method. Different implantation parameters, i.e. ion fluence, ion energy, and implantation temperature, were varied. Three charge states or occupied sites, i.e. metallic Fe and monodispersed Fe2+ and Fe3+ and Fe3+ in Zn-ferrites, are identified. Metallic Fe nanocrystals (NCs) form after implantation at high fluence and high temperature. They are the major contribution to the measured ferromagnetism. The difference between ZnO single crystals and epitaxial thin films upon the same implantation, and the difference between the high (623 K) and the low (253 K) temperature implanted samples subject to the same annealing, will be discussed.
Actually the phase separation, namely MnAs precipitates, in (Ga,Mn)As (the most well understood DMS material), has been intensively investigated Matsukura et al. (2002). Ferromagnetic MnAs precipitates are epitaxially embedded inside the GaAs matrix, and exhibit interesting magneto-transport properties Wellmann et al. (1998)Yuldashev et al. (2001)Ramsteiner et al. (2002)Yokoyama et al. (2006). Sato and Katayama-Yoshida Sato et al. (2005)Katayama-Yoshida et al. (2007) calculated the chemical pair interaction between two magnetic impurities in DMS materials. A strong attractive interaction between magnetic impurities has been found, which accelerates the spinodal nano-decomposition under thermal non-equilibrium crystal growth conditions. Moreover the attractive interaction in (Ga,Mn)As is one order of magnitude weaker than that in (Ga,Mn)N (wide bandgap semiconductor). Therefore, phase separation in TM doped wide bandgap semiconductors is highly expected. In addition to those investigations of MnAs/GaAs hybrids, some interesting magneto-transport properties are demonstrated, e.g. anomalous hall effect, and giant magnetoresistance, for magnetic NCs embedded inside ZnS Liu et al. (2007) and Ge Jamet et al. (2006), respectively. Therefore, Fe NCs embedded inside ZnO, which are granular magnetic nano-precipitates inside a semiconductor (granular magnetic semiconductor, GMS), could have some potential applications in future nano-spintronics Katayama-Yoshida et al. (2007)Dietl and Ohno (2006).
The paper is organized as follows. First, all the experimental methods employed will be described. Then the results will be separated according to the physical phenomena as follows: lattice damage and recovering, the distribution of implanted Fe, the formation of precipitates (metallic Fe, or Zn-ferrites), the charge state of Fe, the ferromagnetic properties, and the Fe implanted epitaxial ZnO films. In the discussion part, we sketch a phase diagram of Fe in ZnO, and apply a model to explain the Fe nanocrystal aggregation. Moreover the reason for the absence of ferromagnetism in ionic Fe diluted ZnO is discussed.
II Experiments
Commercial ZnO bulk crystals were implanted with 57Fe ions at temperatures ranging from 253 K to 623 K with fluences from cm-2 to cm-2. The implantation energy was 180 keV, which results in a projected range of nm, and a maximum atomic concentration from 0.14% to 11% (TRIM code Ziegler et al. (1985)). For comparison, epitaxial ZnO thin films grown on Al2O3 by pulsed laser deposition were implanted with 57Fe at selected implantation parameters (623 K, cm-2). Three sample series are investigated and listed in Table 1.
The lattice damage induced by implantation was evaluated by Rutherford backscattering/channeling spectrometry (RBS/C). The RBS/C spectra were collected with a collimated 1.7 MeV He+ beam at a backscattering angle of 170∘. The sample was mounted on a three-axis goniometer with a precision of 0.01∘. The channeling spectra were collected by aligning the sample to make the impinging He+ beam parallel with the ZnO0001 axis. is the channeling minimum yield in RBS/C, which is the ratio of the backscattering yield at channeling condition to that for a random beam incidence Chu et al. (1978). Therefore, labels the lattice disordering degree upon implantation. An amorphous sample exhibits a of 100%, while a perfect single crystal corresponds to a of 1-2%.
The Fe distributions were investigated by secondary ion mass spectrometry (SIMS), using a Riber MIQ-256 system with oxygen primary ions of 6 kV and monitoring positive secondary ions. The depth scale was calibrated by measuring the sputtered crater via profilometry. The absolute concentration was determined by calculating the sensitivity factors from the low fluence implants.
Structural analysis was achieved both by synchrotron radiation x-ray diffraction (SR-XRD) and conventional XRD. SR-XRD was performed at the Rossendorf beamline (BM20) at the ESRF with an x-ray wavelength of 0.154 nm. 2- scans were used to identify crystalline precipitates.
Conversion electron Mössbauer spectroscopy (CEMS) in constant-acceleration mode at room temperature (RT) was used to investigate the Fe lattice sites, electronic configuration and corresponding magnetic hyperfine fields. The spectra were evaluated with Lorentzian lines using a least squares fit Brand (1987). All isomer shifts are given with respect to -Fe at RT.
The magnetic properties were measured with a superconducting quantum interference device (SQUID, Quantum Design MPMS) magnetometer in the temperature range of 5-350 K. The samples were measured with the field aligned either along the in- or out-of-plane direction. The temperature dependence of the magnetization was studied at a constant field and the field dependence at a constant temperature. By magnetic measurement, virgin ZnO is found to be purely diamagnetic with a susceptibility of -2.6510-7 emu/Oeg. This background was subtracted from the magnetic data. To measure the temperature dependent magnetization after zero field cooling and field cooling (ZFC/FC), the sample was cooled in zero field from above room temperature to 5 K. Then a 50 Oe field was applied. The ZFC curve was measured with increasing temperature from 5 to 300 (or 350) K, after which the FC curve was measured in the same field from 300 (or 350) to 5 K with decreasing temperature.
III Results
In this section, we present experimental data on structural and magnetic properties of 57Fe implanted ZnO. Of interest in this study are the ion-implantation induced lattice damage, the distribution of Fe, the formation of metallic Fe nanocrystals, the charge state of Fe, the magnetic properties, and the structure and magnetism evolution upon post annealing. The difference between ZnO bulk crystals and epitaxial films upon Fe implantation is also compared.
III.1 Lattice damage accumulation
III.1.1 Fluence dependence
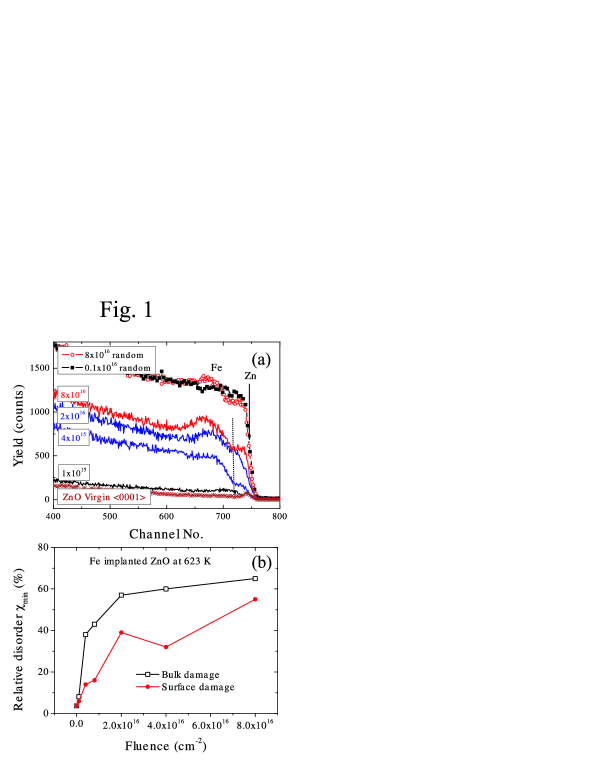
Figure 1(a) shows representative RBS/C spectra for different Fe fluences implanted at 623 K. The arrow labelled Zn indicates the energy for backscattering from surface Zn atoms. The implanted Fe ions cannot be detected for the lowest fluence (0.11016 cm-2). However they are more pronounced as a hump in the random spectrum for a high fluence of 81016 cm-2. The channeling spectrum of a virgin sample is provided for comparison. The yield increase in the channeling spectra mainly originates from the lattice damage due to implantation. However, in the higher fluence case, the Fe ions also significantly increase the RBS yields. Two features are observed in the RBS/C spectra. One is the bimodal Kucheyev et al. (2003) distribution of maximum damage depths, i.e. in the bulk and at the surface, separated by the dashed line in Figure 1(a). Similar depth profiles have already been discussed by Kucheyev et al. Kucheyev et al. (2003). In the bulk damage region the nuclear energy-loss profile is maximum, which induces a large number of atomic displacements. The surface damage peak is often a sink for ion implantation induced point defects Kucheyev et al. (2003).
Another feature is the saturation at larger fluences. , the ration of the channeling spectrum to the random one, is calculated in both damage regions, as shown in Figure 1(b). Above a fluence of 21016 cm-2, both damage peaks saturate. This is due to the strong dynamic annealing effect, i.e., migration and interaction of defects during ion implantation Kucheyev et al. (2003). This strong dynamic annealing also makes ZnO an irridation-hard material, i.e., it still partly persists a crystalline state after irradiation by Fe ions up to a fluence of 81016 cm-2 ( of 68%).
III.1.2 Implantation temperature dependence
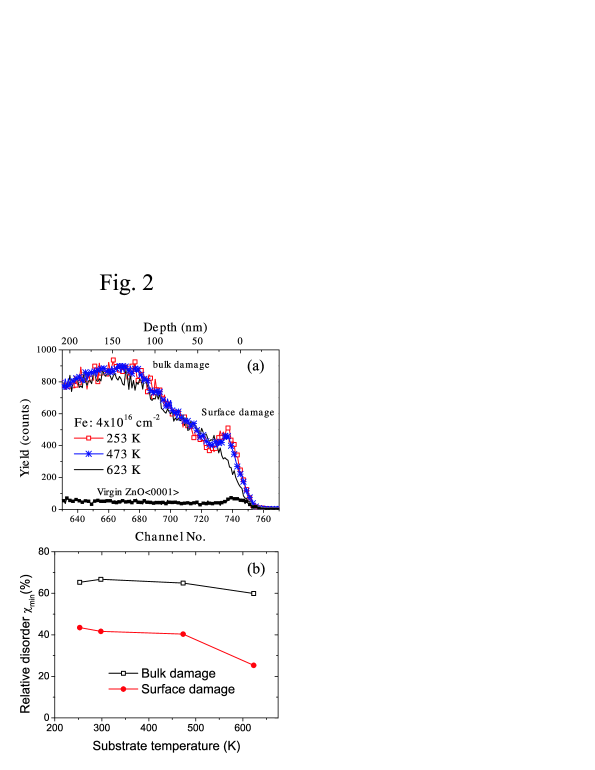
In general increasing the substrate temperature during implantation can suppress the lattice damage in semiconductors. However this is not the case for ZnO. Figure 2(a) shows the channeling spectra for Fe implanted ZnO at different implantation temperatures. Although the surface damage peak increases drastically with decreasing implantation temperature, the bulk damage peak is hardly effected by implantation temperature. This can be observed clearly in Figure 2(b). The point defects induced by ion-beam can be significantly suppressed by increasing the implantation temperature above 623 K. This temperature is very critical, and below 623 K, the surface damage peak also has no dependence on the substrate temperature. This is very important for the electrical doping of ZnO by ion implantation, where point defects are believe to decrease the conductivity Kucheyev et al. (2002).
III.1.3 Recovering by post-annealing
As shown above, the bulk damage cannot be suppressed by increasing the implantation temperature. It has to be removed by post annealing at higher temperature. The annealing was performed in high vacuum in order to avoid extrinsically induced oxidation of Fe. The temperature was varied from 823 K to 1073 K. The details have been reported in the Ref. Zhou et al. (2007a). Both the surface and bulk damage peaks decreased progressively with increasing the annealing temperature and time. However even after annealing at 1073 K for 3.5 hours, there is still considerable damage. This is because of the high melting point of ZnO (2250 K). The extended defects can only be removed completely by annealing at approximately two-thirds of the melting temperature Kucheyev et al. (2001). Therefore a high annealing temperature (1500 K) is necessary to completely recover the lattice structure of ZnO. However, high vacuum annealing above 1000 K also lead the decomposition of ZnO Coleman et al. (2005).
III.2 Fe distribution
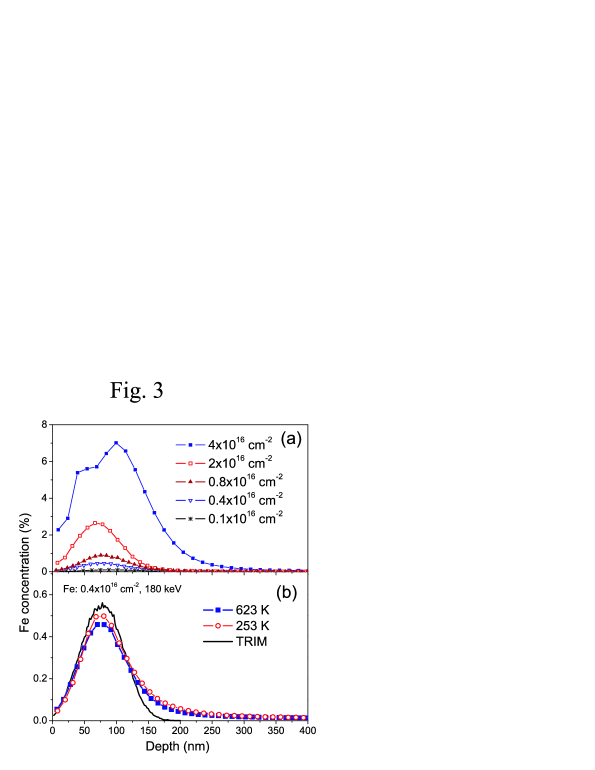
RBS/C can give an overview of the lattice damage upon Fe implantation. However, since the mass of Fe is smaller than Zn, it is difficult to obtain the depth profile of the implanted Fe. Therefore, SIMS is employed to determine the Fe depth profile (see Figure 3(a)). It is observed that the peak concentration of Fe increases from 0.1% to 7%, with a projected range of =(80-90)(20-30). This is in a rather good agreement with TRIM simulations Ziegler et al. (1985). The only discrepancy is the high fluence sample ( cm-2), where TRIM simulations predict a peak concentration of 5%. This is due to the change in SIMS sensitivities for different materials, which implies that the determined concentrations are more accurate in the low concentration (below 1%) regime.
In Figure 3(b) the Fe depth profile is compared for different temperatures with the same fluence of cm-2. The profile does not change significantly due to elevating the implantation temperature from 253 K to 623 K. The slightly higher concentration for implantation at 253 K is within the fluence error.
As discussed the in Ref. Zhou et al. (2007a), Fe diffuses towards the surface after high temperature annealing. The same diffusion of Fe upon annealing was also observed by SIMS (not shown).
III.3 Formation of Fe NCs
By employing SR-XRD, we have systematically investigated the formation of Fe NCs, and its dependence on the fluence and implantation temperature by SR-XRD.
III.3.1 Fluence dependence
| Fluence | Implantation | Peak Concentration | Peak Concentration | (RBS/C) | Metallic Fe | |
|---|---|---|---|---|---|---|
| (cm-2) | Temperature (K) | (TRIM simulation) | (SIMS) | Bulk | Surface | Formation |
| 0.11016 | 623 | 0.14% | 0.1% | 8.1% | 5.9% | No |
| 0.41016 | 623 | 0.55% | 0.46% | 38% | 14% | No |
| 0.81016 | 623 | 1.1% | 0.89% | 43% | 16% | No |
| 21016 | 623 | 2.7% | 2.6% | 57% | 39% | -Fe |
| 41016 | 623 | 5.5% | 6.0% | 60% | 32% | -Fe |
| 81016 | 623 | 11% | - | 65% | 55% | -Fe |
| 0.41016 | 253 | 0.55% | 0.5% | 31% | 16% | No |
| 41016 | 253 | 5.5% | 5.5% | 65% | 43% | No |
| 41016 | 298 | 5.5% | - | 65% | 40% | No |
| 41016 | 473 | 5.5% | - | 66% | 42% | No |
| 410111ZnO epitaxial thin films. | 623 K | 5.5% | - | 44% | - | and -Fe |
| Sample | Crystallite size | TB | Crystallite size | Saturation | Ferromagnetic | Coercivity | |||
|---|---|---|---|---|---|---|---|---|---|
| Fluence | Timp. | Tann. | (XRD) | (ZFC) | Eq.2 | Eq. 4 | magnetization (5 K) | Fe fraction222Calculated by comparing the saturation magnetization with the value (2.2 /Fe) for bulk Fe. | at 5 K |
| (cm-2) | (K) | (K) | (nm) | (K) | (nm) | (/Fe) | (%) | (Oe) | |
| 21016 | 623 | - | 5.6 | 38 | 8 | 6.6 | 0.08 | 3.6 | 600 |
| 41016 | 623 | - | 7.1 | 137 | 12 | 8.9 | 0.24 | 11 | 360 |
| 81016 | 623 | - | 8.9 | 212 | 14 | 11.3 | 0.13 | 5.9 | 360 |
| 41016 | 623 | 823 | 9.4 | 200 | 14 | 10.2 | 0.34 | 15 | 360 |
| 41016 | 253 | 823 | - | 295 | 16 | 9.5 | 0.52 | 24 | 370 |
| 41016111ZnO epitaxial layers implanted with Fe at 180 keV and 623 K. | 623 | - | -/6 (/-Fe) | 26 | 7 | 4.6 | 0.55 | 25 | 220 |
| 41016111ZnO epitaxial layers implanted with Fe at 180 keV and 623 K. | 623 | 823 | 8.1/11 (/-Fe) | 280 | 15 | 10.2 | 1.3 | 59 | 220 |
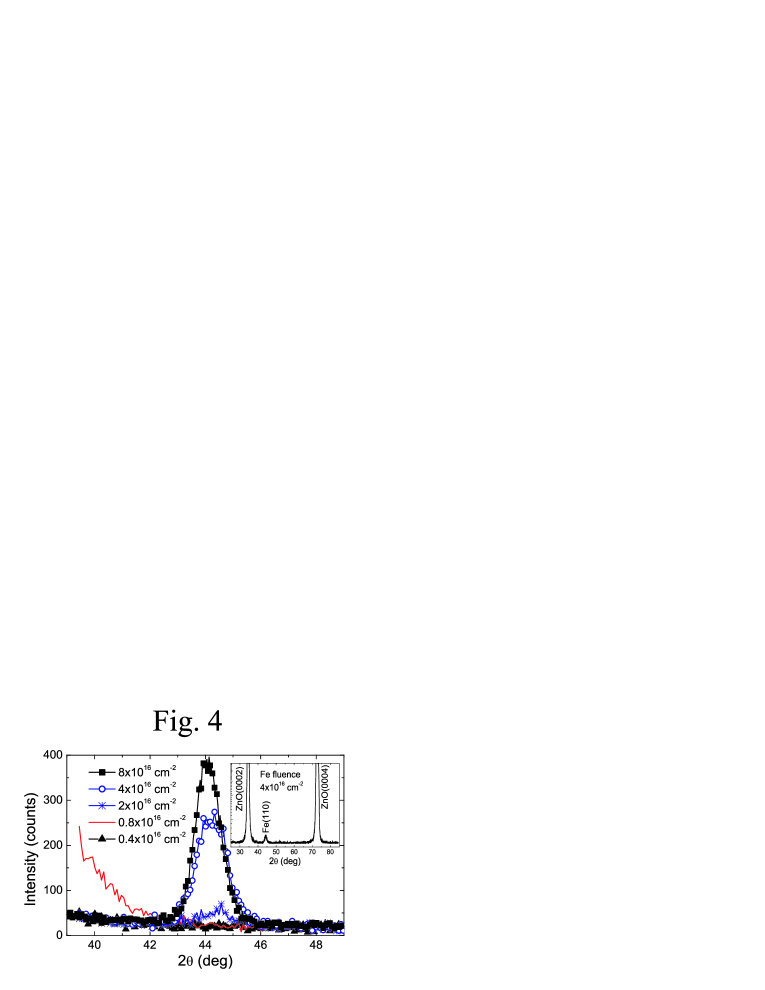
Figure 4 shows the SR-XRD pattern (focused on Fe(110) peak) as a function of fluence. At a low fluence (0.11016 to 0.81016 cm-2), no crystalline Fe NCs could be detected, while above a fluence of 21016 cm-2), an Fe(110) peak appears and increases with fluence. The inset shows a wide range scan for the high fluence sample (41016 cm-2). No other Fe-oxide (Fe2O3, Fe3O4, and ZnFe2O4) particles are detected in the as-implanted state. The full width at half maximum (FWHM) of the Fe(110) peak decreases with fluence, indicating a growth of the average diameter of these NCs. The crystallite size is calculated using the Scherrer formula Cullity (1978).
| (1) |
where is the wavelength of the x-ray, the Bragg angle, and the FWHM of 2 in radians. The crystallite size was estimated using Eq. 1 and is listed in table 2.
Note, that only one peak of Fe(110) appears in the inset of Figure 4. This indicates a texture of the Fe NCs. However no texture behavior is found even for the highest fluence sample in pole figure measurements on Fe(110) and Fe(200) (not shown). This could be due to the difference in the crystalline symmetry of hexagonal ZnO (six fold symmetry) and bcc-Fe (four fold symmetry). For a bcc-crystal, one cannot find a six-fold symmetry viewed from any direction. In contrast, hcp-Co(0001) and fcc-Ni(111) NCs, which are six-fold symmetric, are found to be crystallographically oriented inside ZnO matrix. This highly ordered orientation allows them to be detected even by laboratory XRD Zhou et al. (2006)Zhou et al. (2007b).
III.3.2 Implantation temperature dependence
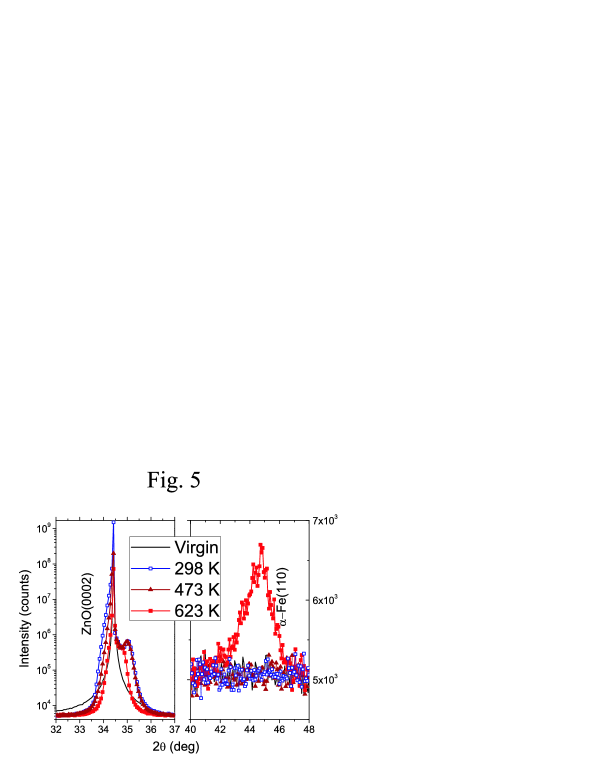
SR-XRD was also performed for the samples with an Fe fluence of 41016 cm-2 implanted at different temperatures from 253 K to 623 K. As shown in Figure 5, for implantation temperatures of 473 K and below, no crystalline Fe could be detected. This is also confirmed by the CEMS results (shown later), where the Fe0 state appears only at an implantation temperature of 623 K. Note the asymmetry of the ZnO(0002) diffraction peaks in Figure 5. Shoulders on the right side (smaller lattice constant) are clearly observed. These shoulders decrease with increasing implantation temperature, and can therefore be associated with lattice damage or ZnO substituted with Fe. In view of a detailed study of ion implantation into GaN where the implantation induces a lattice expansion of GaN (a shoulder at left side) Liu et al. (1997)Ronning et al. (2001), we rather attribute the observed right side shoulders to ZnO substituted with Fe. In the 623 K implantation, metallic Fe NCs start to form, therefore the substitution is reduced.
III.3.3 Growth with post-annealing
After thermal annealing at 823 K for 15 min, more -Fe NCs of a larger size are formed for the samples implanted at 623 K. After 1073 K and 15 min annealing, the -Fe almost disappears and ZnFe2O4 starts to form. The details of the structure and magnetism evolution upon thermal annealing can be found in the Ref. Zhou et al. (2007a).
III.4 Charge state of Fe
CEMS allows one to identify different site occupations, charge and magnetic states of 57Fe. The hyperfine parameters calculated according to the evaluations of the spectra are given in Table 3. All isomer shifts are given relative to an -Fe reference foil. In general, the implanted Fe occupy three different states: metallic Fe, Fe2+ and Fe3+ ions dispersed in the ZnO matrix and finally Fe3+ in Zn-ferrites. The hyperfine interaction parameters obtained from the best fits are different from that of ferromagnetic or -Fe2O3 or ferrimagnetic Fe3O4. Hence, the presence of these phases was excluded. The dispersed ionic Fe could substitute onto Zn site.
| Sample | S | D(I) | D(II) | M (-Fe) | |||||||||
|---|---|---|---|---|---|---|---|---|---|---|---|---|---|
| Code | Timp. | Tann. | FR111Fraction corresponding to the relative area of the subspectrum. | IS222Isomer shift: 0 mm/s for -Fe, 0.7-1.2 mm/s for Fe2+, 0.2-0.7 mm/s for Fe3+, and -0.1 mm/s for -Fe. | FR111Fraction corresponding to the relative area of the subspectrum. | IS222Isomer shift: 0 mm/s for -Fe, 0.7-1.2 mm/s for Fe2+, 0.2-0.7 mm/s for Fe3+, and -0.1 mm/s for -Fe. | QS333Quadrupole splitting. | FR111Fraction corresponding to the relative area of the subspectrum. | IS222Isomer shift: 0 mm/s for -Fe, 0.7-1.2 mm/s for Fe2+, 0.2-0.7 mm/s for Fe3+, and -0.1 mm/s for -Fe. | QS333Quadrupole splitting. | FR111Fraction corresponding to the relative area of the subspectrum. | IS222Isomer shift: 0 mm/s for -Fe, 0.7-1.2 mm/s for Fe2+, 0.2-0.7 mm/s for Fe3+, and -0.1 mm/s for -Fe. | Bhf444Magnetic hyperfine field. |
| (K) | (K) | (%) | () | (%) | () | () | (%) | () | () | (%) | () | (T) | |
| 623 | - | 27.7 | 0.57 | 13.7 | 0.31 | 0.75 | 58.6 | 0.81 | 0.79 | - | - | - | |
| S1 | 623 | - | 32.8 | 0.53 | 31.5 | 0.78 | 1.29 | 23.2 | 0.96 | 0.58 | 12.5 | 0.06 | 30.5 |
| S1 | 623 | 823 | 42.6 | 0.42 | 16.7 | 0.68 | 1.52 | 22.5 | 0.94 | 0.54 | 18.2 | 0.07 | 31.7 |
| S1 | 623 | 1073 | - | - | 100 | 0.35 | 0.43 | - | - | - | - | - | - |
| S2 | 253 | - | 13.6 | 0.22 | 14.1 | 0.24 | 0.65 | 72.3 | 0.92 | 0.97 | - | - | - |
| 473 | - | 22.2 | 0.32 | 9.7 | 0.27 | 0.63 | 68.1 | 0.94 | 0.77 | - | - | - | |
| S2 | 253 | 823 | 6.2 | -0.09 | 46.8 | 0.42 | 0.39 | 18.2 | 0.88 | 0.51 | 28.8 | 0.04 | Dist.555Hyperfine field distribution. |
| S3666ZnO epitaxial thin films. | 623 | - | 23.0 | -0.09 | 26.3 | 0.45 | 0.32 | 37.3 | 0.91 | 0.80 | 13.4 | 0 | Dist.555Hyperfine field distribution. |
| S3 | 623 | 823 | 13.9 | -0.09 | 31.4 | 0.45 | 0.35 | 15.9 | 0.92 | 0.58 | 38.8 | 0.02 | Dist.555Hyperfine field distribution. |
III.4.1 Fluence dependence
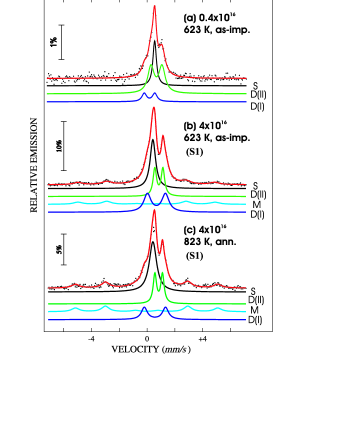
Figure 6(a) and 6(b) show the comparison of Fe implanted ZnO at 623 K with a fluence of 0.41016 and 41016 cm-2, respectively. In spectrum (a), the singlet S and doublet D(I) are attributed to Fe3+, while the doublet D(II) is from Fe2+. In the high fluence sample (spectrum (b)), the majority of Fe are ionic states Fe3+ (singlet S) and Fe2+ (doublet D(I) and D(II)), while a considerable fraction of a sextet associated to -Fe is present (sextet M). The formation of -Fe is in agreement with SR-XRD observation (Figure 4). At room temperature, all Fe2+ and Fe3+ show no ferromagnetic interaction. Later on in subsection III.6, we show that even at 5 K the measured ferromagnetism can only be attributed to -Fe NCs.
III.4.2 Implantation temperature dependence
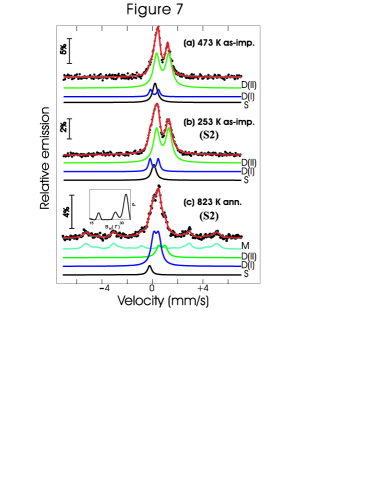
Figure 7(a) and 7(b) shows CEMS for the samples implanted at low temperatures, 473 K and 253 K, respectively, with a 57Fe fluence of 41016 cm-2. In these two samples, ionic Fe are the dominant charge states: Fe3+ (S and D(I)), and Fe2+ (D(II)). In contrast to Figure 6(b), there is no detectable -Fe in these two samples. This is also in agreement with SR-XRD results (Figure 5), where up to an implantation temperature of 473 K no -Fe is found.
III.5 Implantation Energy dependence
III.5.1 Evolution with post-annealing
The post-annealing was performed on selected samples: S1 and S2 (Table 3). They were implanted with the same fluence of 41016 cm-2 at 623 K and 253 K, respectively. For sample S1, upon annealing at 823 K for 15 min, the intensity of the sextet increases up to 18.2% while the fraction of Fe2+ (doublet D(I)) decreases, suggesting the growth of the -Fe nanoparticles and the recovery of lattice defects (Figure 6(c)). Moreover, the value for the magnetic hyperfine field Bhf increases upon annealing and moves closer (from 30.5 T to 31.7 T) to the known value for bulk -Fe (33 T). For sample S2, after annealing at 823 K for 15 min, the relative fraction of metallic -Fe increases up to 28.8%. The hyperfine field is distributed with maxima at 18 T, 27 T and mostly at 32.5 T (-Fe). Comparing with the annealing of sample S1, a larger fraction of -Fe is formed in the annealed sample S2. This is consistent with a larger magnetization measured by SQUID (shown later). In addition, a small fraction of singlet (S) presents, which is attributed to -Fe according to the isomer shift.
Higher temperature (1073 K) annealing was performed on sample S1 and has been reported in Ref Zhou et al. (2007a). After annealing at 1073 K for 3.5 hours, Fe3+ is the only charge state, and Zn-ferrites (ZnFe2O4) are formed and are crystallographically oriented inside ZnO matrix.
III.6 Magnetic properties Fe implanted ZnO
In the previous sections, we have reported a thorough investigation on the structural properties, and the charge states of Fe. The main conclusion can be summarized as follows (i) upon implantation at a temperature of 623 K, a small part (around 12%) of the implanted Fe ions forms as crystalline Fe already in the as-implanted state, while the major part of the implanted Fe is in ionic states (Fe2+, and Fe3+); (ii) implantation at a low temperature (253 K) suppresses the metallic Fe formation, and the implanted Fe ions are in ionic states, but they are not magnetically coupled at room temperature; (iii) post-annealing at 823 K largely enhances the Fe NC formation in all implanted samples for both implantation temperatures (253 K and 623 K). Since CEMS was performed at room temperature only, the magnetic properties of metallic and ionic Fe at low temperature could not be determined. Here we present the results from SQUID magnetometry measured from 5 K to 350 K. We will show that the metallic Fe NCs are superparamagnetic, and they are the predominant contribution to the measured ferromagnetic response even at 5 K. In contrast the ionic Fe is not ferromagnetically coupled even at 5 K.
III.6.1 Superparamagnetism of Fe NCs
For magnetic nanoparticles, the formation of domain walls is energetically unfavorable and below a certain size (typically in the range of 15 to 30 nm depending on the material), the particle stays in a single-domain configuration. The magnetism of a single nanoparticle in a solid matrix can be described by the Néel process Respaud et al. (1998). If the particle size is sufficiently small, above a particular temperature (so-called blocking temperature, TB) thermal fluctuations dominate and no preferred magnetization direction can be defined. Such a system of superparamagnetic particles does not exhibit a hysteresis loop above TB; therefore the coercivity (HC) and the remanence (MR) are both zero. Phenomenologically there are two characteristic features in the temperature dependent magnetization of a nanoparticle system. One is the irreversibility of the magnetization in a small applied field (e.g. 50 Oe) after zero field cooling and field cooling (ZFC/FC) Respaud et al. (1998). The other is the drastic drop of the coercivity and of the remanence at a temperature close to or above TB Shinde et al. (2004).
For a dc magnetization measurement in a small magnetic field by SQUID, the blocking temperatue TB is given by
| (2) |
where is the anisotropy energy density, the particle volume, and the Boltzmann constant Respaud et al. (1998). With this equation, one can estimate the particle size Shinde et al. (2004). However, in any fine particle system, there is a distribution of particle sizes, which is usually assumed as a log-normal distribution .
| (3) |
where is the most probable value, and is the standard deviation.
Such a volume distribution results in a distribution of blocking temperatures . The ZFC magnetization can be calculated as follows Respaud et al. (1998).
| (4) |
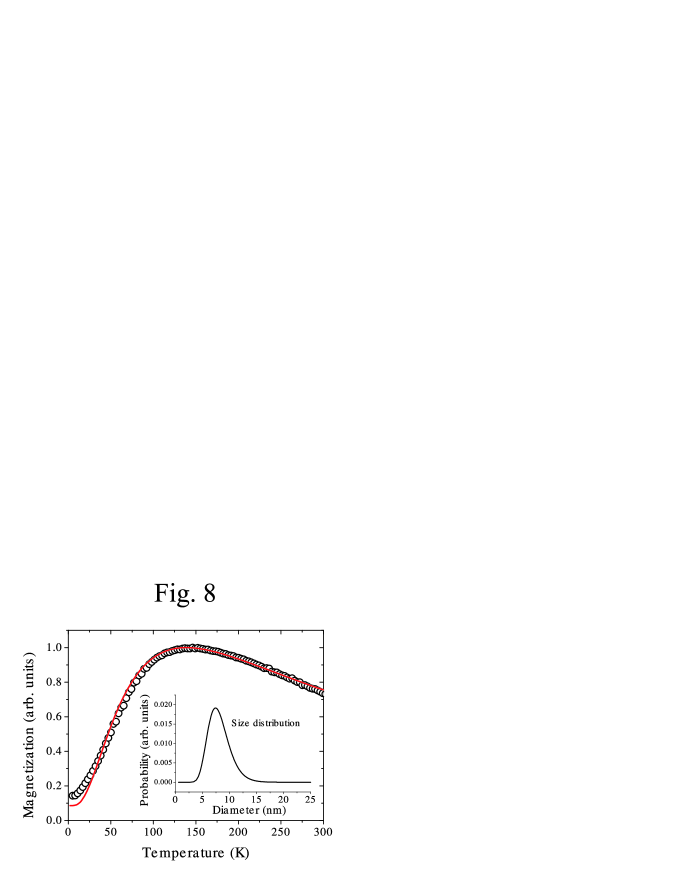
where is the spontaneous magnetization of the particle, the volume distribution, (/) the maximum volume in the superparamagnetic state, N the normalizing factor, and the Boltzmann constant. is assumed to be a constant independent of temperature Respaud et al. (1998)Farle (2005). The first integral represents the contribution of the superparamagnetic particles, while the second corresponds to the blocked ones. A more precise determination of the size should be performed by fitting the ZFC curve with the equation 4. Figure 8 shows the fitting on the ZFC magnetization curve, and the corresponding size distribution. In the fit, =5104 J is treated as a constant.
III.6.2 Fluence dependence
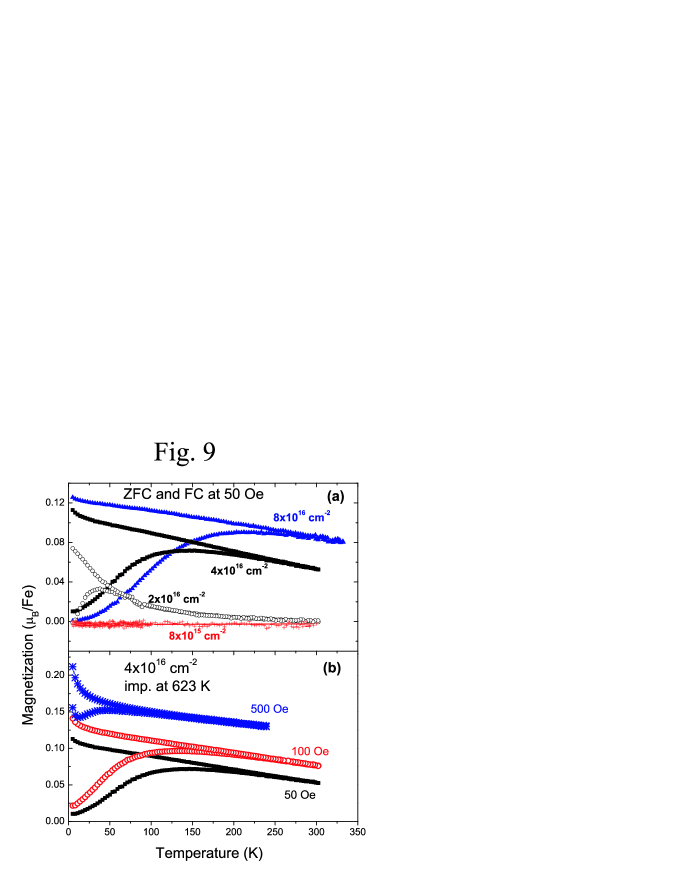
Figure 9(a) shows the ZFC/FC magnetization curves in a 50 Oe field for different fluences of Fe implanted ZnO. The FC curves for low fluences of 0.11016 (not shown for clarity) and 0.81016 cm-2 completely overlap with the corresponding ZFC curves at values close to zero. No superparamagnetic particles are present in the two samples. For larger fluences (above 21016 cm-2), a distinct difference in ZFC/FC curves was observed. ZFC curves show a gradual increase (deblocking) at low temperatures, and reach a broad peak with a maximum, while FC curves continue to increase with decreasing temperature. The broad peak in the ZFC curves is due to the size distribution of Fe NCs. In this paper, the temperature at the maximum of the ZFC curve is taken as the average blocking temperature (later referred as TB). At a much higher temperature than TB, FC curves still depart from corresponding ZFC curves, which distinguish the Fe particle system from a conventional spin-glass system where the FC curve merges together with ZFC curve just at TB and shows a plateau below TB Sun et al. (2003). The ZFC/FC curves are general characteristics of magnetic nanoparticle systems with a broad size distribution Tsoi et al. (2005). TB increases with the fluence, i.e. the size of nanoparticles. Table 2 lists the average size of Fe NCs calculated by Eq. 2 and by XRD data (Eq. 1), and simulated by Eq. 4. Although the trend is the same for all calculations, the values from Eq.2 are larger than that from Eq. 4 and from XRD data. Given the large size distribution in the present magnetic nanoparticle system, TB is overestimated by taking the temperature at the maximum of the ZFC curve Farle (2005). This explains why Eq. 2 gives a large average particle size. For the fitting according to Eq. 4, one has to note that and are assumed to be temperature independent, and the interaction between the NCs is ignored. These effect contribute to the error bars Jacobsohn et al. (2006). Nevertheless, from both techniques (XRD, and ZFC magnetization), we have determined the size of Fe NCs and its distribution.
Figure 9(b) shows ZFC/FC curves with an applied field ranging from 50 Oe to 500 Oe for the sample with fluence of 41016 cm-2. TB in the ZFC curves clearly shifts to lower temperatures with increasing field. This behavior is expected for magnetic nanoparticles since the reduced energy barrier caused by the external magnetic field allows the reorientation of the superparamagnetic moments by thermal fluctuations at lower temperatures Park et al. (2004)Shinde et al. (2004).
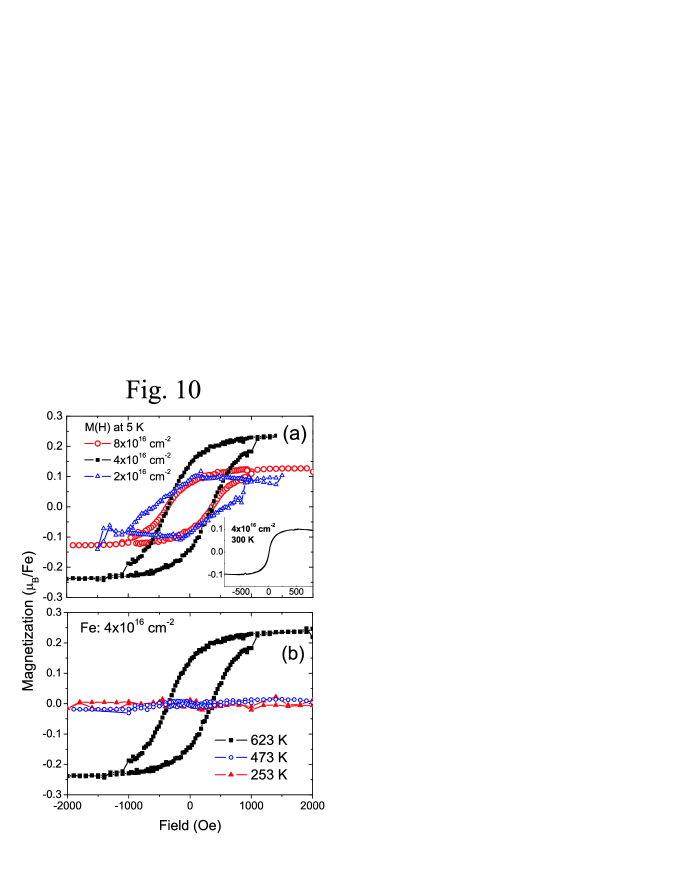
Figure 10(a) shows the magnetization versus field reversal (M-H) of samples implanted with large fluences. At 5 K, hysteretic behaviors were observed for all three samples. The saturation moment is increased with increasing fluence, however the coercivity is decreased from 600 Oe for a fluence of 21016 cm-2 to 330 Oe for larger fluences (see table I). This can be explained by the enhanced coercivity effect for the interfacial spins, which increases with decreasing the size of nanoparticles Batlle and Labarta (2002). The inset shows the M-H curve at 300 K for the sample implanted with the fluence of 41016 cm-2. As expected for a magnetic nanoparticle system, above the blocking temperature, both remanence and coercivity drop to zero.
III.6.3 Implantation temperature dependence
Figure 10(b) shows the magnetization versus field reversal of samples implanted with Fe (41016 cm-2) at different implantation temperatures. Only the sample implanted at 623 K shows a hysteretic behavior due to the presence of Fe NCs, while the other samples implanted at 473 K or below show no ferromagnetic response down to 5 K. This is in full agreement with SR-XRD and CEMS measurements.
III.6.4 Post annealing effect
The magnetic properties of the samples implanted at 623 K have been reported in a previous paper Zhou et al. (2007a). The main conclusions are the following: the annealing at 823 K results in the growth of -Fe NCs. During annealing at 1073 K the majority of the metallic Fe is oxidized; after a long term annealing at 1073 K, crystallographically oriented ZnFe2O4 NCs form. Here we mainly present the annealing at 823 K for the samples implanted at 253 K. Due to the different initial state from the 623 K implanted samples, the same annealing temperature leads to different results.
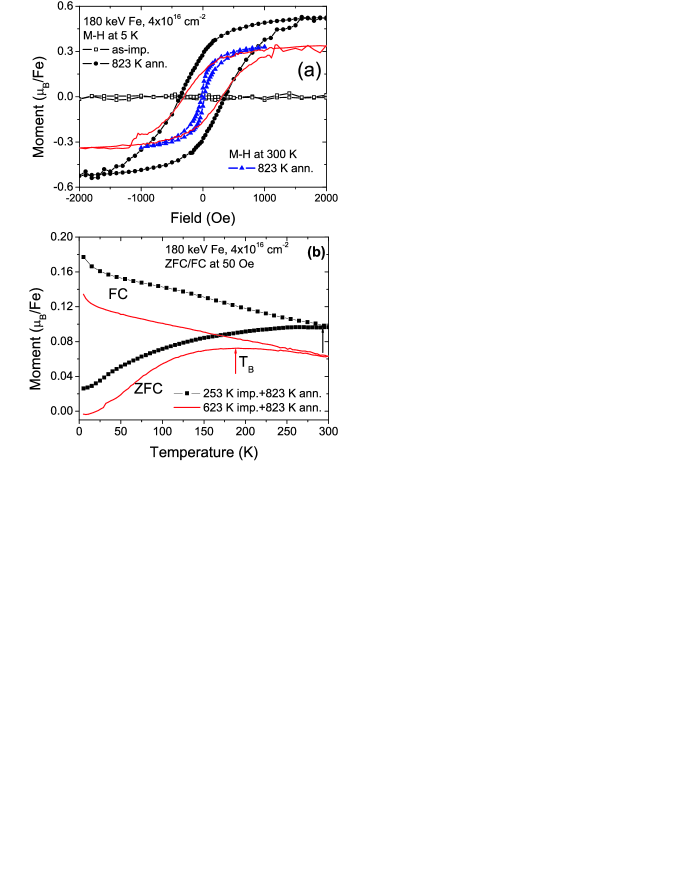
Figure 11 shows the magnetic properties of the samples implanted at 253 K with subsequent post annealing. In the as-implanted state, there is no ferromagnetism down to 5 K, while after 823 K annealing, magnetization of 0.52 /Fe was observed. The ZFC/FC magnetization curves show the characteristics of magnetic nanoparticle system. According to SR-XRD and CEMS results, we attribute this to Fe NCs. The ZFC curve is very broad and TB is above room temperature. The M-H curves at 300 K for both cases are still open, although with much smaller coercivity and remanence compared with 5 K. However the magnetic properties are quite different from the 623 K implanted sample after post annealing at 823 K, where the TB is well below 300 K, and at 300 K there is neither coercivity nor remanence. We will discuss this difference in section IV.
III.6.5 Magnetic anisotropy of Fe NCs
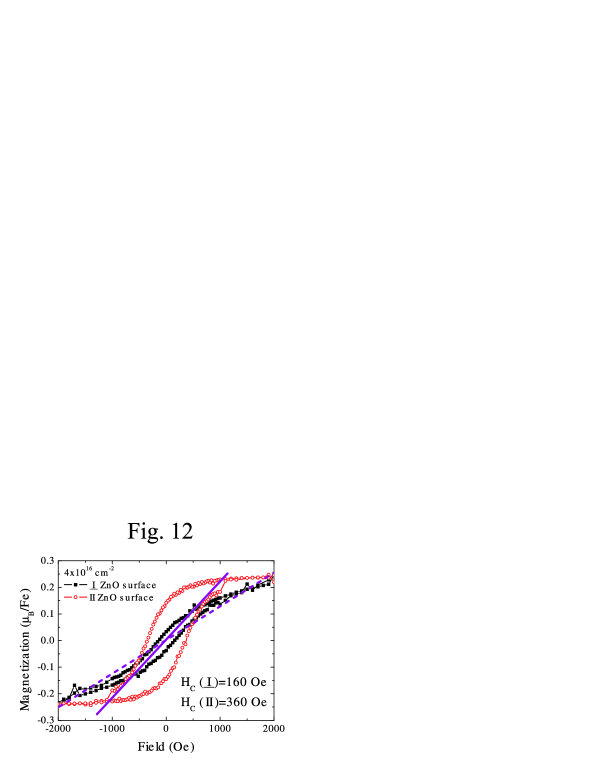
M-H loops were also measured for selective samples which have been implanted with a fluence of 41016 cm-2 with the field applied perpendicular to the sample surface. Figure 12 shows the comparison of the magnetization between the in-plane and out-of-plane direction at 5 K. The in-plane (parallel to the ZnO surface) is the easy axis, while the out-of-plane (perpendicular) is the hard axis. At 5 K, the coercivity of the easy axis is around 360 Oe, and the ratio of MR/MS (remanence and saturation moment) is around 58%. The anisotropy energy, , can be calculated according to the equation of =, where is the saturation moment of 4=22000 G, is the effective anisotropy field. Indeed is rather difficult to be deduced since it is not easy to measure a real hard axis loop with SQUID magnetometry without a precise control of the sample alignment. Moreover the size distribution of Fe NCs could result in a distribution of . Therefore, we deduce a lower and upper limit of according to the shape of the hard axis loop. Using this approach, the anisotropy energy is estimated to be in the range of (1.8-3.3)105 Jm-3. It is larger than the magnetocrystalline anisotropy, and around one order of magnitude larger than the uniaxial anisotropy observed in Fe thin films Shaw et al. (2006) and micro-scale Fe nanomagnets Pulwey et al. (2002). If the Fe NCs are assumed to be sphere-like, their magnetism should be isotropic, unless they are textured. However as found by XRD, these Fe NCs are not textured. This magnetic anisotropy could be due to the shape effect of Fe NCs, i.e. they are not sphere-like, or magnetostriction. There is, however, no evidence for any of these two possibilities.
III.6.6 Memory effect of Fe NCs
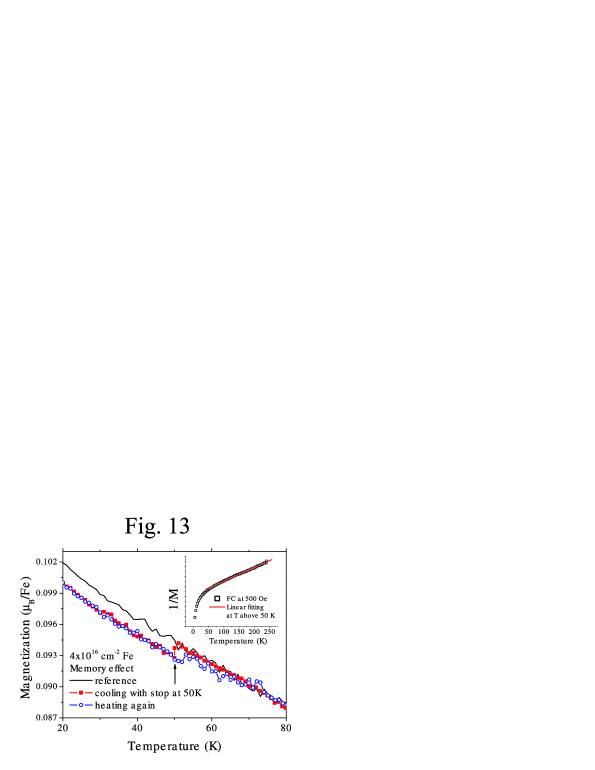
Below the blocking temperature, a magnetic nanoparticle system has a rich and unusual behavior. For instance a slow relaxation and a history-dependent magnetic memory are found in the dc magnetization as a function of temperature Sun et al. (2003)Tsoi et al. (2005)Zheng et al. (2004)Sasaki et al. (2005)Chakraverty et al. (2006). In our system, Fe nanoparticles embedded inside ZnO crystals, the temperature dependent memory effect was also observed (Figure 13) using a cooling and heating protocol suggested by Sun et al. Sun et al. (2003). At 300 K a magnetic field of 50 Oe was applied and the sample was cooled down to 5 K at a constant cooling rate of 3 K/min. Then the sample was heated continuously at the same rate and the magnetization was recorded. The obtained M(T) curve is referred as the reference curve (solid line in Figure 13). Thereafter, we cooled the sample at the same rate and recorded the magnetization with cooling, but temporarily stopped at T = 50 K for a waiting time of 2 hours. During waiting time, the field was switched off. After the stop, the 50 Oe field was reapplied and cooling and measuring were resumed. The temporary stop resulted in a steplike M(T) curve (solid squares in Figure 13). After reaching the lowest temperature 5 K, the sample was heated back with the rate of 3K/min in the same field, and the magnetization was recorded again. The M(T) curve during this heating also has a steplike behavior at the stop temperature of 50 K, then recovers the previous M(T) curve measured during cooling. The system remembers its thermal history. Two explanations have been suggested for such a memory effect Sasaki et al. (2005). The first one is a broad distribution of blocking temperatures originating from the distribution of the anisotropy energy barriers. Another explanation is the strong dipolar interaction between nanoparticles, which frustrates the nanomagnetic moments, and slows down their relaxation. Our observations rather support the first model. First of all, the memory effect is also observed for two other samples (21016, and 81016 cm-2) (not shown). Therefore the effect is independent of ion fluence, i.e. particle density. Second, the inset of Figure 13 shows the reciprocal FC magnetization at 500 Oe versus temperature. The perfect linearity of the curve for T50 K strongly suggests that the dynamics of the nanoparticles above blocking temperature can be well described by superparamagnetism. Therefore, the magnetic properties of the sample depend only on the individual particle behavior. Third, the size of Fe nanoparticles is widely dispersed according to the analysis on the ZFC magnetization curve as shown in Figure 8. Therefore, we would attribute the memory effect to the broad distribution of particle size, i.e. of anisotropy energy barriers.
III.7 Fe implanted epitaxial ZnO layers
The epitaxial ZnO layers used in this study were grown by pulsed layer deposition on Al2O3(0001). These thin films are n-type conducting with a carrier concentration of 1015-1017 cm3 at room temperature. Details about the sample preparation can be found in Refs. Kaidashev et al. (2003)Lorenz et al. (2003)Lorenz et al. (2006). 57Fe ions were implanted at an energy of 180 keV at 623 K. Then the samples were subjected to the same thermal annealing, and structural as well as magnetic characterization like the bulk crystals.
III.7.1 Formation of Fe NCs
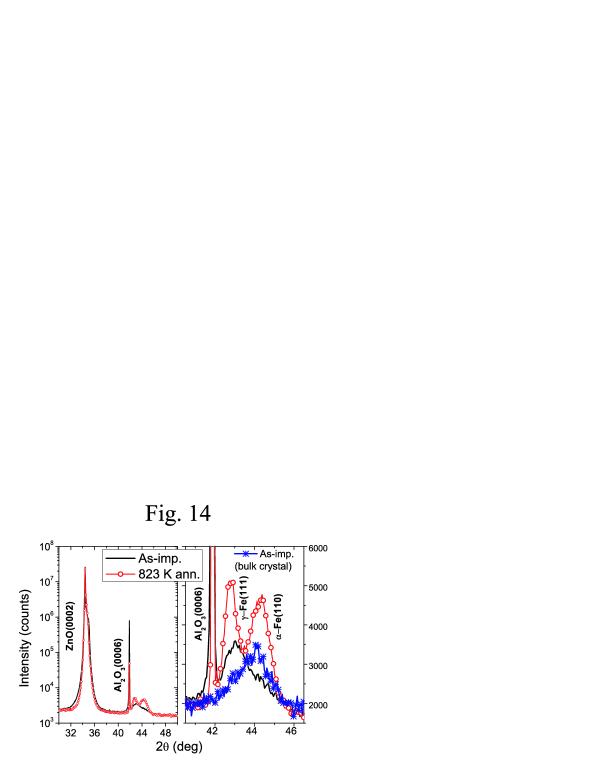
Figure 14 shows the XRD 2- scans of Fe implanted ZnO epitaxial layers (as-implanted and post annealed at 823 K). In the left panel, one can see the nice epitaxy of ZnO on Al2O3 with the out-of-plane relationship of ZnO(0001)Al2O3(0001). The right panel is a zoom on the Fe-related peak region. A single crystal sample implanted with the same fluence and at the same temperature is shown for comparison. Obviously, the epitaxial ZnO behaves differently from the bulk crystals upon Fe implantation. In the epitaxial-layer, -Fe is the predominant phase, while it is -Fe in the single crystal. This difference will be discussed in section IV. Upon thermal annealing at 823 K, the epitaxial ZnO behaves similar to the low temperature implanted bulk crystals. Both metallic Fe phases ( and ) are growing.
III.7.2 Charge state of Fe
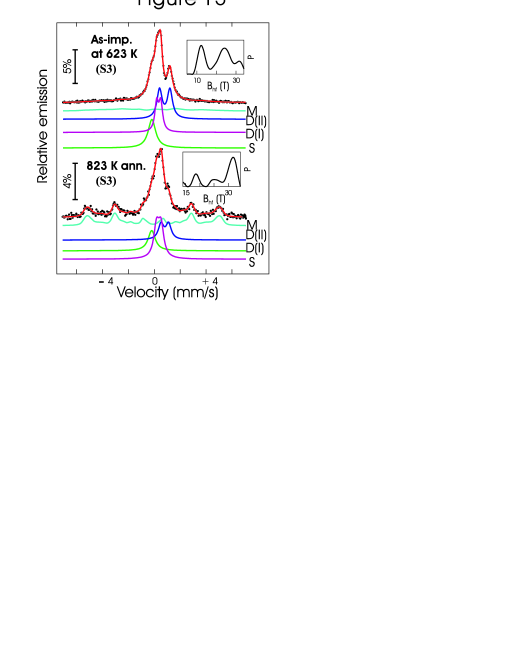
The charge and chemical states of Fe deduced from CEMS are shown in Figure 15. The hyperfine interaction parameters are given in Table 3. In the as-implanted sample, ionic Fe is the predominant phase, while also - and -Fe are present (sextet M and singlet S, respectively). After annealing at 823 K, the fraction of ferromagnetic -Fe is drastically increased from 13.4% to 38.8%. In the bulk crystal implanted at the same condition, there is no -Fe neither in as-implanted nor in annealed samples. Also the fraction of -Fe after annealing (18.2%) is much lower than that in epitaxial films (38.8%).
III.7.3 Magnetic properties
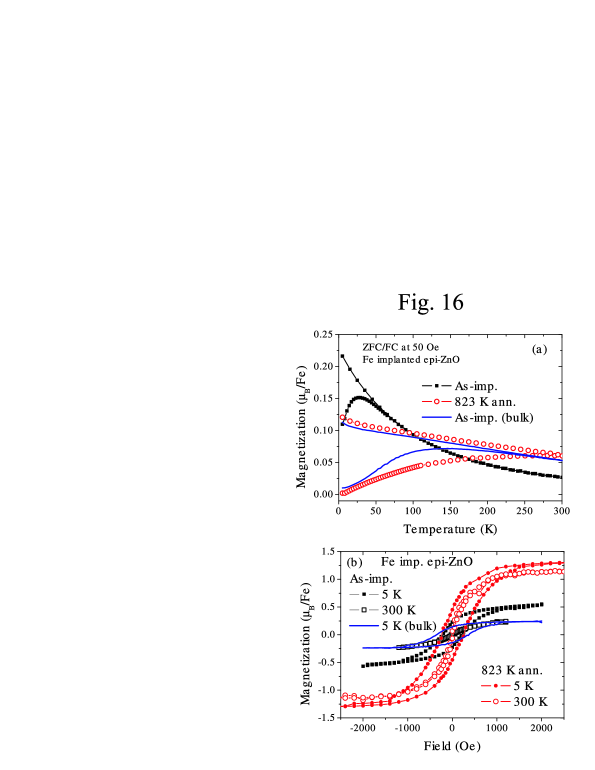
The ZFC/FC magnetization measurements for the as-implanted and 823 K annealed samples (Figure 16(a)) shows the typical behavior of a magnetic nanoparticle system. However TB in the ZFC curves increases from 26 K to around 300 K with post annealing. The absolute magnetization value per Fe in the ZFC/FC curves for the annealed sample is lower than that of the as-implanted sample. This is due to the fact that there are more bigger Fe NCs after annealing, and the bigger NCs are more difficult to be aligned at such a small field of 50 Oe. Figure 16(b) shows the M-H curves. The coercivity is not significantly changed with annealing, while the saturation magnetization is increased from 0.55/Fe to 1.3/Fe at 5 K and from 0.24/Fe to 1.1/Fe at 300 K, respectively, with annealing. For both samples, the M-H loops show no hysteresis at 300 K without coercivity and remanence. Obviously, the annealing behavior is different from the single crystal implanted at same temperature of 623 K, but similar to the single crystal implanted at 253 K. We will discuss this point in section IV.
IV Discussions
IV.1 Phase diagram of Fe in ZnO
In section III, we present the structure and magnetic properties of Fe implanted ZnO. The implantation parameters, i.e. fluence, energy, temperature, were varied. In general, metallic Fe NCs have been formed already in the as-implanted state when the implantation temperature is above 623 K and the fluence is above cm-2. By summarizing all results, a phase diagram of Fe in ZnO can be sketched, as shown in Figure 17. Note that the materials studied in this research are ZnO bulk crystals grown by hydro-thermal method. They are semi-insulating in the as-purchased state with n-type carrier concentration of 1012-1014 cm-3. The phase diagram will likely be different for epitaxial-ZnO and for p-type ZnO.
IV.2 Phase separation depends on the forms of ZnO
In section III, we have shown the structural and magnetic properties of ZnO bulk crystals and epitaxial thin films implanted at the same temperature and with the same Fe fluence. They are obviously different from each other (see table 2). In the bulk crystals, only 11% (increased to 15% after 823 K post annealing) of the implanted Fe is ferromagnetic and mainly -Fe, while 25% in the epitaxial ZnO films (increased to 59% after 823 K post annealing). Recently Dietl proposed the self-organized growth driven by the charge state of the magnetic impurities Dietl and Ohno (2006)Dietl (2006). The energy levels derived from the open shells of transition metals reside usually in the bandgap of the host semiconductor. The mid-gap levels of magnetic impurities trap carriers origination from residual impurities or defects. This trapping alters the charge state of the magnetic ions and hence affects their mutual Coulomb interactions. Therefore, different carriers (electrons or holes, with different concentrations) could lead to different interactions (e.g. repulsions and attractions) between the implanted transition metal ions, and finally result in a different phase separation. Both ZnO materials (bulk crystals and epitaxial thin films) used in this study are n-type semiconductors. The carrier concentration is around 1012-1013 cm-3 for bulk crystals and 1015-1017 cm3 for epitaxial thin films Kaidashev et al. (2003)Lorenz et al. (2003) at room temperature. Therefore, we can explain the different behavior in ZnO bulk crystals and epitaxial layers upon Fe implantation in the above-mentioned model. A higher concentration of free electrons leads to more agglomerations of Fe. Moreover the nanocrystal aggregation could be largely reduced or avoided by the realization of p-type doping in ZnO.
However, one has to note that there are a lot of defects, such as dislocations, and stacking faults, in the epitaxial ZnO films grown on Al2O3 due to the large lattice mismatch Narayan et al. (1998). Kaiser et al. demonstrated that in high fluence Er implanted SiC, the defects act as nucleation sites in the formation of Er-atom cluster and NCs Kaiser et al. (2002). A similar effect can be present in the case of Fe implanted ZnO films.
IV.3 Annealing behavior depends on the initial state
Note that three kind of samples have been annealed at the same temperature of 823 K. One is the ZnO single crystal implanted at 623 K, in which Fe NCs have already been formed in the as-implanted states. One is the ZnO single crystal implanted at 253 K, in which no Fe NCs could be detected in the as-implanted sample. The last one is the ZnO thin film implanted at 623 K, in which rather small Fe NCs have been formed in the as-implanted sample compared to that in the single crystal. The annealing behavior in the first case is quite different from the later two cases. One reason is the fact that diffusion of Fe NCs is much more difficult than of single Fe ions. In the 623 K implanted sample, Fe NCs have already been formed, and they are not so mobile during 823 K annealing. Therefore the size and the amount of Fe NCs only slight increase after annealing. However, in the sample without Fe NCs or with very small NCs, Fe ions are more mobile with annealing, and they aggregate into rather larger Fe NCs. Another reason could be the same as discussed in the above section, given the fact that implantation at 253 K induces more point defects than that 623 K (see Figure 2).
IV.4 Magnetic coupling of dispersed ionic Fe
Although a part of the implanted Fe ions aggregated to metallic NCs, the remaining are in the ionic state. Even after 823 K annealing, there is still a considerable amount of ionic Fe. By SR-XRD no crystalline Fe-oxides could be detected. Therefore, these ionic Fe could be diluted inside ZnO matrix. Moreover, Ref. Kucheyev et al. (2002) demonstrated that the implantation-induced electrical isolation of ZnO is removed after annealing between 773 to 873 K. Therefore, the carrier concentration is comparable with the virgin sample after annealing at 823 K. However, as measured by SQUID down to 5 K and CEMS at room temperature, Fe2+ and Fe3+ are not ferromagnetically coupled.
In addition to conventional thermal annealing which is an equilibrium process, a nonequilibrium annealing technique, i.e. flash lamp annealing at a pulse length of 20 ms, was also used by us Potzger et al. (2007). For an intermediate light power, the implantation-induced surface defects could be removed without creation of secondary phases within the implanted region. However, there is still no detectable ferromagnetic coupling between these dispersed Fe ions.
Moreover, currently the absence of ferromagnetism in transition metal doped ZnO is a universal problem. Several groups have shown that transition metal ions, e.g. Fe Kolesnik et al. (2004), Mn Rao and Deepak (2005)Kolesnik et al. (2004), and Co Rao and Deepak (2005)Zhang et al. (2006)Kolesnik et al. (2004), are substitutional inside ZnO. However, no ferromagnetism could be observed due to the possible reason of the lack of p-type conductivity.
V Summary and Conclusions
(1) In general, a combination of SR-XRD, ZFC/FC magnetization and element specific spectroscopy measurements is a reliable approach to clarify the observed magnetism in DMS materials.
(2) By correlating the structural and magnetic properties of all investigated samples, it is clear that ferromagnetism is only observed when -Fe (or ZnFe2O4) NCs are present. In as-implanted and 823 K annealed samples, dispersed Fe2+ and Fe3+ are the predominant charge states. However, they are not ferromagnetically coupled.
(3) -Fe (bcc) NCs are not crystallographically oriented inside ZnO matrix. However, fcc-ZnFe2O4 NCs formed after annealing at 1073 K are epitaxially embedded in ZnO. This is due to the crystalline symmetry. Hexagonal ZnO crystals are six-fold symmetric, while -Fe is four-fold symmetric. Fcc-ZnFe2O4 is also six-fold symmetric viewed along [111] direction.
(4) The magnetic properties of these Fe NCs were carefully investigated regarding their memory effect and magnetic anisotropy. A memory effect is observed in the temperature dependent magnetization measurement, which is induced by the different relaxation times originating from the different grain sizes of the Fe nanoparticles, and consequently different anisotropy energy barriers. The in-plane magnetic anisotropy could be due to the shape effect.
(5) The phase separation, i.e. the formation of metallic Fe, depends on the initial state of the host materials, namely the carrier and/or the defect concentrations. The n-type carriers could facilitate the self-organization of metallic Fe NCs.
(6) The next question is directed to the magnetically activation of the diluted ionic Fe in ZnO. The realization of p-type doping for ZnO could be the solution.
VI Acknowledgments
We are thankful Holger Hochmuth for the growth of epitaxial ZnO films and Heidemarie Schmidt for fruitful discussions.
References
- Dietl et al. (2000) T. Dietl, H. Ohno, F. Matsukura, J. Cibert, and D. Ferrand, Science 287, 1019 (2000).
- Sato and Katayama-Yoshida (2001) K. Sato and H. Katayama-Yoshida, Physica E 10, 251 (2001).
- Angadi et al. (2006) B. Angadi, Y. S. Jung, W. K. Choi, R. Kumar, K. Jeong, S. W. Shin, J. H. Lee, J. H. Song, M. W. Khan, and J. P. Srivastava, Appl. Phys. Lett. 88, 142502 (2006).
- Heo et al. (2004) Y. W. Heo, M. P. Ivill, K. Ip, D. P. Norton, S. J. Pearton, J. G. Kelly, R. Rairigh, A. F. Hebard, and T. Steiner, Appl. Phys. Lett. 84, 2292 (2004).
- Hong et al. (2005a) N. H. Hong, V. Brize, and J. Sakai, Appl. Phys. Lett. 86, 082505 (2005a).
- Hong et al. (2005b) N. H. Hong, J. Sakai, and A. Hassini, J. Phys.-Condens. Matter 17, 199 (2005b).
- Ip et al. (2003) K. Ip, R. M. Frazier, Y. W. Heo, D. P. Norton, C. R. Abernathy, S. J. Pearton, J. Kelly, R. Rairigh, A. F. Hebard, J. M. Zavada, et al., J. Vac. Sci. Technol. B 21, 1476 (2003).
- Jung et al. (2002) S. W. Jung, S. J. An, G. C. Yi, C. U. Jung, S. I. Lee, and S. Cho, Appl. Phys. Lett. 80, 4561 (2002).
- Polyakov et al. (2004) A. Y. Polyakov, A. V. Govorkov, N. B. Smirnov, N. V. Pashkova, S. J. Pearton, K. Ip, R. M. Frazier, C. R. Abernathy, D. P. Norton, J. M. Zavada, et al., Mater. Sci. Semicond. Process 7, 77 (2004).
- Tuan et al. (2004) A. C. Tuan, J. D. Bryan, A. B. Pakhomov, V. Shutthanandan, S. Thevuthasan, D. E. McCready, D. Gaspar, M. H. Engelhard, J. W. Rogers, K. Krishnan, et al., Phys. Rev. B 70, 054424 (2004).
- Venkatesan et al. (2004) M. Venkatesan, C. B. Fitzgerald, J. G. Lunney, and J. M. D. Coey, Phys. Rev. Lett. 93, 177206 (2004).
- Bouloudenine et al. (2005) M. Bouloudenine, N. Viart, S. Colis, J. Kortus, and A. Dinia, Appl. Phys. Lett. 87, 052501 (2005).
- Yin et al. (2006) S. Yin, M. X. Xu, L. Yang, J. F. Liu, H. Rosner, H. Hahn, H. Gleiter, D. Schild, S. Doyle, T. Liu, et al., Phys. Rev. B 73, 224408 (2006).
- Sati et al. (2007) P. Sati, C. Deparis, C. Morhain, S. Schafer, and A. Stepanov, Phys. Rev. Lett. 98, 137204 (2007).
- Fukumura et al. (2001) M. Fukumura, Z. W. Jin, , M. Kawasaki, T. Shono, T. Hasegawa, S. Koshihara, and H. Koinuma, Appl. Phys. Lett. 78, 958 (2001).
- Jin et al. (2001) Z. W. Jin, T. Fukumura, M. Kawasaki, K. Ando, H. Saito, T. Sekiguchi, Y. Z. Yoo, M. Murakami, Y. Matsumoto, T. Hasegawa, et al., Appl. Phys. Lett. 78, 3824 (2001).
- Rao and Deepak (2005) C. N. R. Rao and F. L. Deepak, J. Mater. Chem. 15, 573 (2005).
- Zhang et al. (2006) Z. Zhang, Q. Chen, H. D. Lee, Y. Y. Xue, Y. Y. Sun, H. Chen, F. Chen, and W. K. Chu, J. Appl. Phys. 100, 043909 (2006).
- Norton et al. (2003) D. P. Norton, M. E. Overberg, S. J. Pearton, K. Pruessner, J. D. Budai, L. A. Boatner, M. F. Chisholm, J. S. Lee, Z. G. Khim, Y. D. Park, et al., Appl. Phys. Lett. 83, 5488 (2003).
- Park et al. (2004) J. H. Park, M. G. Kim, H. M. Jang, S. Ryu, and Y. M. Kim, Appl. Phys. Lett. 84, 1338 (2004).
- Kundaliya et al. (2004) D. C. Kundaliya, S. B. Ogale, S. E. Lofland, S. Dhar, C. J. Metting, S. R. Shinde, Z. Ma, B. Varughese, K. V. Ramanujachary, L. Salamanca-Riba, et al., Nat. Mater. 3, 709 (2004).
- Shim et al. (2005) J. H. Shim, T. Hwang, S. Lee, J. H. Park, S. J. Han, and Y. H. Jeong, Appl. Phys. Lett. 86, 082503 (2005).
- Potzger et al. (2006) K. Potzger, S. Q. Zhou, H. Reuther, A. Mücklich, F. Eichhorn, N. Schell, W. Skorupa, M. Helm, J. Fassbender, T. Herrmannsdorfer, et al., Appl. Phys. Lett. 88, 052508 (2006).
- Shinagawa et al. (2006) T. Shinagawa, M. Izaki, H. Inui, K. Murase, and Y. Awakura, Chem. Mater. 18, 763 (2006).
- Talut et al. (2006) G. Talut, H. Reuther, A. Mücklich, F. Eichhorn, and K. Potzger, Appl. Phys. Lett. 89, 161909 (2006).
- Zhou et al. (2006) S. Zhou, K. Potzger, G. Zhang, F. Eichhorn, W. Skorupa, M. Helm, and J. Fassbender, J. Appl. Phys. 100, 114304 (2006).
- Zhou et al. (2007a) S. Zhou, K. Potzger, G. Zhang, A. Mücklich, F. Eichhorn, N. Schell, R. Grotzschel, B. Schmidt, W. Skorupa, M. Helm, et al., J. Phys. D-Appl. Phys. 40, 964 (2007a).
- Hebard et al. (2004) A. F. Hebard, R. P. Rairigh, J. G. Kelly, S. J. Pearton, C. R. Abernathy, S. N. G. Chu, and R. G. Wilson, J. Phys. D-Appl. Phys. 37, 511 (2004).
- Ohshima et al. (2004) E. Ohshima, H. Ogino, I. Niikura, K. Maeda, M. Sato, M. Ito, and T. Fukuda, J. Cryst. Growth 260, 166 (2004).
- Izyumskaya et al. (2007) N. Izyumskaya, V. Avrutin, U. Özgür, Y. I. Alivov, and H. Morko , Phys. Status Solidi B 244, 1439 (2007).
- Endo et al. (2007) H. Endo, M. Sugibuchi, K. Takahashi, S. Goto, S. Sugimura, K. Hane, and Y. Kashiwaba, Appl. Phys. Lett. 90, 121906 (2007).
- Gao et al. (2006) S. Gao, H. Zhang, R. Deng, X. Wang, D. Sun, and G. Zheng, Appl. Phys. Lett. 89, 123125 (2006).
- Li et al. (2006) W. Li, Q. Kang, Z. Lin, W. Chu, D. Chen, Z. Wu, Y. Yan, D. Chen, and F. Huang, Appl. Phys. Lett. 89, 112507 (2006).
- Fenwick et al. (2007) W. E. Fenwick, M. H. Kane, R. Varatharajan, T. Zaidi, Z. Fang, B. Nemeth, D. J. Keeble, H. El-Mkami, G. M. Smith, J. Nause, et al., Proc. SPIE 6474, 64741Q (2007).
- Matsui et al. (2004) H. Matsui, H. Saeki, T. Kawai, A. Sasaki, M. Yoshimoto, M. Tsubaki, and H. Tabata, J. Vac. Sci. Technol. B 22, 2454 (2004).
- Matsukura et al. (2002) F. Matsukura, H. Ohno, and T. Dietl, Handbook of Magnetic Materials (North-Holland, Amsterdam, 2002).
- Wellmann et al. (1998) P. J. Wellmann, J. M. Garcia, J. L. Feng, and P. M. Petroff, Appl. Phys. Lett. 73, 3291 (1998).
- Yuldashev et al. (2001) S. U. Yuldashev, Y. Shon, Y. H. Kwon, D. J. Fu, D. Y. Kim, H. J. Kim, T. W. Kang, and X. Fan, J. Appl. Phys. 90, 3004 (2001).
- Ramsteiner et al. (2002) M. Ramsteiner, H. Y. Hao, A. Kawaharazuka, H. J. Zhu, M. Kastner, R. Hey, L. Daweritz, H. T. Grahn, and K. H. Ploog, Phys. Rev. B 66, 4 (2002).
- Yokoyama et al. (2006) M. Yokoyama, T. Ogawa, A. M. Nazmul, and M. Tanaka, J. Appl. Phys. 99, 08D502 (2006).
- Sato et al. (2005) K. Sato, H. Katayama-Yoshida, and P. H. Dederichs, Jpn. J. Appl. Phys. 44, L948 (2005).
- Katayama-Yoshida et al. (2007) H. Katayama-Yoshida, K. Sato, T. Fukushima, M. Toyoda, H. Kizaki, V. A. Dinh, and P. H. Dederichs, Phys. Status Solidi. A 204, 15 (2007).
- Liu et al. (2007) K. W. Liu, J. Y. Zhang, D. Z. Shen, X. J. Wu, B. H. Li, B. S. Li, Y. M. Lu, and X. W. Fan, Appl. Phys. Lett. 90, 092507 (2007).
- Jamet et al. (2006) M. Jamet, A. Barski, T. Devillers, V. Poydenot, R. Dujardin, P. Bayle-Guillemaud, J. Rothman, E. Bellet-Amalric, A. Marty, J. Cibert, et al., Nat. Mater. 5, 653 (2006).
- Dietl and Ohno (2006) T. Dietl and H. Ohno, Materials Today 9, 18 (2006).
- Ziegler et al. (1985) J. Ziegler, J. Biersack, and U. Littmark, The stopping and range of ions in matter (Pergamon, New York, 1985).
- Chu et al. (1978) W. K. Chu, J. W. Mayer, and M. A. Nicolet, Backscattering Spectrometry (Academic, New York, 1978).
- Brand (1987) R. Brand, Nucl. Instrum. Methods Phys. Res. B 28, 398 (1987).
- Kucheyev et al. (2003) S. O. Kucheyev, J. S. Williams, C. Jagadish, J. Zou, C. Evans, A. J. Nelson, and A. V. Hamza, Phys. Rev. B 67, 094115 (2003).
- Kucheyev et al. (2002) S. O. Kucheyev, P. N. K. Deenapanray, C. Jagadish, J. S. Williams, M. Yano, K. Koike, S. Sasa, M. Inoue, and K. ichi Ogata, Appl. Phys. Lett. 81, 3350 (2002).
- Kucheyev et al. (2001) S. O. Kucheyev, J. S. Williams, and S. J. Pearton, Mater. Sci. Eng. R33, 51 (2001).
- Coleman et al. (2005) V. A. Coleman, H. H. Tan, C. Jagadish, S. O. Kucheyev, and J. Zou, Appl. Phys. Lett. 87, 231912 (2005).
- Cullity (1978) B. D. Cullity, Elements of X-ray Diffractions (Reading, Addison-Wesley, 1978).
- Zhou et al. (2007b) S. Zhou, K. Potzger, J. von Borany, R. Grötschel, W. Skorupa, M. Helm, and J. Fassbender (2007b), in preparation.
- Liu et al. (1997) C. Liu, B. Mensching, K. Volz, and B. Rauschenbach, Appl. Phys. Lett. 71, 2313 (1997).
- Ronning et al. (2001) C. Ronning, E. P. Carlsonb, and R. F. Davis, Phys. Rep. 351, 349 (2001).
- Respaud et al. (1998) M. Respaud, J. M. Broto, H. Rakoto, A. R. Fert, L. Thomas, B. Barbara, M. Verelst, E. Snoeck, P. Lecante, A. Mosset, et al., Phys. Rev. B 57, 2925 (1998).
- Shinde et al. (2004) S. R. Shinde, S. B. Ogale, J. S. Higgins, H. Zheng, A. J. Millis, V. N. Kulkarni, R. Ramesh, R. L. Greene, and T. Venkatesan, Phys. Rev. Lett. 92, 166601 (2004).
- Farle (2005) M. Farle, in Magnetism goes Nano (Juelich, Germany, 2005), p. C4.2.
- Sun et al. (2003) Y. Sun, M. B. Salamon, K. Garnier, and R. S. Averback, Phys. Rev. Lett. 91, 167206 (2003).
- Tsoi et al. (2005) G. M. Tsoi, L. E. Wenger, U. Senaratne, R. J. Tackett, E. C. Buc, R. Naik, P. P. Vaishnava, and V. Naik, Phys. Rev. B 72, 014445 (2005).
- Jacobsohn et al. (2006) L. G. Jacobsohn, M. F. Hundley, J. D. Thompson, R. M. Dickerson, and M. Nastasi, J. Vac. Sci. Technol. B 24, 321 (2006).
- Batlle and Labarta (2002) X. Batlle and A. Labarta, J. Phys. D-Appl. Phys. 35, R15 (2002).
- Shaw et al. (2006) J. M. Shaw, S. Lee, and C. M. Falco, Phys. Rev. B 73, 094417 (2006).
- Pulwey et al. (2002) R. Pulwey, M. Zolfl, G. Bayreuther, and D. Weiss, J. Appl. Phys. 91, 7995 (2002).
- Zheng et al. (2004) R. K. Zheng, H. Gu, and X. X. Zhang, Phys. Rev. Lett. 93, 139702 (2004).
- Sasaki et al. (2005) M. Sasaki, P. E. Jonsson, H. Takayama, and H. Mamiya, Phys. Rev. B 71, 104405 (2005).
- Chakraverty et al. (2006) S. Chakraverty, B. Ghosh, S. Kumar, and A. Frydman, Appl. Phys. Lett. 88, 042501 (2006).
- Kaidashev et al. (2003) E. M. Kaidashev, M. Lorenz, H. von Wenckstern, A. Rahm, H.-C. Semmelhack, K.-H. Han, G. Benndorf, C. Bundesmann, H. Hochmuth, and M. Grundmann, Appl. Phys. Lett. 82, 3901 (2003).
- Lorenz et al. (2003) M. Lorenz, E. M. Kaidashev, H. von Wenckstern, R. V., C. Bundesmann, D. Spemann, G. Benndorf, H. Hochmuth, A. Rahm, H.-C. Semmelhack, et al., Solid State Electron 47, 2205 (2003).
- Lorenz et al. (2006) M. Lorenz, R. Johne, T. Nobis, H. Hochmuth, J. Lenzner, M. Grundmann, H. P. D. Schenk, S. I. Borenstain, A. Schon, C. Bekeny, et al., Appl. Phys. Lett. 89, 243510 (2006).
- Dietl (2006) T. Dietl, Nat. Mater. 5, 673 (2006).
- Narayan et al. (1998) J. Narayan, K. Dovidenko, A. K. Sharma, and S. Oktyabrsky, J. Appl. Phys. 84, 2597 (1998).
- Kaiser et al. (2002) U. Kaiser, D. Muller, J. Grazul, A. Chuvilin, and M. Kawasaki, Nat. Mater. 1, 102 (2002).
- Potzger et al. (2007) K. Potzger, W. Anwand, H. Reuther, S. Zhou, G. Talut, G. Brauer, W. Skorupa, and J. Fassbender, J. Appl. Phys. 101, 033906 (2007).
- Kolesnik et al. (2004) S. Kolesnik, B. Dabrowski, and J. Mais, J. Appl. Phys. 95, 2582 (2004).