Chemical evolution of high-mass stars in close binaries. II. The evolved component of the eclipsing binary V380 Cygni
Abstract
The eclipsing and double-lined spectroscopic binary V380 Cyg is an extremely important probe of stellar evolution: its primary component is a high-mass star at the brink of leaving the main sequence whereas the secondary star is still in the early part of its main sequence lifetime. We present extensive high-resolution échelle and grating spectroscopy from Ondřejov, Calar Alto, Victoria and La Palma. We apply spectral disentangling to unveil the individual spectra of the two stars and obtain new spectroscopic elements. The secondary star contributes only about 6% of the total light, which remains the main limitation to measuring the system’s characteristics. We determine improved physical properties, finding masses and , radii and , and effective temperatures and K, for the primary and secondary components respectively. We perform a detailed abundance analysis by fitting non-LTE theoretical line profiles to the disentangled spectrum of the evolved primary star, and reveal an elemental abundance pattern reminiscent of a typical nearby B star. Contrary to the predictions of recent theoretical evolution models with rotational mixing, no trace of abundance modifications due to the CNO cycle are detected. No match can be found between the predictions of these models and the properties of the primary star: a mass discrepancy of 1.5 exists and remains unexplained.
keywords:
elemental abundances – spectroscopy: binary stars – stars: binaries: eclipsing – stars: fundamental parameters1 Introduction
The last decade has witnessed a huge improvement in modelling the structure and evolution of stars, particularly for higher masses. The inclusion of effects such as rotation and/or magnetic fields have caused substantial changes in the resulting predictions (see Maeder & Meynet 2000; Langer et al. 2008). Some of these concern evolutionary changes in the chemical composition of stellar atmospheres. Due to the CNO cycle in the core of high-mass stars some elements are enhanced, such as helium and nitrogen, and some are depleted, like carbon and to a lesser extent oxygen. With deep mixing due to rotation, the products of core nucleosynthesis are predicted to be brought to the stellar surface and cause changes in atmospheric abundance patterns. Rotational mixing is so efficient that changes in the atmospheric composition should be identifiable whilst the star is still on the main sequence (MS).
Anomalous abundances of helium and CNO elements have been noticed for many years (Leushin 1988, Lyubimkov 1998), and confirmed in detail by Gies & Lambert (1992), and more recently for helium abundances in B stars by Lyubimkov et al. (2004) and Huang & Gies (2006). However, more ambitious observational studies indicate that the situation is not straightforward. In a survey of OB stars in our Galaxy and the Magellanic Clouds, multi-object spectroscopy for about 750 stars were secured by Evans et al. (2005, 2006). Elemental abundances were separately determined for both slow (Trundle et al. 2007, Hunter et al. 2007) and fast (Hunter et al. 2008, 2009) rotators in the LMC. Since theoretical calculations predict the strongest effect to be the enhancement of the nitrogen abundance (about 0.5 dex up to the terminal age of the main sequence; TAMS), Hunter et al. (2008) examined the abundances of this element in detail. They found a rather complex behaviour: nitrogen enrichment is correlated with projected rotational velocity, but there are some slow rotators with a high nitrogen abundance. Their findings corroborate a recent study by Morel et al. (2006), who analysed a sample of slowly rotating Galactic Cephei stars and found a group with nitrogen enrichment. Importantly, Morel et al. (2006) were able to link this with enhanced magnetic field strengths. It is clear that several physical phenomena and processes affect the surface chemical compositions of high-mass stars, and it is a challenge to disentangle them.
Empirical constraints on these processes remain hard to come by, despite a steady improvement in observational techniques and capabilities (see Hilditch 2004). In this series of papers we aim to calibrate the abundance patterns and chemical evolution of high-mass stars by analysing detached eclipsing binaries (dEBs). These are vital for specifying empirical constraints on the properties of high-mass stars, since they are the primary source of directly measured stellar properties (Andersen 1991). Unfortunately, accurate (2% or better) physical properties are available for only ten dEBs containing 10 stars111An up-to-date compilation of the properties of well-studied dEBs is maintained at http://www.astro.keele.ac.uk/jkt, and only four have observational constraints on their chemical composition. Chemical abundances are difficult to determine for high-mass dEBs for several reasons. Firstly, they tend to display only a small number of spectral lines. Secondly, their often high rotational velocities means the lines are wide and shallow. Thirdly, in dEBs the spectral lines from the two components interfere with each other (‘line blending’).
In a seminal work, Simon & Sturm (1994) introduced the technique of spectral disentangling (spd), by which individual spectra of the component stars of double-lined spectroscopic binary systems can be deduced from observations covering a range of orbital phases. spd can be used to measure spectroscopic orbits which are not affected by line blending (see Southworth & Clausen 2007). The resulting disentangled spectra also have a much higher S/N than the original observations, so are well suited to chemical abundance analyses. As a bonus, the strong degeneracy between effective temperature () and surface gravity () is not a problem for dEBs because surface gravities can be measured directly and to high accuracy (0.01 dex or better). A detailed investigation of these possibilities is given by Pavlovski & Hensberge (2005; hereafter PH05).
1.1 The eclipsing binary system V380 Cygni
V380 Cyg is a very interesting probe of stellar structure and evolution because it contains a primary (star A) which is rather evolved () and a less massive secondary (star B) which is not (). A thorough study by Popper & Guinan (1998) and Guinan et al. (2000, hereafter G2000) disclosed that star A is the more luminous and massive component of the system, lying near the ‘blue hook’ of the MS, and that star B is a 3 mag fainter unevolved MS star. Due to the faintness of star B, V380 Cyg was for many years categorised as a single-lined spectroscopic binary (Batten 1962 and references therein). Hill & Batten (1984) applied cross-correlation techniques to considerably improve the orbital elements. Further advances were possible only by high-resolution and high signal-to-noise (S/N) spectroscopy (Lyubimkov et al. 1996; Popper & Guinan 1998).
The eclipses in V380 Cyg are rather shallow (amplitudes of 0.12 and 0.09 mag) and occur on an orbital period of 12.4 d. The radii of the stars are not determined to high accuracy despite considerable effort spent on securing a precise and complete light curve (G2000). These difficulties have contributed to disagreements over which of the two stars is hotter (Hill & Batten 1984; Lyubimkov et al. 1996; G2000). The best estimate of to date came from fitting ultraviolet and visual spectrophotometry with model atmosphere energy distributions, giving K (G2000). There is also a discrepancy in the derived masses of the components. The two most recent studies gives and (G2000) and and (Lyubimkov et al. 1996).
V380 Cyg has an eccentric orbit and displays the phenomenon of apsidal motion with a rate of degrees per 100 yr (G2000). To match the observed stellar properties to theoretical evolutionary tracks these authors found that a large core-overshooting parameter is required, . In the HR diagram star A is predicted to be located near the blue point of the MS hook. G2000 drew a general conclusion that high-mass stars have large convective cores, so are more centrally condensed than predicted by standard evolutionary theory. However, theoretical work by Claret (2003, 2007) does not corroborate this conclusion, finding instead that for this dEB.
The chemical composition of V380 Cyg, in particular the helium abundances, were studied by Leushin & Topilskaya (1986) and Lyubimkov et al. (1996). Both groups found star A to be enriched in helium and star B to be normal. A major goal of our work is to improve and extend these results, and thus be able to perform a detailed comparison with theoretical stellar models.
2 Spectroscopic data
Star B is barely visible in the optical spectrum of the binary – G2000 estimated the light ratio in the visual band to be . A successful observational programme therefore requires high-resolution and high-S/N spectroscopy. For this study we have secured spectra at four different observatories, using either diffraction grating or échelle spectrographs. Observing logs are given in the Appendix (available in the electronic version of this work).
2.1 Ondřejov spectra
59 spectra of V380 Cyg were obtained at the Astronomical Institute of the Academy of Sciences of the Czech Republic in Ondřejov. The observations were made in the years 2004 to 2007 with the 2 m telescope and the coudé spectrograph. The spectral interval centred on the H line covers about 500 Å at a dispersion of 17 Å/mm, whilst the spectral intervals centred on the H and H lines cover around 250 Å, at a dispersion 8.5 Å/mm.
2.2 Calar Alto spectra
We obtained 43 spectra of V380 Cyg in the course of two observing runs (May and August 2008) at the Centro Astronómico Hispano Alemán (CAHA) at Calar Alto, Spain. We used the 2.2 m telescope, FOCES échelle spectrograph (Pfeiffer et al. 1998), and a Loral #11i CCD binned 22 to decrease the readout time. With a grating angle of 2724, prism angle of 130 and a 150 m slit we obtained a spectral coverage of roughly 3700–9200 Å in each exposure, at a resolving power of . Wavelength calibration was performed using thorium-argon exposures, and flat-fields were obtained using a tungsten lamp. The observing conditions were generally good but several exposures were affected by clouds.
2.3 Victoria spectra
Spectra were obtained with the 1.2 m McKellar telescope and its coudé spectrograph at Dominion Astrophysical Observatory (DAO) with a dispersion of 9 Å/mm. A total of 27 spectra were secured in the region of the H line (6150–6760), mostly in the years 1996–2000. In the present work we have used only the five spectra secured in 2006–2007, as the orbital parameters gradually change due to apsidal motion.
2.4 La Palma spectra
15 spectra of V380 Cyg were obtained in November 2006 with the Nordic Optical Telescope (NOT) and FIES échelle spectrograph (Frandsen & Lindberg 1999) at La Palma. We used the medium-resolution fibre which yielded a resolving power of and a fixed wavelength coverage of 3640–7360 Å. Wavelength calibration was performed using thorium-argon exposures, and flat-fields were obtained using a halogen lamp. The observing conditions were generally reasonable (for winter in La Palma) but several exposures suffered from thin cloud coverage or poor seeing.
2.5 Data reduction
The échelle spectra (from CAHA and NOT) were bias subtracted, flat-fielded and extracted with the iraf222iraf is distributed by the National Optical Astronomy Observatory, which are operated by the Association of the Universities for Research in Astronomy, Inc., under cooperative agreement with the NSF. échelle package routines. Normalisation and merging of the orders was performed with great care, using programs developed by ourselves, to ensure that these steps did not causes any systematic errors in the resulting spectra.
The Ondřejov spectra were reduced by the program spefo (Horn et al. 1996, Škoda 1996). Initial reduction of the DAO spectra (bias subtraction, flatfielding, and spectrum extraction) were carried out in iraf. The wavelength calibrations were based on thorium-argon lamp spectra, and were performed using spefo.
3 Method
Our analysis follows the methods introduced by Hensberge, Pavlovski & Verschueren (2000) and PH05 in their studies of the eclipsing and double-lined spectroscopic binary V578 Mon, and elaborated in Paper I (Pavlovski & Southworth 2009). The core of this approach is reconstruction of individual stellar spectra from the observed composite spectra using spd, which allows a detailed abundance analysis using the same tools as for single stars (c.f. Pavlovski 2004, Hensberge & Pavlovski 2007). spd also gives the velocity amplitudes of the two stars which, in combination with modelling of V380 Cyg’s light curves, yields the physical properties of the two stars including precise and accurate surface gravity measurements which are vital for the abundance analyses.
The method of spd returns the individual spectra of the two components of a binary star, but their normalisation is arbitrary. This is because the continuum light ratio of the two stars is not directly measurable from composite spectra, short of ensuring individual spectral lines do not dip below zero flux. Whilst relative line strengths in a spectrum are reliable, their absolute scaling must be recovered from elsewhere. Here we have renormalised our disentangled spectra using the stellar light ratios found in the light curve analysis (Sec. 5), following the procedure described in detail by PH05, and taking into account the line-blocking inherent to the Fourier disentangling method.
We have estimated chemical abundances by fitting the renormalised disentangled spectra with synthetic spectra. Non-LTE line formation and spectrum synthesis computations were performed using detail and surface (Giddings 1981, Butler 1984) and the model atoms as listed in Paper I. Model atmospheres were calculated with atlas9 (Kurucz 1979). Justification for this hybrid approach can be found in Nieva & Przybilla (2007).
spd can be quite sensitive to the precise phase distribution and continuum normalisation of the observed composite spectra. Hynes & Maxted (1998) have shown that this is not a problem for radial velocity studies, but Hensberge, Ilijić & Torres (2008) have demonstrated that it is important for correct reproduction of the overall shape of disentangled spectra. A lack of significant time-variability in the relative light contributions of the two star can produce spurious patterns in separated spectra, which in practise appear as typically low-frequency continuum variations. Hensberge et al. (2008) examined this in detail and found that the phenomenon arises due to degeneracy of the spd equations and/or bias progression from the observed spectra. Careful planning of an observing run and the subsequent data reduction and analysis can mostly overcome these difficulties, in particular by observing the target during eclipses. In the case of V380 Cyg we were hampered by the relative faintness of the secondary star, but were able to secure spectra with a very good distribution in orbital phase. Combined with a careful data reduction (particularly concerning continuum normalisation and échelle order merging), this approach has allowed us to obtain high-quality disentangled spectra which can be used for abundance analysis.
4 Spectroscopic orbits through spectral disentangling
In the method of spd as introduced by Simon & Sturm (1994), one solves both for the individual spectra of the components, and the optimal set of orbital parameters. Here we have performed a spd analysis in Fourier space as formulated by Hadrava (1995), which has one big advantage. The system of equations consists of coupled equations linear in a little more than , where is the number of observed spectra, and is the number of datapoints per each observed spectrum. Using discrete Fourier transforms this large system of equations can be coupled into systems of complex equations involving only two unknowns in the case of binary systems, and the required computation time is significantly smaller. In this work we have performed spd on a large spectral range about 3000 Å wide, for which the speed advantage of Fourier disentangling is very important. The disadvantage is that weights can be assigned only to whole spectra, and not to individual pixels. We weighted the spectra according to S/N. We use the fdbinary333http://sail.zpf.fer.hr/fdbinary/ code described by Ilijić et al. (2004).
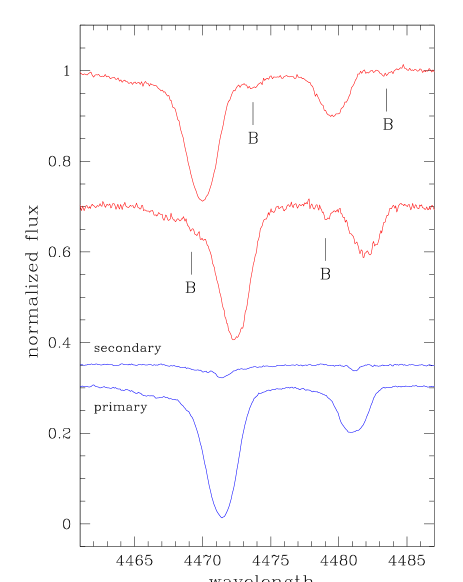
spd was performed in spectral regions centred on the prominent \textHe i lines. The contribution of star B to the total system light is rather small ( in ), and its lines are difficult to see. Fortunately, star B has a similar to star A (Sec. 6), and so is best seen in the \textHe i lines. Star B’s lines also emerge in other regions of its disentangled spectrum, but are very weak so are of limited use for determining orbital elements. We therefore concentrated only on the stronger helium lines. After some trial calculations, we selected six spectral regions centred on the lines at 4026, 4388, 4471 (including \textMg ii 4481), 4712, 4912, and 6670 Å for measuring the orbital elements. We also grouped the spectra into appropriate time intervals to account for the change in due to apsidal motion (amounting to about 6∘ between our first and last spectrum). Table 1 lists the final orbital elements, which are the mean and rms of the values derived from all spectral regions.
| Orbital period (d) | 12.425719 (fixed) |
|---|---|
| Time of periastron passage (HJD) | |
| Velocity amplitude ( km s-1) | |
| Velocity amplitude ( km s-1) | |
| Mass ratio | |
| Orbital eccentricity | |
| Longitude of periastron (∘) |
How does our solution compare to previous results? Batten (1962) made a comprehensive study of all available photographic spectra, and measured the lines of star B for the first time. He found km s-1 and km s-1, which are very close to our values. Hill & Batten (1984) studied existing and new photographic spectra, and found a discrepancy between the systemic velocities of the two stars. Their is about 7 km s-1 larger than Batten’s, which increases the mass of star A from 12.5 to 13.7 . Lyubimkov et al. (1996) collected all available RV measurements for V380 Cyg, including new CCD observation. They found a much smaller of 155.3 km s-1 and a slightly larger of 93.95 km s-1, but gave no uncertainties. The most comprehensive investigation to date is that of Popper & Guinan (1998), based on high-resolution and high-S/N échelle spectra. They adopted the average of their own and Lyubimkov’s solutions, arriving at km s-1 and km s-1. Our own results compare well for , but a discrepancy of 10 km s-1 exists for .
The main source of error in RV measurement by cross-correlation is the selection of the template spectrum. spd bypasses this problem entirely, by directly seeking the best overall solution for both the spectra and the orbital elements. It therefore does not require guidance from a template spectrum, or pass through an intermediate step of obtaining RV measurements from each observed spectrum. An additional advantage of this approach is that it is not biased by line blending. Unfortunately, a dedicated study of error propagation in spd is still lacking, and the best we can do is split our spectra into different sets and different wavelength regions to obtain several independent measurements of the orbital parameters (Table 1). Recently, Southworth & Clausen (2007) have performed an extensive analysis of orbits derived by double Gaussian fitting, cross-correlation, and spd. The spd orbits were the most internally consistent, followed by double Gaussian fitting. The cross-correlation results were affected by line blending, even after attempts were made to correct for this. Southworth & Clausen (2007) noticed that their spd solutions had several local minima around the best fit, and used a grid search to deal with this.
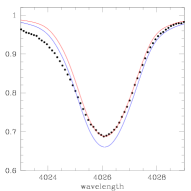
We therefore ascribe the 10 km s-1 discrepancy in to line blending in the cross-correlation solutions. Our was found by spd, which does not suffer from line blending or template errors, and should be preferred. Finally, as line blending is not a problem for spd, we could use all of our spectra rather than just those where the lines of the two stars are resolved. Disentangled profiles of the \textHe i 4471 and \textMg ii 4481 lines are shown in Fig. 1.
5 Light curve analysis
Driven by suspicions that the secondary star of V380 Cyg might be hotter than the primary star (see below), we have revisited the light curves presented by G2000. These data were obtained using the Automated Photometric Telescopes at Mt. Hopkins, Arizona, and total 870 observations in the bandpasses.
The light curves show substantial ellipsiodal modulation and reflection effect, so we have used the Wilson-Devinney (wd) code (Wilson & Devinney 1971; Wilson 1979, 1993), which implements Roche geometry and a detailed treatment of reflection and other physical phenomena, version of 2004/02/06. We have modified wd to automatically converge to the best solution using either a damped version of the standard differential corrections procedure (dc) or the robust downhill simplex algorithm amoeba (Press et al. 1992). For our final solutions we used dc and iterated until all parameter corrections were less than half of their formal errors.
The full set of fixed and control parameters are given in Table 2: for our modelling we adopted the orbital ephemeris from G2000, bolometric albedos and gravity brightening exponents appropriate for radiative atmospheres (Claret 1998, Claret 2001) and pseudosynchronous rotation for both stars. Using the detailed reflection technique of Wilson (1990) did not substantially improve the fit and much increased the calculation time, so was not used.
The treatment of limb darkening can be important, and there is evidence that theoretically predicted coefficients are imperfect (Southworth 2008; Southworth et al. 2009). We therefore included limb darkening in three different ways: using coefficients obtained by bilinear interpolation in the tables of Van Hamme (1993) or Claret (2000), or including the coefficients as fitted parameters. The solutions show a negligible dependence on the way limb darkening is accounted for, probably because the eclipses are quite shallow compared to the observational scatter. For our final solutions we used the linear limb darkening law and fixed the coefficients at the Van Hamme (1993) values (Table 2).
| Parameter | wd name | Star A | Star B |
|---|---|---|---|
| Orbital period (d) | period | 12.425719 | |
| Reference time (HJD) | hjd0 | 2441256.544 | |
| Mass ratio | rm | 0.5916 | |
| Stellar s (K) | tavh, tavc | 21 500 | 22 000 |
| Rotation rates | f1, f2 | 1.0 | 1.0 |
| Stellar albedos | alb1, alb2 | 1.0 | 1.0 |
| Gravity darkening | gr1, gr2 | 1.0 | 1.0 |
| Numerical accuracy | n1, n2 | 60 | 30 |
| Bolometric LD coefficient | xbol1, xbol2 | 0.6475 | 0.6854 |
| LD coefficient | x1, y1 | 0.3582 | 0.3128 |
| LD coefficient | x1, y1 | 0.3534 | 0.3026 |
| LD coefficient | x1, y1 | 0.3043 | 0.2622 |
5.1 The effective temperatures
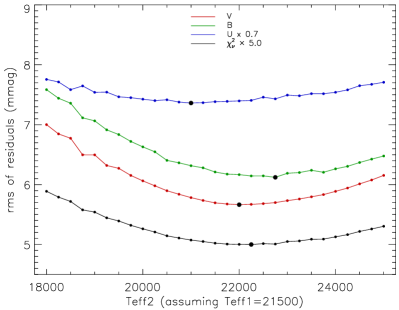
The light curves of dEBs contain almost no information about the absolute s of the component stars: only the ratio of the s is directly derivable from normal light curves. One of our goals was to investigate the quality of solutions where star B was hotter than star A. For one set of solutions we therefore fixed K and then fixed to values between and K in steps of K. The best fit was found for each , and for the three light curves both individually and in combination. Fig. 2 is a plot of the quality of the fits for these solutions, and shows a preference for solutions with .
5.2 Final light curve solutions
| Parameter | wd name | Combined | Adopted | ||||||||
|---|---|---|---|---|---|---|---|---|---|---|---|
| Star A potential | phsv | 4.698 | 0.073 | 4.541 | 0.030 | 4.587 | 0.039 | 4.609 | 0.029 | 4.609 | 0.046 |
| Star B potential | pcsv | 10.75 | 0.25 | 10.51 | 0.14 | 10.26 | 0.14 | 10.51 | 0.12 | 10.51 | 0.17 |
| Orbital inclination (°) | xincl | 80.76 | 0.58 | 80.63 | 0.17 | 81.25 | 0.31 | 81.01 | 0.21 | 81.01 | 0.27 |
| Orbital eccentricity | e | 0.2207 | 0.0042 | 0.2023 | 0.0021 | 0.1831 | 0.0017 | 0.1979 | 0.0017 | 0.198 | 0.012 |
| Periastron longitude (°) | perr0 | 136.5 | 2.7 | 140.3 | 1.7 | 150.1 | 2.1 | 143.2 | 1.5 | 143.2 | 5.3 |
| Phase shift | pshift | 0.0459 | 0.0009 | 0.0460 | 0.0004 | 0.0480 | 0.0004 | 0.0470 | 0.0004 | ||
| -band light from star A | hlum | 12.008 | 0.046 | 12.055 | 0.027 | 12.055 | |||||
| -band light from star B | clum | 0.734 | 0.045 | 0.697 | 0.026 | 0.697 | |||||
| -band light from star A | hlum | 9.443 | 0.023 | 9.447 | 0.025 | 9.447 | |||||
| -band light from star B | clum | 0.618 | 0.022 | 0.611 | 0.024 | 0.611 | |||||
| -band light from star A | hlum | 9.823 | 0.024 | 9.805 | 0.025 | 9.805 | |||||
| -band light from star B | clum | 0.619 | 0.023 | 0.635 | 0.025 | 0.635 | |||||
| Fractional radius of star A | 0.2563 | 0.2660 | 0.2615 | 0.2609 | 0.2609 | 0.0040 | |||||
| Fractional radius of star B | 0.06391 | 0.06538 | 0.06701 | 0.06534 | 0.0653 | 0.0013 | |||||
| -band rms of residuals (mmag) | 10.386 | 10.524 | |||||||||
| -band rms of residuals (mmag) | 5.964 | 6.130 | |||||||||
| -band rms of residuals (mmag) | 5.782 | 5.635 | |||||||||
We have obtained final solutions for the light curves both individually and in combination, using our damped version of dc to optimise the fits. wd allows the use of predictions from Kurucz (1993) model atmospheres to link the flux ratios in different passbands, which means the results have a dependence on theoretical models. We prefer to avoid this option (mode0 and ipb1; Wilson & Van Hamme 2004), particularly as the available data are multi-band and include the very blue passband. We therefore fit for the light contribution of each star in each passband independently, after assuming reasonable s with which the limb darkening coefficients are derived.
We fixed K and K, and then fitted for the potentials of the two stars, the orbital inclination, eccentricity and periastron longitude, a phase shift, and the light contributions of the two stars in each passband. Additional light from a third star was not considered (see G2000).
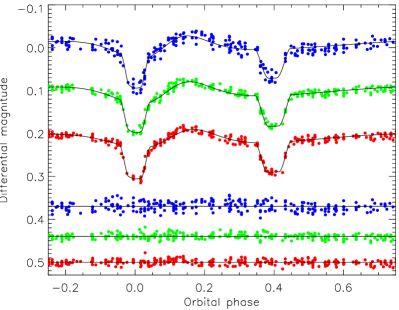
The three light curves were fitted together to give the final parameter values, and then individually to check for consistency. In Table 3 we report the fitted parameters and their formal errors (calculated by dc from the covariance matrix), and in Fig. 3 we show the fits to the data. The volume-equivalent fractional radii of the two stars were obtained using the wd lc program.
We caution that the formal errors can be optimistic when there are strong correlations between parameters, so should be considered with care. Taking the formal errors at face value indicates poor agreement between light curves, with reduced values of 4.2 and 3.4 for the stellar potentials, 3.4 for the inclination and a huge 96.9 and 19.7 for and . This highlights the limitations of formal errors, as and are strongly correlated in situations such as this one (e.g. Southworth et al. 2004, 2007). For our final light curve parameters we instead adopt the values from the combined fit to the three light curves and the uncertainties from the scatter between the separate solutions for these light curves.
6 Spectral analysis of both components
A model atmosphere is defined to first order by its and , and when fitting observational data these two parameters can be quite correlated. This can be a major limition for abundance analyses of single stars, but in the case of dEBs it is possible to accurately measure their s from light and velocity curve analysis. In the case of V380 Cyg we have measured and (Sec. 7).
6.1 Effective temperature determination
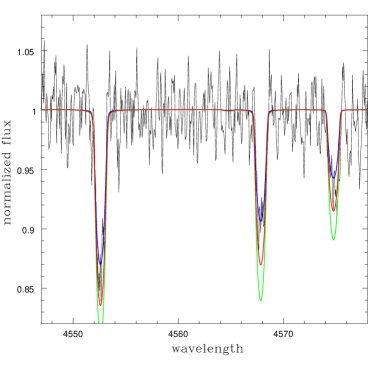
The s of B stars are best determined from the silicon ionisation balance (Becker & Butler 1990). Lines of \textSi ii and \textSi iii are present in the disentangled spectrum of V380 Cyg A – the lack of \textSi iv lines indicates that K. Grids of synthetic spectra were calculated for – K and for . Equivalent widths (EWs) were measured in iraf for the \textSi ii ( 4128, 4130, 5031) and \textSi iii ( 4552, 4567, 5039) lines, and calibration curves produced for \textSi ii/\textSi iii EW ratios. EW measurements were made for star A and a mean value of K was found from six EW ratios. Absolute EWs can only be measured from disentangled spectra once they have been carefully renormalised, but the ratios of EWs are reliable.
| Run | Parameter | H | H | H | Mean | Difference |
|---|---|---|---|---|---|---|
| 1 | 21 96085 | 22 27070 | 21 86055 | 22 030210 | 280 | |
| 0.0037144 | 0.0036232 | 0.0038175 | - | |||
| 2 | 21 85055 | 21 69031 | 21 80045 | 21 78080 | 30 | |
| 3.1210.034 | 3.1250.031 | 3.1230.030 | 3.1230.030 | 0.008 | ||
| 0.0025443 | 0.0023554 | 0.0027782 | - | |||
| 3 | 21 83070 | 21 62080 | 21 97075 | 21 76443 | 14 | |
| 0.95410.0021 | 0.94710.0034 | 0.94870.0029 | 0.95120.0015 | 0.0118 | ||
| 0.0019254 | 0.0018643 | 0.0020095 | - | |||
| 4 | 21 92095 | 21 89090 | 21 84595 | 21 88554 | 135 | |
| 3.1220.005 | 3.1290.007 | 3.1390.004 | 3.1360.003 | 0.005 | ||
| 0.96770.0026 | 0.95010.0041 | 0.96750.0031 | 0.96430.0018 | 0.0249 | ||
| 0.0015442 | 0.0015135 | 0.0016024 | - |
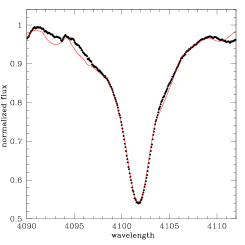
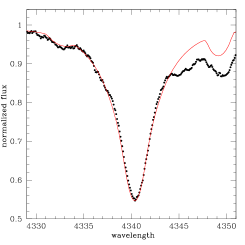
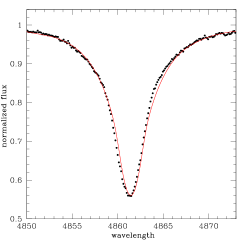
A second way of measuring s of B stars is to study the shape of the hydrogen Balmer lines. The usual degeneracy between and is not a problem here, as the values of the stars are known, but this method does require a careful renormalisation of the disentangled spectra. We used light factors derived from the light curve analysis (Sec. 5), whose variation with wavelength is small in the region covered by H, H and H. We avoid H since it is formed high in the stellar atmosphere and is not a good indicator. The fitting was done with a routine for multi-parameter optimisation, which uses a genetic algorithm to minimise (Tamajo et al. 2009). The projected rotational velocity was fixed to km s-1 (Sec. 6.2). Runs were performed in which just (run 1) or both and (run 2) were optimised. The results are tabulated in Table 4 and compared to the observed spectra in Fig. 4.
We also tested the inclusion of the light factor as a fitted parameter (using the separated but not renormalised spectrum) with encouraging results (run 3 and run 4 in Table 4). This suggests that it is possible to reliably estimate s using disentangled spectra for SB2 systems which are not eclipsing (so do not have well-determined light contributions from their component stars through eclipse analysis), which is a very interesting possibility. The results also corroborate the light contributions found in Sec. 5.
The two methods agree reasonably well on the value of , although the difference is slightly larger than 1 for run 1. Possible sources of systematic error include the placement of the continuum for the EW measurements (particularly for the weak \textSi ii 4218 and 4231 lines), blending between \textSi ii 4231 and \textO ii 4233, and undulations in the continuum in the region of the (wide) Balmer lines. Systematic errors could also arise from the adopted atomic data (both in the statistical equilibrium calculations and in the spectral synthesis) and in the LTE assumptions of spatial homogenity, plane parallel geometry, radiative and hydrostatic equilibrium, etc. However, a study of B-type supergiants by Trundle et al. (2004), using sophisticated non-LTE analyses, yielded measurements in good agreement with the calibration of Dufton et al. (2000), which uses assumptions similar to those listed above. Despite this, and the generally good ageement we find between the s obtained in different ways, we have to be cautious as it is difficult to quantify the size of the systematic errors. We note that the high precison of our values comes partly from having accurate and precise values for the two stars. As the final we adopted K where error accounts for the determination of from hydrogen line profiles, also.
6.2 Microturbulence and projected rotational velocity
We have estimated the microturbulence velocity, , by requiring that the measured abundance of a chemical element does not depend on the strength of its lines: the slope of a plot of EW versus abundance should be zero. The \textO ii lines are the most numerous in the spectrum of star A, allowing us to use 32 lines for measuring . We find km s-1, which is relatively high but not unusual for evolved stars with (Hunter et al. 2007, Morel et al. 2006). It is encouraging that G2000 derived km s-1 using a completely different approach.
The difficulty of determining has been discussed recently by Hunter et al. (2008). For B stars, the rich spectrum of the \textO ii ion is often used for this purpose. Uncertainties can arise between different multiplets due to errors in the adopted atomic data or in the strength of non-LTE effects, so using a single \textO ii multiplet is best. Dufton et al. (2005) preferred the \textSi iii 4560 triplet, and this approach was adopted by Hunter et al. (2008) in a large VLT-FLAMES survey of B stars. We have also tried this approach, and found almost the same value, km s-1, as above. The use of an alternative oxygen multiplet at 4072, 4076 and 4079 Å was less successful as the 4079 line is weak and so made very shallow by rotational broadening. Therefore, an error in of km s-1 would be more realistic.
The projected rotational velocities () of the components of V380 Cyg were derived from the widths of several clean spectral features: \textC ii 4267, \textSi iii 4552, \textSi iii 4567, \textO ii 4591, \textO ii 4596, and \textO ii 4662; and avoiding \textHe i and \textMg ii lines (Hensberge et al. 2000). We compared the observed line profiles to a set of theoretical spectra calculated for different values. We find km s-1. The small errorbar is due to the very good agreement between the observed and calculated line profiles, and also the very high S/N (about 1000) in the disentangled spectrum of star A.
6.3 Helium abundance
 |
 |
 |
 |
 |
 |
 |
 |
 |
 |
| Line (Å) | (He) | (He) |
|---|---|---|
| This work | LRR96 | |
| 4026.2 | - | |
| 4387.9 | 0.123 | |
| 4437.6 | - | |
| 4471.5 | 0.153 | |
| 4713.2 | 0.212 | |
| 4921.9 | 0.145 | |
| 5015.7 | (0.286) | |
| 5047.7 | - | |
| 5875.7 | () | |
| 6678.1 | () | |
| mean |
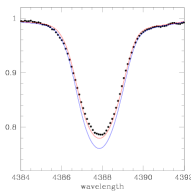
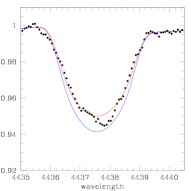
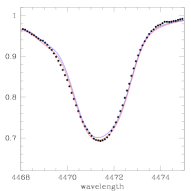
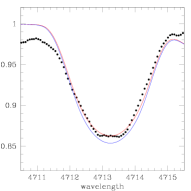
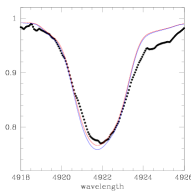
V380 Cyg A has been classified as spectral type B2 III, in agreement with the and we find here. In B2 stars lines of neutral helium are very strong, while lines of ionised helium are completely absent. We therefore calculated profiles of \textHe i lines using the non-LTE codes detail and surface (see Paper I for details), for helium abundances – in steps of 0.05. The synthetic spectra were broadened by km s-1 and km s-1, and was determined by minimisation to the disentangled and renormalised spectrum. The results for ten \textHe i lines are given in Table 5. The lines of \textHe i at 4009.3 and 4120.8 were not used: our model atom does not include the first line and the second is severely blended with \textO ii 4121.1. The resulting mean value for the helium abundance in the photosphere of star A is , which is slightly above the solar value [; Grevesse et al. (2007)]. The helium abundances found from different \textHe i lines span a range 0.07–0.16 (from subsolar to 80% above solar abundance) and such a large spread needs explaining.
Firstly, the 4471 and 4922 line calculations are more precise as they include transitions up to the level (Przybilla & Butler 2001). Lyubimkov, Rostopchin & Lambert (2004, hereafter LRL04) discuss this in detail, and also show that the other two diffuse \textHe i lines (4026 and 4388) give a systematically lower helium abundance. LRL04 selected the 4471 and 4922 lines as their principal helium abundance indicators for B stars. For V380 Cyg A the mean helium abundance (by number of atoms) is from 4026 and 4388 whereas we find (equalling the solar value) from 4471 and 4922. This corroborates the findings by LRL04.
Secondly, the varying sensitivity of \textHe i lines to might cause abundance discrepancies. In this work we found from \textO ii lines, which are the most numerous lines in the spectrum of star A. The recent literature contains some discussion about whether the derived from helium lines should equal that found from metallic lines such as \textO ii, \textN ii and \textSi iii (see Hunter et al. 2007 and references therein). LRL04 found that derived from helium lines is systematically larger than that derived from metallic lines. Contrary to this, during our work on V453 Cyg (Paper I) we simultaneously fitted the helium line profiles for abundance and , finding a high and a substantially lower than those from \textO ii lines. We rejected this possibility and instead fixed to the 14 km s-1 measured from the \textO ii lines, which resulted in a normal helium abundance.
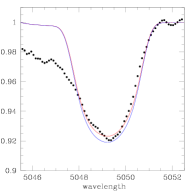
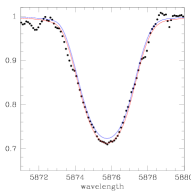
The other lines listed in Table 5 ( 4713, 5016, 5048, 5876 and 6678) are known to have substantial dependences on . Moreover, the last two lines are unusually broad when comparing to other helium lines (Fig. 5) which indicates that other (non-thermal) broadening mechanisms are present. V380 Cyg A has evolved to the giant stage, and one could expect differences in the atmospheric velocity field compared to dwarf stars. LRL04 have discussed the possibility that asphericity and/or mass loss high in the atmospheres of hot B giants could cause excess broadening for some helium lines. (Herrero, Puls & Villamariz 2000). Moreover, they have estimated that the 5875 and 6678 lines would give the largest helium abundances, in agreement with our findings. We will discuss this further in Sec. 8.
Thirdly, it is possible that the atmosphere of star A is stratified in helium. Catanzaro (2008) has argued that variations in helium abundance derived from different lines can be explained by helium stratification. A comparison of his results (for the B2 V star HD 32123) with ours (Table 5) reveals the same trends from line to line. However, a more detailed investigation of this phenomenon will require state-of-the-art non-LTE model atmospheres.
6.4 CNO abundance
| Element | Abundance | OB stars | Solar |
|---|---|---|---|
| (He)/(H) | 0.0980.010 [10] | 0.0980.014a | 0.0930.002 |
| 8.210.03 [8] | 8.000.19 | 8.390.05 | |
| 7.520.10 [24] | 7.620.12 | 7.780.06 | |
| 8.540.14 [35] | 8.630.16 | 8.660.05 | |
| 7.520.05 [1] | 7.250.17 | 7.530.09 | |
| 7.260.18 [13] | 7.420.07 | 7.510.04 | |
| 6.040.03 [4] | 5.940.14b | 6.370.04 |
Derived for unevolved B stars by Lyubimkov et al. (2004)
Derived for B stars with K by Daflon et al. (2003)

The surface abundances of helium and the CNO elements are important observational results for comparison with theoretical predictions, because models including rotational effects predict an enrichment of He and N and a depletion of C and O during the evolution of B stars. The optical spectra of these objects are rich in O and N lines, but have fewer C lines. We determined and the oxygen abundance in Sec. 6.2, by fitting synthetic spectra to the observed disentangled spectra of star A. Using the same approach for C and N gives results which show relatively low scatter between lines. The model carbon atom we used cannot reprode the strongest line (\textC ii 4267), but the abundance estimates for the fairly strong doublet on the red wing of H (6556 and 6559) are consistent with the abundances from other C lines.
In the spectral range 4635–4655 Å there is a bunch of relatively strong \textO ii, \textC ii and \textN ii lines, which can provide reliable estimates and checks on the derived abundances for these elements (Pavlovski & Hensberge 2005). In Fig. 6 we show that there is good agreement between the disentangled spectrum of star A and a theoretical spectrum calculated for the abundances derived from unblended lines (Table 6).
N is more sensitive to changes in abundances than C, for which only minute changes are predicted. However, a large spread in N abundances have been found for MS B stars, and mechanisms other than rotational mixing may be responsible (Morel et al. 2006, Hunter et al. 2009). This is highlighted by the [N/C] ratio, which is a robust indicator of CNO-processed material dredged up to the stellar surface. Its distribution in B stars is clearly bimodal (Morel 2008), with one subgroup around the solar value ([N/C] dex), and one with significantly higher values, ([N/C] dex). With [N/C] dex, V380 Cyg A is close to the solar value. This is also true for the [N/O] ratio ([N/O] dex and [N/O] dex).
6.5 Magnesium, silicon and aluminium
Determination of the abundances of metals like Mg, Si and Al makes possible an estimate of the bulk metallicity of B stars. These elements do not participate in the CNO cycle so their abundances are not affected by MS evolution. In particular, Mg is an excellent metallicity indicator because its solar and meteoritic abundances are know with high accuracy.
A disadvantage in the use of Mg for metallicity estimates in B stars is that there is only one suitable spectral line in the whole optical region: \textMg ii 4481.2; although this is one of the strongest lines in the spectra of early-type stars. For stars with moderate and high an analysis of this line is complicated by blending with the neighbouring \textAl iii 4479.9 line. In the range of interest here, the \textAl iii 4479.9 line reaches its maximum strength, and the ratio of the \textAl iii and \textMg ii line EWs reaches a maximum (see Lyubimkov et al. 2005).
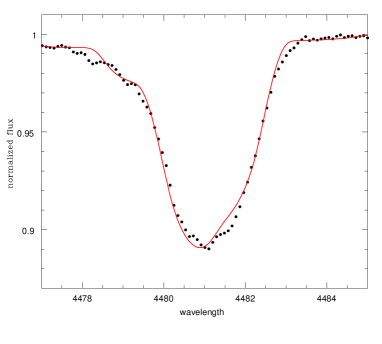
We derived the Al abundance for star A from three lines ( 4512, 4671, 5766), finding a very good agreement. We used this measurement in calculating the Mg abundance from the \textAl iii and \textMg ii blend at 4481 Å. We find , which translates to a metallicity index of [Mg/H] . Fig. 7 shows the fit of the synthetic spectrum to the data for this spectral line blend.
G2000 found a subsolar metallicity for star A ([M/H] ) by fitting the system’s spectral energy distribution. Elemental abundances in the present work are derived from non-LTE line profile calculations, while G2000 used theoretical spectra generated in the LTE approximation. This might explain the disagreement between the two results.
6.6 Secondary star
Despite its faintness and small contribution to the total flux of the system, our application of spd readily revealed the spectrum of star B (Fig. 1). Its light contribution, determined from the light curve analysis (Sec. 5), is 6.1% in and 5.9% in . To renormalise its disentangled spectrum to a continuum level of unity we have multiplied it by 16.4 and 16.9, respectively. With typically 55 spectra available for disentangling for a given spectral range, with average S/N 150, the reconstructed spectrum of star B has S/N 45. This is enough to check its , but too low for a detailed abundance study.
Theoretical spectra were synthesised with – K and . Only strong \textHe i lines, \textMg ii 4481 and the \textSi iii 4550–4580 triplet were considered in the minimisation. The mean value from eight spectral lines gives K, which is consistent within the uncertainties with and the ratio inferred from the light curve analysis.
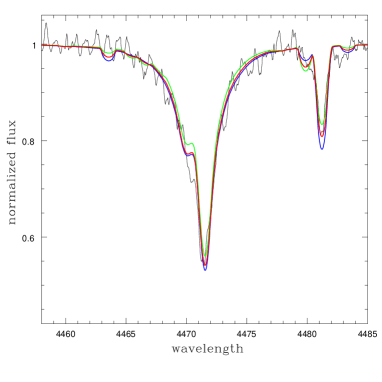
In Fig. 8 we compare the disentangled spectrum of star B to theoretical spectra for two wavelength intervals, covering \textHe i 4471 and \textMg ii 4481 and the \textSi iii triplet. The synthetic spectra were generated using the He, Mg and Si abundances found for star A. Further progress would require a substantial increase in the S/N, and thus extensive new observations.
7 The physical properties of V380 Cyg
| Star A | Star B | |||
| Semimajor axis () | ||||
| Mass () | 13.13 | 0.24 | 7.779 | 0.095 |
| Radius () | 16.22 | 0.26 | 4.060 | 0.084 |
| ( cm s-2) | 3.136 | 0.014 | 4.112 | 0.017 |
| Effective temperature (K) | 21 750 | 280 | 21 600 | 550 |
| 4.73 | 0.028 | 3.51 | 0.040 | |
| (mag) | 7.06 | 0.06 | 4.03 | 0.10 |
| ( km s-1) | 98 | 2 | 43 | 4 |
| ( km s-1) | 66.1 | 1.1 | 16.54 | 0.34 |
| Extinction (mag) | ||||
| Distance using Flower -band BCs (pc) | ||||
| Distance using Bessell -band BCs (pc) | ||||
| Distance using Bessell -band BCs (pc) | ||||
| Distance using Girardi -band BCs (pc) | ||||
| Distance using Girardi -band BCs (pc) | ||||
Armed with the velocity amplitudes determined in Sec. 4 and the results of the light curve analysis from Sec. 5 we can determine the physical properties of the component stars of V380 Cyg (Table 7). For this we use the jktabsdim code (Southworth et al. 2005), which propagates the uncertainties on the input quantities via a perturbation analysis. The resulting error budget is dominated by the photometric parameters, highlighting the importance of obtaining a new light curve for this difficult object. Even without this, the masses and radii of the component stars are now known to accuracies of 2% or better so are good enough for detailed tests of stellar evolution theory. We also find that V380 Cyg has not attained either orbital circularisation or rotational synchronisation.
 |
 |
 |
 |
 |
 |
With the s determined above, we have found the distance to V380 Cyg via the bolometric correction (BC) method. Empirical BCs were obtained from Flower (1996), and theoretical ones from Bessell et al. (1998) and Girardi et al. (2002). We adopted magnitudes from the Tycho catalogue (Høg et al. 1997) and magnitudes from 2MASS (Skrutskie et al. 2006). There is good agreement between different sources of BCs (Table 7). Using the Girardi et al. (2002) BCs, which are available for a wide range of passbands, we find that a reddening of is needed to obtain consistent distances at optical and infrared wavelengths. For our final value we adopt a distance of pc, from -band BCs. This is in good agreement with but more precise than the value of pc found by G2000.
8 Probing the models
The two components of V380 Cyg have very different masses and radii, and thus evolutionary stages, so are a very good test of theoretical stellar models. The accuracies of the mass and radius measurements is generally 2%, limited by the quality of the available light curves and the faintness of the secondary star in our spectra. A comparison with models is helped by our abundance analysis. Of particular interest is the effect of rotation on the evolution of massive stars, for which predictions are now available from Heger, Langer & Woosley (2000), Heger & Langer (2000) and Meynet & Maeder (2000). These authors found that it makes a star of a given mass more luminous and longer-lived. The models also predict changes in the surface chemical composition in the sense that He and N become enriched whilst C and O are depleted. These changes are stronger for higher masses and/or initial rotational velocities.
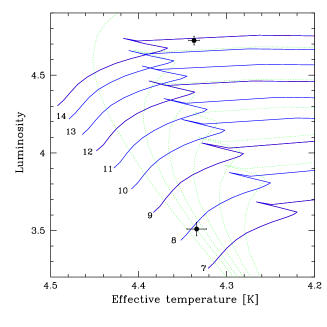
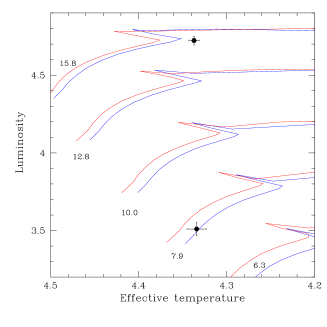
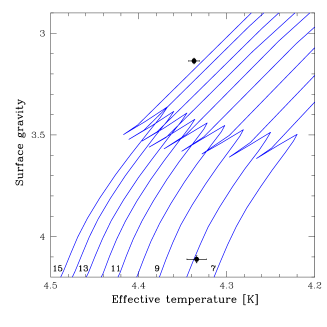
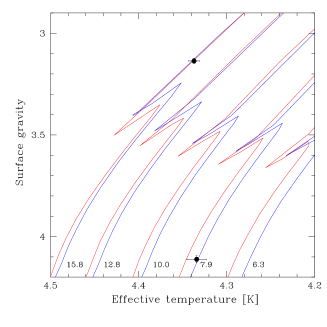
To our knowledge, the only study which compares rotational evolutionary models with empirical data on high-mass stars in close binaries is that of Hilditch (2004). There is a known discrepancy between masses inferred from the location in the HR diagram relative to the model evolution tracks, and dynamically determined masses (Herrero et al. 1992). Hilditch found that the discrepancy did not disappear when rotating stellar models were used. We begin our comparison against V380 Cyg with the models of Schaller et al. (1992) and Claret (1995) for solar metallicity (), moderate overshooting () and no rotational effects. Both good and bad agreement is seen for the Schaller models (Fig. 9, left panels): star A is overluminous for its mass, whereas the predictions for star B perfectly match its position. From the isochrones (green dotted lines) we estimate the age of the stars to be Myr. A similar situation occurs for the Claret models (Fig. 9, centre panels) for a metal abundance of , whilst the models for fail to match both stars. In the diagram the situation is the same: the models can match star B but strongly disagree with the properties of star A.
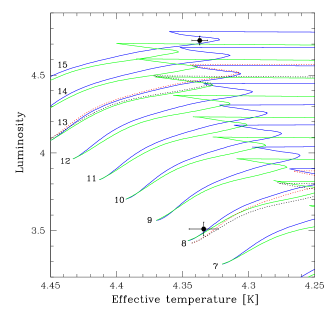
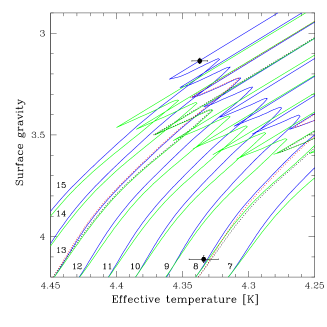
Fig. 9 (right panels) compares evolutionary models including rotational effects with the observed properties of V380 Cyg. We interpolated in the tables published by Geneva group444http://obswww.unige.ch/Recherche/evol/tables_rotzams/ (Ekström et al. 2008). The models are parametrised by the ratio of the rotational velocity to the critical velocity, . The models for (green tracks), and (blue tracks) both fail to match the luminosity of star A. The discrepancy amounts to about 1.5. Star B is also slightly above evolutionary tracks for its mass (dotted lines), but agrees within the errorbars. The diagram reveals the same story. It is interesting to note that in rotational evolution models the position of star A is around a critical evolutionary stage. Since rotational mixing extends the MS lifetime of high-mass stars, depending on initial rotational velocity, star A is either in the hydrogen-shell-burning phase or just at the ‘blue hook’ at the TAMS.
Further insight into V380 Cyg’s evolution comes from its photospheric chemical composition. We interpolated in the Ekström et al. (2008) tables to the mass of star A. For ( km s-1) the increase in the photospheric helium abundance at the end of core H-burning is 0.5%, whilst N/C 0.69 and N/O 0.24. Increasing to gives a helium enhancement of 6%, and a further increase in N at the expense of C and O (N/C 1.12 and N/O 0.40). Our analysis of the helium abundance in star A’s photosphere (Sec. 6.3), gives a solar value, and we concluded that no enrichment is observed. Also, abundances of CNO elements (Sec. 6.4) give N/C 0.25 and N/O 0.11 which is exactly the initial (ZAMS) values for the models. The photospheric chemical composition appears to be untouched even though the star has reached the end of the core H-burning phase. Models for , 0.30 and 0.50 at TAMS would have rotational velocities of about 20, 80 and 160 km s-1, respectively. Since star A’s rotational velocity is now 100 km s-1 we interpolated in the tables to find that at the TAMS a 13.13 model predicts N/C 0.40 and N/O 0.14, while initial values for this model are (N/C) 0.30 and (N/O)ini 0.11. The later ratio is exactly what we found for star A, whilst no changes are observed in N/C ratio. We conclude that no changes in the abundances of the CNO elements were detected, which is contrary to model predictions.
Why might this be? The evolution of stars in close binaries can be modified by several effects. In particular, tides affect their rotational velocities and so the efficiency of rotational mixing. This has been studied theoretically using detailed calculations by De Mink et al. (2009), but unfortunately only for masses larger than V380 Cyg A. De Mink et al. found large N enhancements for the shortest-period binaries, for which rotational velocities are the highest, and for high-mass primary stars which are close to filling their Roche lobes. But, for the relatively long orbital period of V380 Cyg, 12.4 d, surface abundance changes would be small (and probably too small for us to have detected). We hope that future models will extend to the parameter space occupied by V380 Cyg, allowing a direct comparison between observation and theory.
9 Summary
We have presented a study of the eccentric eclipsing and double-lined spectroscopic binary V380 Cyg. The system is particularly interesting because it contains an evolved star which is at the TAMS, so is ideal for probing theoretical evolution models which include rotationally induced mixing.
New high-resolution and high-S/N spectra were secured at several telescopes, and a spectral disentangling technique was applied to obtain the individual spectra of the components, and to (simultaneously) derive the spectroscopic orbit. Although the secondary star contributes only a very small fraction of the system light (6%), we were able to attain a much higher precision than previously achieved. Coupled with a reanalysis of the existing light curves of this system, we have determined the masses and radii of the two stars to accuracies of 1–2%. The light ratios found in the light curve analysis also allowed the disentangled component spectra to be accurately renormalised to the continuum level. These spectra were used to derive the effective temperatures of the two stars using two independent methods, helped by the accurate surface gravity values obtained from their known masses and radii.
The spectrum of V380 Cyg is dominated by the primary star, and its disentangled spectrum has a S/N approaching 1000 per pixel and a wavelength coverage of 3900–7000 Å. We performed a detailed abundance analysis by fitting non-LTE spectra to the observed line profiles. We found no abundance excesses for helium or metallic species, and in fact the abundances are those of a typical B star. The helium abundance analysis showed a broad range of values from different lines, which we attribute to the failure of calculations for the lines formed higher in the photosphere due to the asphericity of the star. This problem deserves to be investigated further. It also remains possible that helium stratification might be the cause.
We have compared the bulk properties of V380 Cyg to theoretical calculations from stellar models both with and without rotational effects. No set of models fully satisfies the observations, as the primary is always overluminous for its measured mass. We are still faced with well-known discrepancy between masses inferred from evolutionary models and those which have been dynamically measured. The mass discrepancy amounts to about 1.5 for models including rotational evolution, and about 2.5 for models which include only core overshooting, even though we have revised the mass of V380 Cyg A upwards by a substantial amount. The surface chemical composition of high-mass stars should be an important probe of theoretical models. Recent model calculations which account for rotationally induced mixing predict changes in the abundances of elements involved in the CNO cycle in high-mass stars: helium and nitrogen should be enriched and carbon and oxygen depleted (strongly depending on the mass and initial rotational velocity). For a 13 star all available models predicted changes at the end of core hydrogen burning, but the abundance pattern we derived in this work resembles that of a star at the ZAMS. We can conclude only that a detailed analysis performed for V380 Cyg A does not corroborate theoretical predictions of the chemical evolution of high-mass stars. We are currently engaged in extending the sample of close binaries for which such comparisons can be made.
Acknowledgements
Based on observations collected at the Centro Astronómico Hispano Alemán (CAHA) at Calar Alto, operated jointly by the Max-Planck Institut für Astronomie and the Instituto de Astrofísica de Andalucía (CSIC), and on observations made with the Nordic Optical Telescope, operated on the island of La Palma jointly by Denmark, Finland, Iceland, Norway, and Sweden, in the Spanish Observatorio del Roque de los Muchachos of the Instituto de Astrofisica de Canarias. We would like to thank several colleagues for obtaining spectra of V380 Cyg at the 2 m telescope in Ondřejov: M. Šlechta, J. Polster, M. Ceniga, M. Netolický, P. Škoda, V. Votruba, P. Hadrava, D. Korčáková, J. Libich, K. Uytterhoeven, B. Kučerová and J. Kubát. We acknowledge a constructive and timely response fro our reviewer Prof. Philip Dufton. This work was funded through a research grant to KP from Croatian Ministery of Science and Education. JS acknowledges financial support from STFC in the form of grant number ST/F002599/1. This work was partly funded from a research grant to PK from ESA PECS project No. 98058.
References
- [] Andersen J., 1991, A&AR, 3, 91
- [] Batten A. H., 1962, Publ. Dom. Astrophys. Obs. Victoria, 12, 91
- [] Becker S., Butler K., 1990, A&A, 235, 326
- [] Bessell M., Castelli F., Plez B., 1998, A&A, 333, 231
- [] Butler K., 1984, PhD thesis, University of London
- [] Catanzaro G., 2008, MNRAS, 385, L33
- [] Claret A., 1995, A&AS, 109, 441
- [] Claret A., 1998, A&AS, 131, 395
- [] Claret A., 2000, A&A, 363, 1081
- [] Claret A., 2001, MNRAS, 327, 989
- [] Claret A., 2003, A&A, 399, 1115
- [] Claret A., 2007, A&A, 475, 1019
- [] Claret A., Giménez A., 1995, A&AS, 114, 549
- [] Daflon S., Cunha K., Smith V. V., Butler K., 2003, A&A, 399, 525
- [] De Mink S. E., Cantiello M., Langer N., Pols O. R., Brott I., Yoon S.-Ch., 2009, A&A, 497, 243
- [] Dufton P.L., McErlean N.D., Lennon D.J., Ryans R.S.I., 2000, A&A, 353, 311
- [] Dufton P.L., Ryans R.S.I., Trundle C., et al., A&A, 434, 1125
- [] Ekström S., Meynet G., Maeder A., Barblan F., 2008, A&A, 478, 467
- [] Evans C. J., Smartt S. J., Lee J.-K., et al., 2005, A&A, 437, 467
- [] Evans C. J., Smartt S. J., Lee J. K., et al., 2006, A&A, 456, 623
- [] Flower P. J., 1996, ApJ, 469, 355
- [] Frandsen S., Lindberg B., 1999, in Astrophysics with the NOT, eds. H. Harttunen & V. Piirola, University of Turku, 71
- [] Giddings J., 1981, PhD thesis, University of London
- [] Gies D. R, Lambert, D. L., 1992, ApJ, 387, 673
- [] Girardi L., Bertelli G., Bressan A., et al., 2002, A&A, 391, 195
- [] Grevesse N., Asplund M., Sauval A. J., 2007, Space Sci. Rev., 130, 105
- [] Guinan E. F., Ribas I., Fitzpatrick E. L., et al., 2000, ApJ, 544, 409 (G2000)
- [] Hadrava P., 1995, A&AS, 95, 101
- [] Heger A., Langer N., 2000, ApJ, 544, 1016
- [] Heger A., Langer N., Woosley S. E., 2000, ApJ, 528, 368
- [] Hensberge H., Pavlovski K., 2007, in Binary Stars as Critical Tools and Tests in Contemporary Astrophysics, eds. W. I. Hartkopf, E. F. Guinan & P. Harmanec, IAU Symp. 240, p.136
- [] Hensberge H., Ilijić S., Torres K. B. V., 2008, A&A, 482, 1031
- [] Hensberge H., Pavlovski K., Verschueren W., 2000, A&A, 358, 553
- [] Herrero A., Kudritzki R. P., Vilchez J. M., Kunze D., Butler K., Haser S., 1992, A&A, 261, 209
- [] Herrero A., Puls J., Villamariz M. R., 2000, A&A, 354, 193
- [] Hilditch R. W., 2004, in Spectroscopically and Spatially Resolving the Components of the Close Binary Systems, eds. R. W. Hilditch, H. Hensberge & K. Pavlovski, ASP Conf. Ser. 318, p.198
- [] Hill G., Batten A. H., 1984, A&A, 141, 39
- [] Høg E., Bässgen G., Bastian U., et al., 1997, A&A, 323, L57
- [] Horn J., Kubat J., Harmanec P., et al., 1996, A&A, 309, 521
- [] Huang W., Gies D. R., 2006, ApJ, 648, 591
- [] Hunter I., Brott I., Langer N., et al., 2009, A&A, 496, 841
- [] Hunter I., Brott I., Lennon D., et al., 2008, ApJ, 676, L29
- [] Hunter I., Dufton P.L., Smartt S. J., et al., 2007, A&A, 466, 277
- [] Hynes R. I., Maxted P. F. L., 1998, A&A, 331, 167
- [] Ilijić S., Hensberge H., Pavlovski K., Freyhammer,L. M., 2004, in Spectroscopically and Spatially Resolving the Components of Close Binary Systems, eds. R. W. Hilditch, H. Hensberge & K. Pavlovski, ASP Conf. Ser. 318, p.111
- [] Kurucz R. L., 1979, ApJS, 40, 1
- [] Kurucz R. L., 1993b, CD-ROM 13, SAO
- [] Langer N., Cantiello M., Yoon S.-C., Hunter I., Brott I., Lennon D., de Mink S., Verheijdt M., 2008, in Massive stars as cosmic engines, IAU Symp. 250, eds. F. Bresolin, P. A. Crowther, J. Puls, p.167
- [] Leushin V. V., 1988, Soviet Astron., 32, 517
- [] Leushin V. V., Topilskaya G. P., 1986, Astrophysics, 25, 503
- [] Lyubimkov L. S., 1998, Astron. Rep., 42, 52
- [] Lyubimkov L. S., Rachkovskaya T. M., Rostophchin S. I., Tarasov A.E., 1996, Astron. Rep., 40, 46
- [] Lyubimkov L. S., Rostopchin S. I., Lambert D. L., 2004, MNRAS, 351, 745 (LRL04)
- [] Lyubimkov L. S., Rostopchin S. I., Rachkovskaya T. M., Poklad D. B., Lambert D. L., 2005, MNRAS, 358, 193
- [] Maeder A., Meynet G., 2000, ARA&A, 38, 143
- [] Meynet G., Maeder, A., 2000, A&A, 361, 101
- [] Morel T., Butler K., Aerts C., Neiner C., Briquet M., 2006, A&A, 457, 651
- [] Morel T., Hubrig S., Briquet M., 2008, A&A, 481, 453
- [] Nieva M. F., Przybilla N., 2007, A&A, 467, 295
- [] Pavlovski K., 2004, in Spectroscopically and Spatially Resolving the Components of Close Binary Systems, eds. R. W. Hilditch, H. Hensberge & K. Pavlovski, ASP Conf. Ser. 318, p.206
- [] Pavlovski K., Hensberge H., 2005, A&A, 439, 309 (PH05)
- [] Pavlovski K., Southworth J., 2009, MNRAS, 394, 1519 (Paper I)
- [] Pfeiffer M. J., Frank C., Baumüller D., Fuhrmann K., Gehren T., 1998, A&AS, 130, 381
- [] Popper D. M., Guinan E. F., 1998, PASP, 110, 572
- [] Press W. H., Teukolsky S. A., Vetterling, W. T., Flannery B. P., 1992, Numerical Recipes in Fortran 77: The Art of Scientific Computing, Cambridge University Press
- [] Przybilla N., Butler K., 2001, A&A, 379, 955
- [] Ribas I., Jordi C., Giménez Á., 2000, MNRAS, 318, L55
- [] Schaller G., Schaerer D., Meynet G., Maeder A., 1992, A&AS, 96, 269
- [] Simon K. P., Sturm E., 1994, A&A, 281, 286
- [] Škoda P., 1996, in Astronomical Data Analysis Software and Systems V, eds. G. H. Jakoby & J. Barnes, ASP Conf. Ser. 101, p.187
- [] Skrutskie M. F., Cutri R. M., Stiening R., et al., 2006, AJ, 131, 1163
- [] Southworth J., 2008, MNRAS, 386, 1644
- [] Southworth J., Clausen J. V., 2007, A&A, 461, 1077
- [] Southworth J., Bruntt H., Buzasi D. L., 2007, A&A, 467, 1215
- [] Southworth J., Maxted P. F. L., Smalley B., 2004, MNRAS, 351, 1277
- [] Southworth J., Zucker S., Maxted P. F. L., Smalley B., 2004c, MNRAS, 355, 986
- [] Southworth J., Maxted P. F. L., Smalley B., 2005, A&A, 429, 645
- [] Southworth J. et al., 2009, MNRAS, in press (arXiv:0907.3356)
- [] Sturm E., Simon K. P., 1994, A&A, 282, 93
- [] Tamajo E., Pavlovski K., Southworth J., 2009, A&A (submitted)
- [] Trundle C., Dufton P. L., Hunter I., et al., 2007, A&A, 471, 625
- [] Trundle C., Lennon D.J., Puls J., Dufton P.L., 2004, A&A, 417, 217
- [] Van Hamme W., 1993, AJ, 106, 2096
- [] Wilson R. E., 1979, ApJ, 234, 1054
- [] Wilson R. E., 1993, in New frontiers in interacting binary star research, eds. K. C. Leung and I. S. Nha, ASP Conf. Ser. 38, p.91
- [] Wilson R. E., 1990, ApJ, 356, 613
- [] Wilson R. E., Devinney E. J., 1971, ApJ, 166, 605
- [] Wilson R. E., Van Hamme W., 2004, Computing Binary Star Observables
Appendix A Observing logs for the data presented in this work
The tables in this section contain observing logs for each of the fours sets of spectroscopic observations used in this work. In each case the orbital phases have been calculated with ephemeris derived by Guinan et al. (2000).
| Set | ID | HJD | Phase | S/N |
|---|---|---|---|---|
| AUO | nh060033 | 53224.5345 | 963.1629 | 406 |
| AUO | nj050015 | 53284.3204 | 967.9744 | 476 |
| AUO | nj110016 | 53290.3615 | 968.4607 | 523 |
| AUO | of190036 | 53541.4822 | 988.6701 | 256 |
| AUO | pi240037 | 54003.3681 | 1025.8419 | 327 |
| AUO | pj100025 | 54019.4183 | 1027.1337 | 302 |
| AUO | pj160020 | 54025.3728 | 1027.6128 | 315 |
| AUO | pj170017 | 54026.2822 | 1027.6860 | 329 |
| AUO | pj200028 | 54029.3709 | 1027.9347 | 363 |
| AUO | qd020024 | 54193.5319 | 1041.1460 | 433 |
| AUO | qd040052 | 54195.5864 | 1041.3114 | 240 |
| AUO | qd110012 | 54202.6237 | 1041.8779 | 282 |
| AUO | qd130029 | 54204.4341 | 1042.0234 | 234 |
| AUO | qd140035 | 54205.4133 | 1042.1023 | 329 |
| AUO | qd150023 | 54206.4880 | 1042.1888 | 302 |
| AUO | qd160023 | 54207.5143 | 1042.2715 | 320 |
| AUO | qd190051 | 54210.5260 | 1042.5138 | 306 |
| AUO | qd200076 | 54211.5794 | 1042.5984 | 154 |
| AUO | qd220035 | 54213.4753 | 1042.7512 | 147 |
| AUO | qd220036 | 54213.4893 | 1042.7522 | 424 |
| AUO | qd230013 | 54214.4278 | 1042.8279 | 377 |
| AUO | qd250015 | 54216.5346 | 1042.9973 | 645 |
| AUO | qd300010 | 54221.3884 | 1043.3878 | 365 |
| AUO | qe010020 | 54221.5111 | 1043.3978 | 153 |
| AUO | qe030013 | 54224.3838 | 1043.6289 | 472 |
| AUO | qe170014 | 54238.4871 | 1044.7640 | 185 |
| AUO | qf230025 | 54275.5113 | 1047.7437 | 231 |
| AUO | qg140028 | 54296.5112 | 1049.4337 | 268 |
| AUO | qg140030 | 54296.5256 | 1049.4349 | 304 |
| AUO | qg170012 | 54299.3604 | 1049.6628 | 371 |
| AUO | qg260022 | 54308.5021 | 1050.3988 | 342 |
| AUO | qh050031 | 54318.4729 | 1051.2010 | 313 |
| AUO | qh130008 | 54326.3361 | 1051.8339 | 191 |
| AUO | qh130010 | 54326.3563 | 1051.8354 | 396 |
| AUO | qh170015 | 54330.4312 | 1052.1633 | 180 |
| Set | ID | HJD | Phase | (Å) | S/N |
|---|---|---|---|---|---|
| AUO | ni170011 | 53266.3564 | 966.5286 | 4500 | 231 |
| AUO | ni180017 | 53267.3871 | 966.6116 | 4500 | 379 |
| AUO | nj050010 | 53284.2734 | 967.9706 | 4500 | 269 |
| AUO | nj100002 | 53289.2876 | 968.3742 | 4200 | 95 |
| AUO | nj120017 | 53291.2617 | 968.5330 | 4500 | 67 |
| AUO | nj240036 | 53303.4095 | 969.5107 | 4500 | 253 |
| AUO | nj250003 | 53304.2597 | 969.5789 | 4500 | 304 |
| AUO | nk250003 | 53335.2304 | 972.0715 | 4500 | 264 |
| AUO | oe260012 | 53517.4736 | 986.7380 | 4350 | 224 |
| AUO | pj160016 | 54025.3308 | 1027.6096 | 4900 | 139 |
| AUO | qd160028 | 54207.5544 | 1042.2747 | 4900 | 213 |
| AUO | qd190080 | 54210.5981 | 1042.5195 | 4900 | 83 |
| AUO | qd220060 | 54213.5538 | 1042.7574 | 4900 | 210 |
| AUO | qd270032 | 54218.5272 | 1043.1577 | 4900 | 254 |
| AUO | qd280024 | 54219.4498 | 1043.2318 | 4900 | 187 |
| AUO | qd290038 | 54220.5512 | 1043.3206 | 4900 | 176 |
| AUO | qe030018 | 54224.4380 | 1043.6333 | 4900 | 191 |
| AUO | qe180020 | 54239.4456 | 1044.8411 | 4350 | 129 |
| AUO | qf090021 | 54261.5286 | 1046.6183 | 4440 | 150 |
| AUO | qf110020 | 54263.4758 | 1046.7751 | 4400 | 122 |
| AUO | qf160017 | 54268.3798 | 1047.1697 | 4400 | 76 |
| AUO | qg140025 | 54296.4497 | 1049.4287 | 4400 | 198 |
| AUO | qg160015 | 54298.5406 | 1049.5969 | 4400 | 148 |
| AUO | qh050018 | 54318.3959 | 1051.1948 | 4400 | 148 |
| Set | ID | HJD | Phase | S/N |
|---|---|---|---|---|
| DAO | 3c05618 | 54232.9356 | 1044.3172 | 306 |
| DAO | 3c07248 | 54259.9013 | 1046.4873 | 287 |
| DAO | 3c07992 | 54274.8548 | 1047.6907 | 248 |
| DAO | 3c08291 | 54276.9189 | 1047.8569 | 48 |
| DAO | 3c12337 | 54340.7187 | 1052.9914 | 236 |
| Set | ID | HJD | Phase | S/N |
|---|---|---|---|---|
| NOT | 54039.37711 | 1028.7399 | 166 | |
| NOT | 54039.38248 | 1028.7403 | 309 | |
| NOT | 54039.39750 | 1028.7416 | 242 | |
| CAHA | A167 | 54607.46305 | 1074.4586 | 56 |
| CAHA | A168 | 54607.46750 | 1074.4590 | 146 |
| CAHA | A181 | 54607.61685 | 1074.4709 | 156 |
| CAHA | A182 | 54607.62454 | 1074.4716 | 176 |
| CAHA | A190 | 54607.67179 | 1074.4753 | 144 |
| CAHA | A191 | 54607.67839 | 1074.4760 | 130 |
| CAHA | B161 | 54608.63799 | 1074.5530 | 116 |
| CAHA | B162 | 54608.64601 | 1074.5536 | 136 |
| CAHA | B164 | 54608.66251 | 1074.5552 | 80 |
| CAHA | B165 | 54608.67026 | 1074.5558 | 164 |
| CAHA | C181 | 54609.55296 | 1074.6268 | 32 |
| CAHA | C182 | 54609.56075 | 1074.6274 | 20 |
| CAHA | D158 | 54610.52706 | 1074.7052 | 144 |
| CAHA | D159 | 54610.53474 | 1074.7058 | 148 |
| CAHA | H200 | 54691.47874 | 1081.2201 | 66 |
| CAHA | H201 | 54691.48664 | 1081.2207 | 54 |
| CAHA | H202 | 54691.49426 | 1081.2213 | 60 |
| CAHA | H220 | 54691.67199 | 1081.2355 | 42 |
| CAHA | H221 | 54691.67967 | 1081.2361 | 36 |
| CAHA | H222 | 54691.68733 | 1081.2368 | 36 |
| CAHA | I191 | 54692.33182 | 1081.2887 | 60 |
| CAHA | I192 | 54692.33942 | 1081.2893 | 64 |
| CAHA | I219 | 54692.60461 | 1081.3107 | 70 |
| CAHA | I220 | 54692.61226 | 1081.3113 | 70 |
| CAHA | I221 | 54692.61994 | 1081.3119 | 84 |
| CAHA | J215 | 54693.61367 | 1081.3917 | 124 |
| CAHA | J216 | 54693.62132 | 1081.3923 | 120 |
| CAHA | J217 | 54693.62911 | 1081.3931 | 72 |
| CAHA | K189 | 54694.31946 | 1081.4486 | 156 |
| CAHA | K190 | 54694.32706 | 1081.4493 | 152 |
| CAHA | K221 | 54694.59423 | 1081.4707 | 96 |
| CAHA | K222 | 54694.59957 | 1081.4709 | 130 |
| CAHA | K223 | 54694.60717 | 1081.4716 | 118 |
| CAHA | M184 | 54696.32683 | 1081.6102 | 232 |
| CAHA | M208 | 54696.53837 | 1081.6272 | 144 |
| CAHA | M209 | 54696.54484 | 1081.6276 | 126 |
| CAHA | M210 | 54696.55136 | 1081.6282 | 120 |
| CAHA | M217 | 54696.58198 | 1081.6306 | 154 |
| CAHA | M218 | 54696.58974 | 1081.6313 | 144 |
| CAHA | M219 | 54696.59739 | 1081.6328 | 108 |