Enhanced Star Formation in Narrow Line Seyfert 1 AGN revealed by Spitzer
Abstract
We present new low resolution Spitzer mid-infrared spectroscopy of a sample
of 20 ROSAT selected local Narrow Line Seyfert 1
galaxies (NLS1s). We detect strong AGN continuum in all and clear PAH
emission in 70% of the sources.
The 6.2 m PAH luminosity spans three orders of magnitudes, from
erg s-1 to erg s-1
providing strong evidence for intense ongoing star formation in the
circumnuclear regions of these sources.
Using the IRS/Spitzer
archive we gather a large number of additional NLS1s and
their broad line counterparts (BLS1s) and constructed NLS1 and BLS1
sub-samples to compare them in various ways. The comparison shows a
clear separation according to FWHM(H) such that objects with
narrower broad H lines are the strongest PAH emitters.
We test this division in various ways trying to remove biases due to
luminosity and aperture size. Specifically, we find that star formation
activity around NLS1 AGN is larger than around BLS1 of the same AGN luminosity.
The above result seems to hold over the entire range of distance and
luminosity.
Moreover the
star formation rate is higher in low black hole mass and high systems indicating that black hole growth and star formation are occurring
simultaneously.
1 Introduction
The connection and co-evolution of active galactic nuclei (AGN) and star forming or starburst (SB) galaxies has become a major area of research. Understanding this evolution will supply most valuable information about the formation of the first black holes (BH), the accretion rate history and the growth of such systems through time, the building of galactic bulges, the metal enrichment of galaxies and clusters and more. Early studies (e.g. Rowan-Robinson 1995) suggested a possible common fueling mechanism for starbust galaxies and quasars. There is mounting evidence that intense star formation and nuclear activity are often closely related. This is evident from direct optical and infrared (IR) observations of many AGNs, the tight relationship between central BH mass and bulge mass (or bulge stellar velocity dispersion; see Ferrarese Merrit 2000, Gebhardt et al. 2000, Marconi Hunt 2003) and also from the analysis of luminous sources such as ULIRGs where nuclear activity and intense star formation (SF) are happening at the same time (e.g., Genzel et al. 1998).
The long term interest in the properties of type-I AGNs with narrow broad emission lines (Narrow Line Seyfert 1 galaxies - NLS1s) is closely related to the above issues. Such systems were defined more than three decades ago (Zwicky et al. 1971) and have received much attention due to their unusual X-ray properties. They are normally defined by their optical spectra in particular the requirement that FWHM(H) km s-1(Osterbrock Pogge 1985). Some properties of NLS1 are definitely extreme among type-I AGNs: (I) their X-ray spectra are very steep showing the presence of a large soft X-ray excess (Boller et al. 1996). The X-ray slope defined by , has photon spectral indices ranging from to . The X-ray luminosity span the range erg s-1. (II). They exhibit rapid, large amplitude X-ray variability (Gallo et al. 2004 and references therein). (III). Their optical FeII lines are very strong compared with H(Grupe et al. 2004). (IV). They show indications for large metal abundance in optical/IR (Shemmer Netzer 2002, Shemmer et al. 2004) and X-ray (Tanaka et al. 2004, Fabian et al. 2009). Other extreme properties have been noted too. For example, Peterson and collaborators (2000) proposed that NLS1s have lower black hole (BH) masses compared with broad line Seyfert 1 galaxies (hereafter BLS1s) of similar luminosity. Translating their accretion rate and BH mass to one finds that they are at the high end of the AGN distribution showing (see also Boroson 2002; Grupe 2004 and references therein). As such, they have been considered in several papers to be in the phase of building up their central BH (Mathur et al. 2001; Grupe Mathur 2004).
The large accretion rate and high metallicity of NLS1s are likely related to the presence of active star forming regions in the hosts of such sources and Mathur (2000) suggested that NLS1s live in rejuvenated, gas-rich galaxies with ongoing star-formation. This has been speculated in several individual sources with an ULIRG infrared nature (e.g. Tacconi et al. 2002; Risaliti et al. 2006) but has not been shown to be the case in large NLS1s samples.
In the present work, we want to obtain a detailed mid-infrared (MIR) spectroscopic characterization of circumnuclear regions in the hosts of NLS1s. The aims are to investigate the possibility that such hosts show more intense star formation compared with other AGNs and to check the various relationships between SF and BH accretion. The high sensitivity and resolution of the IRS spectrometer on board the Spitzer Space Telescope (Houck et al. 2004) provide a most suitable tool to achieve these goals by obtaining high S/N low resolution 5-15 m spectra of many NLS1s. In particular we want to characterize the SF in such system using observations of polycyclic aromatic hydrocarbons (PAH) features that are superimposed on the strong MIR AGN continuum. The analysis of the SF-BH activity connection can then be carried out using a comparison sample of BLS1s of comparable luminosity.
This paper is organized as follows. The second section describes the NLS1 and BLS1 samples including the new Spitzer observations. In §3 we describe the data reduction and the analysis of the spectra which are a superposition of the spectra of the AGN and the star forming host. In §4 we use our samples to investigate in detail the differences between NLS1s and BLS1s and in §5 we summarize our results and list the most important conclusions. Throughout this paper we assume km s-1 Mpc-1, , .
2 The sample selection
Our prime sample of 20 NLS1s is taken from a ROSAT sample of nearby AGN (Thomas et al. 1998), carefully characterized both in the optical (Grupe et al. 2004) and X-ray bands (Boller et al. 1996, Grupe et al. 2004) and not previously observed with Spitzer IRS. The Spitzer IRS observations of the new 20 NLS1s completing the sample are part of the PID 20241 program (PI D. Lutz).
All 20 sources considered here are of low redshift and only one (PHL 1092) has ). The FeII line strengths range from FeII/H=0.1 to FeII/H=3, the soft X-ray slope is in the range , and BH masses and X-ray luminosities span more than three order of magnitudes. These are some of the best studied NLS1s, permitting us to compare our MIR observations with other multi-wavelength properties of the sources. All our targets are relatively bright in the far infrared (FIR) and are detected by the IRAS satellite with a 60 m flux 0.2 JyS7 Jy. About 2/3 are detected at 12 m with flux greater than 0.1 Jy.
The new data described here were supplemented by a large number of additional Spitzer archival spectroscopic observations of NLS1s and BLS1s. These were selected as follows: We first extracted all the NLS1s and BLS1s from the edition of the Catalog of Quasars and Active Nuclei compiled by Véron-Cetty & Véron (2006, hereafter VQC06), using both catalogs of faint (i.e. Seyfert galaxies fainter than absolute magnitude M) and bright AGNs (i.e. quasars brighter than M). We probed for ‘S1n’ and for ‘S1’ or ‘S1.0’ or ‘S1.2’ classifications in VQC06, respectively. The defining criterion for inclusion as an NLS1 in the VQC06 is FWHM(H) km s-1. To assure high quality spectra, and to reduce aperture effects (see below) we used an upper redshift limit of z. The final samples cover six orders of magnitude in luminosity. Among the BLS1s listed in VQC06, we excluded sources with Seyfert subclasses 1.5, 1.8 and 1.9. This is done to avoid confusion between NLS1s and BLS1s with particularly strong narrow lines, and possible intrinsic differences between Type 1 and Type 2 objects. We verified VQC06 spectral classifications from the literature or from SDSS DR7 spectra, eliminating a number of objects classified as S1 (1.0 or 1.2) in VQC06 but in fact corresponding to intermediate types lacking detectable BLR emission in H.
Radio loudness is another potential bias. Synchrotron emission in radio loud (RL) AGNs can extend to shorter wavelengths and significantly contribute to the observed MIR continuum. This will dilute the hot-dust produced continuum and affect the relative strength of the observed PAH features. We therefore exclude RL sources from our sample.
The two lists thus defined were cross-checked against the Science Data
Archive of the Spitzer Science Center (SSC) using the
Leopard Archive Tool version 18.2 for selecting objects observed
in the IRS Low Resolution Mode.
Table 1 shows the final samples together
with their relevant optical properties and the observing log is in Table 2.
While cross-checking the catalogs and archives is generally very successful,
there are definitely some exceptions and biases related to the way the
catalog and archive proposals were produced. This makes it necessary to
check the selection by hand. We checked a posteriori the optical classification
of our sources considering FWHM(H).
The H measurements are from various sources with literature references
listed in Table 1 and
our own measurements based on SDSS DR7 spectra and PG Quasar
spectra (Boroson & Green 1992, and T. Boroson priv. comm.).
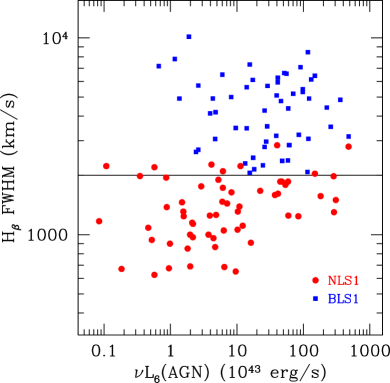
As shown in Fig. 1 and Tab. 1 and 2, the sub-classification into the two groups is not precise. Indeed the NLS1s Mrk 291, Mrk 705, SDSS J131305.80+012755.9, IRAS 13349+2438, Mrk 734, PG 1402+261, PG 2130+099 show FWHM(H) which exceeds our limit of 2000 km s-1. These sources show most of the well known extreme NLS1 properties such as a steep soft X-ray slope and strong FeII lines. Indeed, all those sources are included in well known NLS1s samples such as Véron-Cetty et al. 2001, Boller et al. 1996, Zheng et al. 2002, Zhou et al. 2006 and Gallo et al. 2006. On the other hand, only sources with strictly FWHM(H) km s-1are considered to build the broad line comparison sample. We note that several sources classified in the VCV06 catalog as type 1 and confirmed to have BLR H emission still show FWHM(H) km s-1. To be consistent, we move to the narrow line sample all the sources showing typical optical NLS1 signatures (i.e. spectra with FWHM(H) km s-1and intense iron emission) also supported by published analysis (see Table 1 for detailed references). Examples of such cases are SDSS J131305.80+012755.9, SDSS J142748.28+050222.0, PG 1552+085.
3 Data reduction and analysis
The reduction and analysis described in this section have been applied to our new observations as well as to the archival data. This is done in order to ensure a consistent and uniform analysis. All data are low resolution (, long slit Spitzer IRS observations obtained in a staring mode (Houck et al. 2004)). We are interested in the rest frame wavelength range 5-14 m, corresponding to the Short Low (SL) channel. The data reduction is carried out by applying our own IDL-based procedures starting with the two-dimensional basic calibrated data (BCD) provided by the version 17 of the Spitzer pipeline. We subtracted the sky by differencing, for each cycle, the two nod positions. In the difference thus computed, we replaced deviant pixels with values representative of their neighborhoods in the dispersion directions. In averaging all the cycles of the two-dimensional subtracted frames, we excluded values more than 2.5 times the local noise away from the mean. The calibrated one-dimensional spectra for the positive and negative beam were extracted using SMART (Higdon et al. 2004), and the two spectra averaged in order to obtain the final spectrum. Small multiplicative corrections where applied to take into account flux offset between the two low resolution orders. We also checked for consistency with the 12 m and 25 m IRAS fluxes when available, considering the possibility of aperture effects for nearby sources. The observation of Ton S180 represents a particular case. For the observation of this source the slit was not properly centered on the target due to adoption of an incorrect literature position. To properly calibrate the flux of this source we used the Long Low channel data (rest wavelength range 14-35 m) and re-normalized the observed flux to the IRAS values. For this reason, we consider the Ton S180 measurements to be less reliable than the rest of the sample. Fig. 2 shows the final spectra of our 20 prime sources.

We decomposed the AGN and star formation contribution to the observed spectrum by fitting the 5.5–6.85m rest wavelength range of the spectra with a simple model of a linear continuum representing thermal emission by AGN heated dust and a starburst template obtained from the ISO/SWS spectrum of M82. The latter is designed to enable a reliable measure of the 6.2m PAH emission feature in the spectrum. We note that the broad wavelength MIR spectrum of luminous AGNs (e.g. Schweitzer et al. 2006 (hereafter S06); Netzer et al. 2007) is well represented by a linear or power-law continuum over the limited wavelength range considered here.
The fit parameters obtained in this way were used to calculate the rest frame 6 m pure AGN flux density and the 6.2 m PAH flux. The latter is obtained by integrating over the rest wavelength range 6.1-6.35 m. The detection criteria for both the AGN continuum and the 6.2 m PAH feature are fixed at a 3 level, and the error estimates are based on propagating the noise estimated from the difference of spectrum and fit over the rest wavelength range 5.5-6.85 m. Cases of non-detections were assigned a 3 continuum and/or PAH upper limit. All fluxes were converted to luminosities which are referred to later on as L(6m) and L(6.2 PAH). The only galaxy with a continuum upper limit is considered a non detection and is reported in the tables for completeness but is not considered in the analysis and discussion sections. The choice of the 6m continuum enables to define in a clean way the hot-dust continuum produced by the dusty structure (torus) surrounding the AGN. This part of the spectrum is easy to measure and not much affected by strong emission or absorption features (e.g. S06). As for the PAH, we prefer to use the 6.2 m PAH feature, instead of the strong 7.7 m PAH emission feature, because it is not affected by blending with atomic lines such as [NeVI] and because its profile is not distorted by the 9.7 m silicate feature. The choice of 6.2 m PAH causes nondetection in some weak PAH sources where other PAH features are seen, we consider this acceptable and justified by its other advantages. The continuum and PAH fluxes (luminosities) and upper limits are listed in Table 3 for the complete ROSAT and archival sample of 59 NLS1 (58 detections) and 54 BLS1s (all detected).
4 Results
The results of our analysis are shown in Table 3, Figures 3, 4,
6 and are summarized below:
- For the entire samples, the PAH features for star formation are detected with a
significance in 70 of NLS1s and 45 of BLS1s.
- The comparison between unbiased NLS1 and BLS1 samples shows how the two population are
separated and that NLS1s are related to a more intense SB activity than BLS1s.
Possible luminosity and distance effects are carefully taken into account in the following discussion.
4.1 Mid-IR spectral properties
Our original sample of 20 sources is characterized by high quality and high S/N spectra,
and can be considered representative of MIR spectral properties of the entire NLS1 sample.
As one can infer from Fig. 2, and the dedicated part of
Table 3, thanks to the high quality of our 20 spectra we are
able to detect the 6.2 m PAH feature in most of all the sources (14/20 of the prime sample).
From a visual inspection of Fig. 2,
IRAS 13224-3809, Mrk 957, Mrk 507 and Mrk 291 show the most prominent PAH features.
Indeed, among the known AGN these belong to the ones with the
strongest SF signatures relative to the underling AGN continuum
(values in column 4 and 5 of Tab. 3, see below for details on R values).
There are only six (30% of the subsample) upper limits for the 6.2 PAH flux.
Among these, three spectra (PHL 1092, Ton S180, 1H 0707-495) have a low S/N due
to their large distance or intrinsic faintness and, in the case of Ton S180 pointing problems (see §3 for details),
thus their upper limits are not very constraining (see the high values in Tab. 3 column 3).
The other limits (Ark 564, Mrk 335, PG 1448+273) have high S/N spectra and the
low limits values establish strong constraints for the detection of the 6.2 PAH.
Nevertheless, the lack of this feature does not imply the complete absence of ongoing star formation
as the it can be diluted by the strong AGN continuum (S06).
The presence of 7.7, 11.3 and 12.7 PAH features strengthens this possibility,
Mrk 335 being the only exception.
The peculiar case of Mrk 335 is discussed in Appendix togher with
two sources showing strong 9.7 m silicate absorption and one strong star forming BLS1.
4.2 Star Formation activity vs. FWHM(H) for NLS1 and BLS1 galaxies
To quantify the contribution of star forming regions to the NLS1s and BLS1s spectra we define the SF-AGN ratio R by
| (1) |
R is proportional to the PAH equivalent width (EW) measured against the pure AGN continuum. R values for the entire sample are listed in column 6 of Tab. 3, the correlation of R vs. FWHM(H) is plotted in the left panel of Fig. 3, while histograms in the right panel show the distribution of R for NLS1 and BLS1.
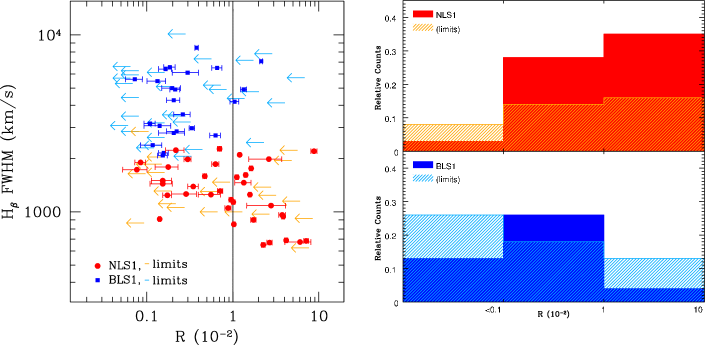
Visual inspection of Fig. 3 suggests that NLS1s are
characterized by larger R which can be interpreted as a larger relative
star formation contribution to their MIR spectra.
In particular the histogram points out a greater PAH detection rate in NLS1 than BLS1,
and, most of all that the majority of these detections correspond to the strongest
circumnuclear SF activity (R1). On the other hand R values for BLS1 are mostly upper limits,
and the detections typically lie in the intermediate R rage (0.1R1).
This impression is substantiated by a
formal censored statistics which we applied to the data.
We used an improved version of the logrank test (Peto & Peto 1972),
which correctly treats left-censored data.
For the purpose of the analysis we divided the sample in two
assuming in Fig. 3 a division line of FWHM(H)= 2000 km s-1,
and compare their properties with respect to R.
This gave a negligible probability () that the two sub-samples
are drawn from the same parent
distribution. Moving the dividing line up or down by 100 km s-1 did not
change the conclusion. This significant difference between NLS1 and BLS1 groups
indicates that type-I AGNs with narrower broad emission lines
reside in hosts containing more luminous SF regions.
While the above is the main finding of the present paper, there are several
potential effects that could bias this result and lower its significance.
The ratio R could be small either due to dilution by the AGN continuum or
or if the starburst is young (Rowan-Robinson & Efstathiou 2009).
The last possibility can be traced by relating the 9.7 m silicate
stenghts with the R values (similarly to Spoon et al. 2007).
Howether, among our sample IRAS 11119+3257 and Mrk 231 are
the only sources with strong silicate absorption, as shown in Fig. 10 and
described in the Appendix for peculiar sources.
Moreover, silicate emission is clearly detected in several sources
(e.g. I Zw1, PG1211+143, PG0804+761 and others in both NLS1 and BLS1 samples),
and well highlighted in the stacked spectra of Fig. 6.
Thus, the possible contamination by young/obscured starbursts is mostly ruled out.
The general issue of silicate emission and absorption features
is the subject of a forthcoming paper including the present sample.
The two most important ones are aperture and luminosity effects. The first
depends on the source distance and is the result of the fixed size
Spitzer slit width that includes more host galaxy light in more distance
sources. The IRS slit width is 3.6″ for the spectral range used here,
i.e 3.5 kpc at a typical distance of 200 Mpc.
This can result in larger R (more PAH emission) at higher redshifts.
The second potential bias is related to the well know increase in L(PAH)
with AGN luminosity. The dependence of the two has been investigated in
several samples (e.g. S06) and, while linear, the slope is not 1 which can
introduce a trend of R with AGN luminosity. Our NLS1 and BLS1 samples where
not chosen on the basis of their similar distances or AGN luminosity thus
the above may affect the trend seen in Fig. 3.
The rest of this section addresses the above potential biases by comparing
the two samples in various ways that are relevant to those effects.
4.3 Flux, luminosity and distance correlations
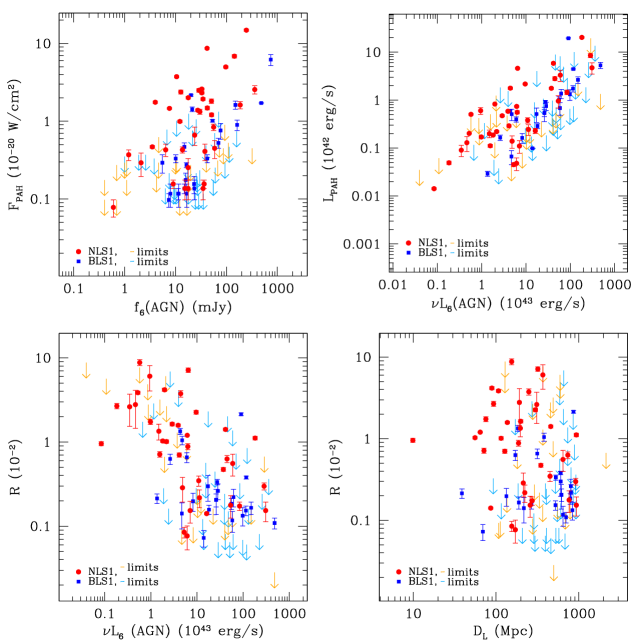
We have constructed two-dimensional diagrams combining observational (measured flux and distances) and deduced (luminosities and R values) properties of the sources in our two sub-samples. These correlations are shown in Fig. 4. The top left panel of the diagram examines the relation between the observed 6m continuum and 6.2-PAH fluxes of our sources. NLS1s and BLS1s seem to be broadly separated. A region defined by F(PAH) W cm-2 holds mostly NLS1. The two BLS1s that are outside these limits are the ones with the strongest PAH, Mrk 231, and IRAS 13342+3932. Among these, Mrk 231 lies in the intermediate R values range of the histogram (Fig. 3), while IRAS 13342+3932 (R) represents the only BLS1 with SF activity comparable with what is observed in NLS1. Mrk 231 and IRAS 13342+3932 are also discussed in the Appendix for peculiar sources. This separation strengthens the earlier suggestion of enhanced star formation activity, and the stronger PAH features in NLS1s, but may still be affected by aperture and luminosity effects.
Possible physical trends are examined in the top right panel of Fig. 4. This panel confirms that the earlier mentioned luminosity correlation between AGN continuum and star formation traced by PAH is also seen in our sample. Clearly L(PAH) increases with L(6 m) for the entire sample. The slope of the correlation (which is not necessarily identical to the slope found in S06 who used a sample of higher luminosity sources) is i.e. sublinear.
The two bottom panels of the diagram examine the dependence of R on source
luminosity and distance. The bottom left panel shows a clear decrease of R
with L(6m). This reflects the sublinear slope seen in the top right panel
meaning that L(6m) increases more rapidly than L(PAH). The two
sub-classes are still separated in this diagram, in the sense that at given
AGN luminosity the NLS1 populate regions of larger luminosity ratio, with
considerable scatter. Again this is suggesting enhanced star formation around
NLS1 AGN.
The bottom right panel of Fig. 4 is the one most relevant to the
potential biases. Here R is plotted as a function of source distance which
is translated to a larger physical aperture and increased host contribution.
The diagram shows no particular trends suggesting that host galaxy
contribution is not an important factor in determining
R. The NLS1s-BLS1s separation in this plot is similar to the one seen in
the other panels.
In conclusion, the NLS1 and BLS1 AGNs investigated here seem to represent two groups of type-I sources that differ in their star formation properties. This does not resemble an artifact of aperture or luminosity effects and seems to be an intrinsic property of the two sub-classes. The important parameter separating the two groups is their measured FWHM(H) (Fig. 3).
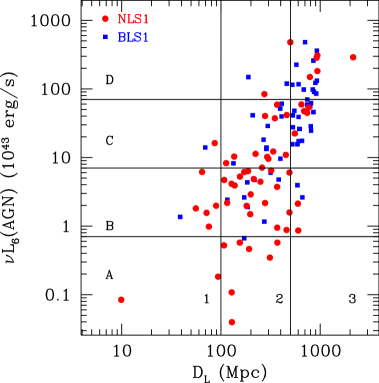
To further investigate the potential influence of source distance and
luminosity on the R vs. FWHM(H) correlation in a way fully including the PAH
nondetections, we have derived composite spectra of NLS1s and BLS1s in
different luminosity-distance regimes. This was achieved by dividing the
entire luminosity-distance space into ten regions defined by
sampling the luminosity range in four equally spaced bins of the size of one order of magnitude,
and the distance axis in three zones spacing the redshift range in bins of one order of magnitude each.
This corresponds to distance thresholds of 100 and 500 Mpc and AGN luminosity limits of ,
and erg/s. The ten zones and the distribution of NLS1s and
BLS1s in them are shown in Fig. 5. We then obtained stacked
spectra of all the NLS1s in each zone and compared them with stacked spectra
of all the BLS1s in the same zone.
The spectral combination is achieved by shifting all spectra to zero
redshift and by normalizing individual spectra to the same 6m AGN
continuum flux density. The purpose is to inspect
visually the composite spectra in order to verify the previous conclusion
that R is indeed larger in NLS1s once the luminosity and distance effects have been removed.
The final number of sources for each zone and the composite spectra are shown in Fig. 6.
To compare quantitatively the star formation contributions of NLS1s and
BLS1s in the same zone, we treated the composite spectra
in the same way used to define R for individual sources. We then define a
variable describing the relative importance of star formation in NLS1
compared to BLS1,
by
| (2) |
where and are the ratios of 6.2 m PAH fluxes to 6 m AGN continuum (see Eq. 1) for the NLS1 and BLS1 average spectra, respectively. stands for a more intense SF activity in NLS1s compared to BLS1s. In Table 4 we list the measured values of R and FSB in all ten zones. We emphasize that in all the bins but two, an enhanced NLS1 star formation activity is found by at least a factor . Only one zone (A1) is an exception hosting no BLS1 and is discussed below.
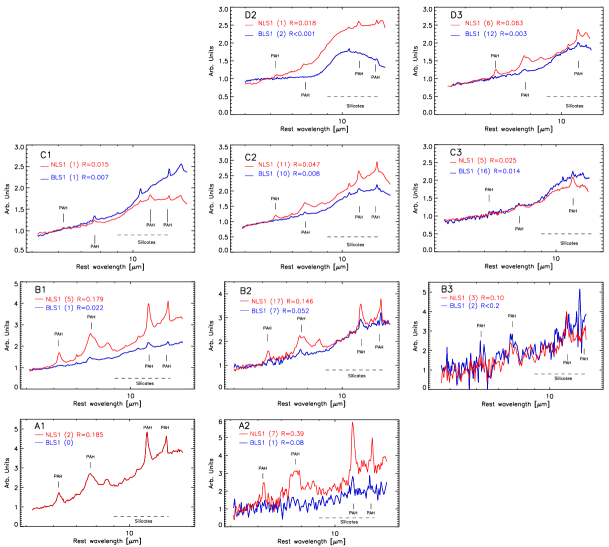
A detailed account of the results of this analysis is in Appendix A (see Fig. 6 for a visual inspection).
To summarize, in almost all ten zones defined by distance
and AGN luminosity, star forming activity in NLS1 seems to be stronger, by our
definition based on the relative strength of the 6.2 PAH emission feature
in NLS1s. The three zones (A1, C1, D2) with poor statistics in both NLS1 and BLS1
require some caution. Nevertheless the small number of sources
counts characterizing these zones is due to both physical and selection issues.
Indeed, it is unexpected to find high luminosity sources (i.e. quasars) in
the nearby Universe (z0.02).
We also note an intrinsic bias for sources entering a literature based archival sample:
using the H width as the prime selecting criterion we may preferentially miss faint BLS1 galaxies,
because broad H will be harder to identify against the host continuum.
Finally the very faint and distant sources will not have entered the sample because
of observational limitations even with a sensitive instrument like Spitzer.
However, thanks to the sufficient statistics in most of the zones (8/10),
the main result of stronger star formation activity in NLS1 is preserved and is clearly
indicated in our R vs. FWHM(H) correlation (see Fig.3).
Also the combination of measured and deduced quantities
for NLS1s and BLS1s (Fig. 4) robustly supports our finding.
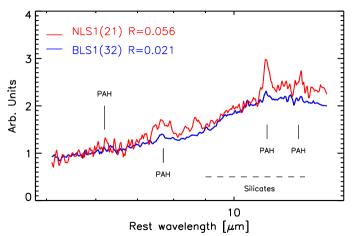
As a further confirmation of our result, in Fig. 7 we have averaged the spectra of sources without
a detection of the 6.2 m PAH feature.
A clear detection of the 6.2 m PAH is present in the stacked spectra of both NLS1 and BLS1,
and a more intense star formation activity occurs in narrow line Seyferts
with an NLS1/BLS1 enhance factor of F.
Concerning the possible luminosity and distance effects on the SF comparison factor,
we do not find any peculiar trend. This can be inferred from both a visual inspection
of different zones in Fig. 6, and by comparing R and FSB values (Tab. 4)
in terms of AGN luminosity and distance.
In particular, possible distance effect are crucial for the validity of our conclusion.
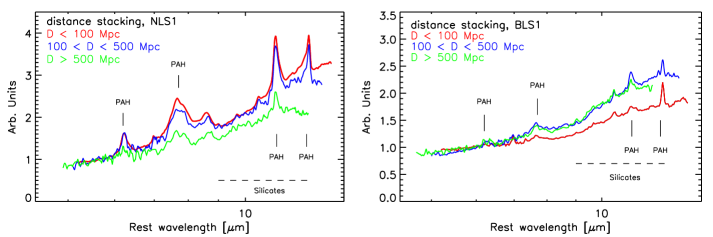
As a further check we perform a distance stack by collapsing the
luminosity bins in the luminosity-distance plot (Fig. 5) and grouping sources
in the three distance zones. The mean distance-dependent spectra are shown in Fig. 8.
Significant distance effects would imply an increase of the 6.2 PAH intensity with increasing
redshift. This effect is not observed in both NLS1 and BLS1 mean spectra.
On the contrary, a relatively fainter PAH emission found for the most distant (D Mpc) NLS1s. This can be plausibly ascribed to the higher AGN luminosity of these sources in combination with the sublinear increase of PAH luminosity with AGN luminosity (Fig. 4 top right). We note that, also for this grouping by distance only, NLS1 have stronger PAH.
5 Discussion
In the previous section we have compared measured (flux and distance) and deduced (luminosity and R) parameters carefully taking into account luminosity and distance effects. A SF-AGN luminosity correlation has been seen and discussed in Netzer et al. (2007) and Lutz et al. (2008), and here we have confirmed this trend disentangling SF and AGN spectral components in the Spitzer short wavelength band. We have demonstated an enhanced star formation activity in NLS1 galaxies compared to their broad line counterparts, and the enhancement factor (FSB) does not appear to be affected by luminosity and distance effects.
In this section, we want to investigate a possible physical connection between the AGN fueling
and star formation mechanisms. Such a connection has been proposed by several authors
(i.e. Grupe & Mathur 2004, Shemmer et al. 2004, Komossa & Xu 2007 and references therein),
but it has not been demonstrated by direct observational evidences.
Here we compare the SF tracer with the AGN accretion parameters, that is, the 6.2 PAH luminosity -to-
AGN continuum emission (R) is plotted as a function of the central black hole mass and Eddington ratio.
Black hole masses and accretion rates are computed by the single-epoch mass determination method based
on the Kaspi et al. (2005) using the Broad Line Region size vs 5100 monochromatic luminosity (RBLR-Lλ(5100)) relation.
Thus, the BLR size is estimated from the measured Lλ(5100) (col. 5 of Tab. 1),
and the mass estimate follows from assuming Keplerian motion of the H emitting gas (FWHM(H ) are in col. 4 of Tab. 1).
The reverberation mapping-based scaling relations adopted here are (see Netzer and Trakhtenbrot 2007 - NT07 for more details):
| (3) |
and
| (4) |
for BH mass and accretion rate respectively and where stands for the
5100 monochromatic luminosity. In this equation is the bolometric
correction factor. For low to intermediate luminosity AGN, this factor is between 7 and 12
(Marconi et al. 2004, Netzer 2009) and is possibly luminosity dependent.
Hence, bolometric luminosities were calculated from the monochromatic
luminosities (), by using the correction factors of Marconi et al.
(2004). These (and thus ) values are considered to be accurate to
within a factor of (see, e.g. Vestergaard & Peterson 2006).
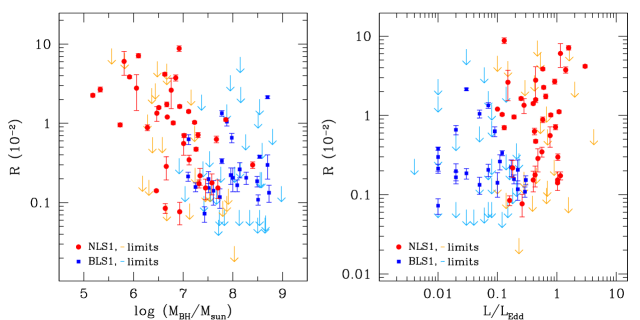
Figure 9 displays the bi-dimensional SF vs AGN properties plots.
As seen in the left panel of this figure the star formation activity increases with decreasing BH masses,
and moreover the region of low BH masses and highest
R values (Log(MM⊙) and R)
is populated by NLS1s with the complete absence of BLS1s.
Another interesting behavior is found also in the Fig.9 right panel, where the R
value increases with the Eddington ratio,
i.e. the AGN luminosity expressed in terms of the Eddington luminosity.
Also in this case NLS1s are the only AGNs populating
the region of the extreme measurements of both SF activity and Eddington ratio.
The upper limits in R make us refrain from expressing this trend in terms of a
quantitative scaling relation between star formation activity and Eddington ratio.
Nevertheless, our plots demonstrate the supposed intimate correlation between
the circumnuclear (within few central kpc) star formation and the AGN fueling.
The NLS1 galaxies are characterized by smaller BH mass,
larger Eddington ratio and stronger SF activity
compared to their broad line counterparts. Thus, we can safely conclude that AGN with the
higher accretion efficiency are surrounded by more intense star formation
than the less violently accreting SMBHs in the local Universe.
This SF-AGN correlation is possibly driven by a feedback process between the two.
Chen et al. (2009) have recently traced the star formation history of the circumnuclear regions
in type 2 AGNs, and proposed a model in which supernova explosions play a key role in the transportation
of gas to galactic centers. Other works (i.e Silk & Rees 1998, Di Matteo et al. 2005) propose that
AGN energetic outflows may affect the star formation in protogalaxies.
While our work establishes a connection between star formation and accretion rate,
we cannot draw definitive conclusions on its causal link to such feedback or feeding mechanisms.
Shemmer et al. (2004) demonstrated that NLS1s are also the local Universe
representatives of the objects with high accretion rate (L/LEdd) and high metallicity
in the metallicity - accretion rate relationship for AGNs. Again this relation suggests an intimate
connection between Starburst enriching the circumnuclear gas
and AGN fueling, represented by the accretion rate. Because we demonstrate that the efficient SMBH growth in
NLS1 is associated with the most active circumnuclear SF regions, we can only support the previous finding in an indirect way.
Indeed the metallicity inferred by Shemmer and coauthors refer to the AGN broad line region,
while the star forming activity investigated in our work happens in much larger regions.
From an evolutionary point of view, a high star formation efficiency is necessary
for a rapid BH growth in high redshift systems (Kawakatu & Wada 2009).
Thus, assuming NLS1s as the early phase of BLS1s, our results would confirm the above model predictions.
The local nature of our sources and the observable analyzed here can not directly confirm this evolutionary path,
though our observations are an intriguing starting point for further high redshift investigations.
6 Conclusions
We have analyzed low resolution 5-15m spectra of NLS1 and BLS1 galaxies obtained with the Spitzer
IRS spectrometer.
Thanks to the high spatial resolution and sensitivity of the instrument we have determined AGN 6m continuum and 6.2m
PAH luminosities.
From the comparison of observed and derived quantities (in particular the SF-to-AGN ratio) we find a
more intense circumnuclear SF activity in NLS1s than in their broad line counterparts (Fig. 3).
Possible luminosity and distance effect of this enhanced activity have been carefully taken into account by using
both bi-dimensional diagrams (Fig.4) and stacking procedures (Fig. 6, 8).
No trends affecting our main conclusion have been found.
Our paper shows yet another way to distinguish NLS1s from broader line
AGNs. This is another clear indication (on top of the extreme X-ray
properties) that emission line widths are indeed
related to fundamental physical properties, in the case under
study the properties of the host galaxies.
Finally, we have estimated the BH mass and accretion rate (Eq. 3, 4)
and plotted the SF-to-AGN ratio R as a function of these.
Figure 9 shows that NLS1s hosting more violently accreting BH
also harbor more intense circumnuclear star formation.
7 Appendix A: stacked spectra
The following is a detailed comparison of the NLS1 and BLS1 stacked spectra shown in Fig. 6.
- Zone A1, D Mpc, Lν(6,AGN) erg/s.
-
These are nearby objects and the numbers are small with only 2 NLS1s and no BLS1s, thus preventing us from direct NLS1-BLS1 comparison for nearest and less luminous object. The absence of BLS1 sources is not surprising, indeed with such faint sources the detection of a broad H feature turns to be difficult due to the spread of the few revealed photons over a relatively large wavelength range.
- Zone A2: D Mpc, Lν(6,AGN) erg/s.
-
Despite the low S/N of the spectra, here the result of the comparison is F i.e. stronger SF activity in NLS1s. The statistics is good for NLS1s while there is only one BLS1s. Again the faintness of sources and low S/N prevent from the detection of broad optical emitting lines.
- Zone B1: D Mpc, Lν(6,AGN) erg/s.
-
Similarly to zone A2, the SF activity is enhanced in NLS1 (F) even if we have to take in mind the low BLS1 statistics.
- Zone B2: D Mpc, Lν(6,AGN) erg/s.
-
As shown in Fig. 6, the 6.2 m PAH feature appears more prominent in the NLS1 mean spectrum than in the BLS1 one, and this is also confirmed by the relative importance of star formation F.
- Zone B3: D Mpc, Lν(6,AGN) erg/s.
-
The low signal-to-noise of the data (lower-right panel of Fig. 6) reflects the faintness of the sources. Indeed we just compute a 3 lower limit for the comparison parameter F. Nevertheless, we note that the 6.2 PAH feature is detected in the NLS1 stacked spectrum.
- Zone C1: D Mpc, Lν(6,AGN) erg/s.
-
A visual comparison of the data in upper-left panel of Fig. 6 does not allow to assign an enhanced SF activity to NLS1, but it is found from the comparison parameter F. Despite the low statistics, the significance of the result is preserved by the high S/N and quality of the data.
- Zone C2: D Mpc, Lν(6,AGN) erg/s.
-
There are 10 NLS1s and 11 BLS1s in this intermediate distance zone. The proper panel of Fig. 6 indicates a more intense 6.2 m PAH feature in the mean NLS1 spectrum. The high statistics allows an accurate measurement of the SF comparison parameter: F.
- Zone C3: D Mpc, Lν(6,AGN) erg/s.
-
The middle-right panel (Fig. 6) shows the stacked spectra from 5 and 16 NLS1 and BLS1, respectively. All the sources involved in the stacking are bright PG quasars (Boroson & Green 1992), and this nature reflects in the strong PAH dilution caused by the AGN continuum. PAH features are detected in both mean spectra, and a more intense SF activity is revealed in NLS1, (F).
- Zone D2: D Mpc, Lν(6,AGN) erg/s.
-
As in the case of zones A1 and C1, the statistics for both NLS1 and BLS1 is limited (respectively 1 and 2 sources). The 6.2 m PAH feature is detected in the NLS1 spectrum, even if the quasar emission dilutes the line. On the contrary, in the BLS1 mean data the PAH feature is undetected. The corresponding lower limit for the comparison parameter is: F with high significance given the limiting R upper limit (R0.001).
- Zone D3: D Mpc, Lν(6,AGN) erg/s.
-
The most distant and luminous sources lie in this region. The statistics are good (6 NLS1s, 12 BLS1s), and the data have very good signal-to-noise. PHL 1092 is the most distant source in the entire sample (an isolate red point in D3 bin of Fig. 5), and its SL observed spectrum does not cover the entire rest wavelength range, reaching only m. As a consequence, the stacked NLS1 spectrum is distorted beyond m. In the top-right panel of Fig. 6 we plot the mean NLS1 spectrum obtained without PHL 1092 in order to show a more correct mean continuum shape for this zone. This choice does not affect the shorter wavelength spectrum and the result on relative importance of star formation (R values calculated with and without PHL 1092 in the mean spectrum are consistent within the errors). The relative importance of star formation in zone D3 reaches the highest value (F) supporting the main conclusion of this paper.
8 Appendix B: peculiar sources

- Mrk 335 (Fig. 2) is a well characterized NLS1, but its mid-IR spectrum has no PAH features at all. Only a putative 7.7 m PAH can be noticed, but it is distorted by a shallow Silicate absorption features centered at 9.7 m, thus we can not confirm its detection. The shape of the Mrk 335 spectrum resembles that of quasars without PAH detections analyzed by S06. In that work the authors demonstrate that averaging 15 spectra similar to Mrk 335 the 7.7 and 11.3 PAH peaks are detected on the top of the strong AGN continuum. The result leaves open the possibility that a modest circumnuclear SF activity is actually present in Mrk 335 but the PAH features are strongly diluted by the AGN emission and lie under our detection capability.
- Among the archival samples there are three peculiar sources. Two of them
(5-15 m spectra are shown in Figure 10),
are the only objects showing a strong 9.7 m silicate absorption:
a NLS1 (IRAS 11119+3257) and a BLS1 (Mrk 231), both characterized by ULIRG infrared emission.
Mrk 231 is a well known low-ionization broad absorption line quasar (lo-BAL QSO),
with a broad line region optically detectable even if the nucleus is heavily obscured in X-rays (Gallagher et al. 2005).
Its MIR spectrum shows not only the silicate absorption related to such an absorbed ULIRG,
but also a luminous 6.2 m PAH emission (L(6.2,PAH)erg/s) pointing out a significant starburst,
even if not dominant (R=). From the comparison of their low resolution spectra,
IRAS 11119+3257 appears as the optical narrow line counterpart of Mrk 231.
The only difference being the relative intensity of the Starburst,
which in IRAS 11119+3257 is about twice the Mrk 231 values.
Even if it is not statistically significant, this coincidence is at least intriguing and may suggest a possible connection between NLS1 and lo-BAL quasars. Previous works support this suggestion: for example Brandt and Gallagher (2000) argued that the potential physical connection between NLS1s and lo-BAL QSOs is their high accretion rate close to the Eddington limit. Also Zheng et al. (2002) found common physical conditions (Fe II strength, [O III] weakness, strong outflows) in NLS1s, lo-BAL QSOs and IR QSOs and ascribed differences between them to different viewing angles and/or from different evolution phases.

The third peculiar source in the archival sample is IRAS 13342+3932, another ULIRG galaxy, which is the only BLS1 showing strong 6.2 PAH emission. Even if its optical spectrum is typical of a pure type 1 Seyfert, the mid-IR one (Fig. 11) is Starburst dominated with an AGN infrared contribution (Weedman & Houck 2008). The fact that only one BLS1 is found with such a starburst dominated spectrum does not change our overall result about an enhanced star formation in NLS1 galaxies.
9 Acknowledgments
We thank the referee for helpful comments.
We also thank Nico Hamaus for help with part of the initial data reduction.
Funding for this work at Tel Aviv University has been provided by the
Israel Science Foundation grant 364/07 and
the a DIP grant 15981.
NLS1 BLS1 Source Name z DL FWHM(Hβ) Log L5100 Source Name z DL FWHM(Hβ) Log L5100 (1) (2) (3) (4) (5) (1) (2) (3) (4) (5) Ark 564 0.0247 108 Fairall 9 0.0470 208 66907 43.927 IRAS 13224-3809 0.0667 300 IRAS 13342+3932 0.1790 866 70907 44.427 1H 0707-495 0.0411 181 FBS 0732+396 0.1180 550 Ton S180 0.0620 278 J095504.55+170556.3 0.139 656 Mrk 1044 0.0165 72 J130842.24+021924.4 0.1400 661 Mrk 335 0.0258 113 J131305.68-021039.2 0.0837 381 Mrk 359 0.0174 75 J141556.84+052029.5 0.1260 590 Mrk 896 0.0264 115 IRAS F14463+3612 0.1130 525 Mrk 766 0.0129 56 Mrk 836 0.0388 171 NGC 4051 0.0023 10 J152139.66+033729.2 0.1260 590 PHL 1092 0.3920 2150 J163631.29+420242.6 0.0610 273 PG 1244+026 0.0482 214 PG 0052+251 0.1550 739 52977 44.787 RE J1034+393 0.0424 187 J171902.28+593715.9 0.1680 808 Mrk 1239 0.0199 86 PG 1202+281 0.1650 792 65707 44.207 Mrk 957 0.0711 321 Mrk 1146 0.0389 172 Mrk 507 0.0559 250 Mrk 590 0.0265 116 Mrk 291 0.0352 155 IRAS 07598+6508 0.1480 703 Mrk 493 0.0313 137 VII Zw 244 0.1310 615 PG 1448+273 0.0650 292 Mrk 106 0.1230 575 Mrk 705 0.0292 128 Mrk 1298 0.0600 269 KUG 0301+002 0.0445 197 Ton 1542 0.0640 287 J082912.67+500652.3 0.0434 192 NGC 4593 0.0090 39 J024912.86-081525.6 0.0294 129 Mrk 231 0.0427 189 IRAS 04312+4008 0.0205 89 Ton 730 0.0870 397 Mrk 110 0.0353 155 Mrk 279 0.0305 134 J131305.80+012755.9 0.0294 128 PG 1415+451 0.1140 530 J094310.12+604559.1 0.0743 336 PG 1519+226 0.1370 646 Mrk 142 0.0450 199 PG 2209+184 0.0700 316 Mrk 42 0.0246 107 III Zw 2 0.0893 408 J142748.28+050222.0 0.1060 490 Mrk 141 0.0417 184 IC 3599 0.0215 94 PG 1149-110 0.0490 218 J170246.09+602818.9 0.0690 311 IC 4329A 0.0160 69 J114008.71+030711.4 0.0811 368 PG1416-129 0.1290 605 68857 44.127 J145047.19+033645.4 0.0670 302 PG 2304+042 0.0420 186 J124035.81-002919.4 0.0810 368 J151653.22+190048.2 0.1900 926 J125055.28-015556.8 0.0814 370 PG 0804+761 0.1000 460 J135724.52+652505.8 0.1060 490 PG 0923+201 0.1900 926 J141234.68-003500.0 0.1270 595 PG 1411+442 0.0896 410 28507 44.317 J144507.30+593649.9 0.1280 600 PG 1626+554 0.1320 620 42707 44.457 IRAS 15462-0450 0.0998 459 PG 1048+382 0.1670 802 35507 44.497 J172759.15+542147.0 0.0995 458 PG 1114+445 0.1440 682 53007 I Zw 1 0.0611 274 PG 0844+349 0.0640 287 23007 PG 1211+143 0.0809 368 PG 1116+215 0.1770 856 35307 PKS 0558-504 0.1370 646 Mrk 1383 0.0865 395 66207 IRAS11119+3257 0.1890 920 PG 1435-067 0.1260 590 31807 IRAS13349+2438 0.1080 500 Mrk 876 0.1290 605 88107 44.677 PG1404+226 0.0980 450 Mrk 877 0.1140 530 59407 44.257 Mrk 478 0.0770 349 Mrk 304 0.0658 296 57007 44.417 PHL 1811 0.1920 936 PG1322+659 0.1680 808 28507 44.517 PG 0026+149 0.1450 687 PG 1151+117 0.1770 856 47707 44.707 PG 1402+261 0.1640 786 PG1307+085 0.1550 739 43807 44.787 PG 1115+047 0.1550 739 PG1309+355 0.1840 893 49107 45.087 PG 1001+054 0.1600 765 IRAS 21219-1757 0.1130 525 208010 44.2310 PG 2130+099 0.0620 278 PKS 2349-01 0.1740 840 54807 44.827 IRAS 03450+0055 0.0310 136 PG1012+008 0.1870 909 32207 44.637 PG 1011-040 0.0580 259 Mrk 734 0.0502 223 Mrk 486 0.0389 172 IRAS 20237-1547 0.1920 936 ESO 323-G077 0.0149 64 PG 1552+085 0.1190 555
NLS1 BLS1 Source Name PID Date Int. Time Ref Source Name PID Date Int. time Ref (1) (2) (3) (4) (5) (1) (2) (3) (4) (5) Ark 564 20241 2005 Dec. 17 14x5 1 Fairall 9 30572 2007 Jun. 16 14x2 1 IRAS 13224-3809 20241 2005 Jul. 04 14x5 1 IRAS 13342+3932 00105 2004 May. 13 60x2 4 1H 0707-495 20241 2006 Nov. 15 14x5 1 FBS 0732+396 20741 2006 Apr. 23 14x4 1 Ton S180 20241 2005 Jul. 08 14x5 1 J095504.55+170556.3 00049 2004 Apr.19 14x2 2 Mrk 1044 20241 2005 Aug. 04 14x5 1 J130842.24+021924.4 20741 2006 Jan. 28 14x4 1 Mrk 335 20241 2005 Jul. 08 14x5 1 J131305.68-021039.2 20741 2006 Jan. 31 14x4 1 Mrk 359 20241 2006 Jan. 15 14x5 1 J141556.84+052029.5 20741 2066 Mar. 09 14x4 1 Mrk 896 20241 2005 Nov. 20 14x5 1 IRAS F14463+3612 40991 2007 Jun. 20 60x1 1 Mrk 766 20241 2006 Jun. 22 14x5 1 Mrk 836 20741 2006 Jan. 27 14x4 1 NGC 4051 20241 2005 Dec. 11 14x5 1 J152139.66+033729.2 20741 2005 Aug. 13 14x4 1 PHL 1092 20241 2006 Jan. 15 14x5 1 J163631.29+420242.6 20741 2005 Aug. 15 14x4 1 PG1244+026 20241 2005 Jul. 02 14x5 1 PG1416-129 20142 2005 Aug. 15 60x2 3 RE J1034+393 20241 2005 Dec. 16 14x5 1 J171902.28+593715.9 40038 2007 Jun. 15 60x2 1 Mrk 1239 20241 2006 Dec. 19 14x5 1 PG0052+251 00082 2004 Jan. 04 14x1 6 Mrk 957 20241 2006 Jan. 01 14x5 1 Mrk 1146 20741 2006 Jan. 15 14x4 1 Mrk 507 20241 2005 Jul. 01 14x5 1 Mrk 590 00086 2006 Jan. 20 14x2 3 Mrk 291 20241 2005 Aug. 13 14x5 1 IRAS 07598+6508 00105 2004 Feb. 29 14x3 4 Mrk 493 20241 2005 Aug. 15 14x5 1 VII Zw 244 03187 2005 Nov. 14 60x2 5 PG 1448+273 20241 2055 Jul. 01 14x5 1 Mrk 106 20741 2006 May. 20 14x4 1 Mrk 705 20241 2006 May. 28 14x5 1 Mrk 1298 03187 2005 Jul. 01 60x2 5 KUG 0301+002 20741 2006 Sep. 09 14x4 1 Ton 1542 03187 2005 Jul. 07 60x2 5 J082912.67+500652.3 20741 2006 Apr. 24 14x4 1 NGC 4593 00086 2005 Jul. 02 14x2 3 J024912.86-081525.6 30119 2007 Feb. 09 60x2 1 Mrk 231 00105 2004 Apr. 14 14x2 4 IRAS 04312+4008 30715 2007 Mar. 24 14x4 1 Ton 730 20142 2006 Jan. 19 60x2 3 Mrk 110 20142 2006 May. 20 60x2 3 Mrk 279 00666 2003 Nov. 16 14x1 8 J131305.80+012755.9 20741 2006 Jan. 28 14x4 1 PG 1415+451 20142 2006 Jan. 18 60x2 3 J094310.12+604559.1 20741 2006 May. 20 14x4 1 PG 1519+226 20142 2005 Aug. 13 60x2 3 Mrk 142 20142 2006 May. 27 60x2 3 PG 2209+184 20142 2006 Jun. 25 60x2 3 Mrk 42 30715 2007 Jun. 14 60x8 1 III Zw 2 00086 2005 Jul. 10 14x2 3 J142748.28+050222.0 20741 2006 Jul. 24 14x4 1 Mrk 141 20741 2005 Nov. 15 14x4 1 IC 3599 30715 2006 Jun. 24 60x4 1 PG 1149-110 20142 2005 Aug. 13 60x2 3 J170246.09+602818.9 30119 2006 Aug. 07 60x2 1 IC 4329A 00086 2004 Jul. 13 14x2 3 J114008.71+030711.4 30119 2007 Jun. 11 14x7 1 PG1202+281 20142 2006 Jun. 22 60x2 3 J145047.19+033645.4 20741 2005 Aug. 15 14x4 1 PG 2304+042 20142 2005 Dec. 17 60x2 3 J124035.81-002919.4 20741 2005 Jul. 14 14x4 1 J151653.22+190048.2 00049 2004 Apr. 01 14x1 2 J125055.28-015556.8 30119 2006 Jul. 24 14x7 1 PG 0804+761 00014 2004 Mae. 02 14x3 4 J135724.52+652505.8 30119 2006 Dec. 23 60x2 1 PG 0923+201 03187 2005 Nov. 12 60x2 5 J141234.68-003500.0 30119 2006 Jul. 24 14x7 1 PG 1411+442 03187 2005 Jan. 11 60x2 5 J144507.30+593649.9 30119 2006 Dec. 23 60x2 1 PG 1626+554 03187 2005 Jan. 08 60x5 5 IRAS 15462-0450 00105 2004 Mar. 03 60x1 4 PG 1048+382 20142 2006 Jan. 31 60x2 3 J172759.15+542147.0 30119 2006 Aug. 04 60x2 1 PG 1114+445 20142 2006 May. 07 60x2 3 I Zw 1 00014 2004 Jan. 07 14x2 4 PG 0844+349 03187 2005 Nov. 14 60x2 5 PG 1211+143 00014 2004 Jan. 08 14x3 4 PG 1116+215 00082 2004 May. 14 6x1 6 PKS 0558-504 00082 2004 Mar. 27 14x1 1 Mrk 1383 03187 2005 Feb. 13 60x2 5 IRAS 11119+3257 00105 2004 May. 13 60x1 4 PG 1435-067 03187 2007 Jul. 12 60x2 5 IRAS 13349+2438 00061 2005 Jun. 07 14x5 7 Mrk 876 03187 2004 Nov. 15 60x2 5 PG1404+226 20142 2006 Mar. 05 60x2 3 Mrk 877 03187 2005 Mar. 15 60x3 5 Mrk 478 03187 2005 Jan. 14 60x2 5 Mrk 304 03187 2004 Nov. 15 60x3 5 PHL 1811 30426 2006 Nov. 12 14x2 1 PG 1322+659 20142 2006 Jun. 21 60x2 3 PG 0026+149 03187 2005 Aug. 11 240x4 5 PG 1151+117 00082 2003 Dec. 18 6x1 6 PG 1402+261 00082 2004 Jun. 08 14x1 6 PG1307+085 00082 2006 Jan. 19 6x1 3 PG 1115+047 20142 2006 May. 27 60x2 3 PG1309+355 00082 2004 May. 14 6x1 6 PG 1001+054 03187 2005 May. 23 240x2 5 IRAS 21219-1757 03187 2004 Nov. 16 60x2 5 PG 2130+099 00014 2004 Jun. 06 14x3 4 PKS 2349-01 03187 2004 Dec. 13 60x3 5 IRAS 03450+0055 00082 2004 Aug. 31 6x1 7 PG1012+008 20142 2006 dec. 19 14x7 3 PG 1011-040 20142 2006 Jun. 23 60x2 3 Mrk 734 00014 2004 May. 13 14x3 4 Mrk 486 03421 2005 Jan. 06 60x3 9 IRAS 20237-1547 00105 2004 Apr. 19 60x2 4 ESO 323-G077 30745 2006 Aug. 06 14x2 1 PG 1552+085 20142 2005 Aug. 13 60x2 3
NLS1 BLS1 Source Name fν (AGN) FPAH Lν (AGN) LPAH R Source Name fν (AGN) FPAH Lν (AGN) LPAH R (1) (2) (3) (4) (5) (6) (1) (2) (3) (4) (5) (6) Ark 564 67.6 0.31 4.70 0.043 0.09 Fairall 9 159 0.74 41.2 0.39 0.09 IRAS 13224-3809 17.8 9.58 2.17 2.26 IRAS 13342+3932 20.2 90.6 19.4 2.15 1H 0707-495 10.0 0.33 1.97 0.13 0.66 FBS 0732+396 26.5 0.20 47.9 0.71 0.15 Ton S180 4.7 0.62 2.17 0.58 2.66 J095504.55+170556.3 6.8 0.78 17.5 4.0 2 Mrk 1044 50.9 1.56 0.11 0.71 J130842.24+021924.4 1.0 0.35 2.62 1.8 7.0 Mrk 335 108.9 0.53 8.27 0.080 0.10 J131305.68-021039.2 5.5 4.77 0.51 1.1 Mrk 359 28.8 0.98 0.17 1.34 J141556.84+052029.5 1.9 0.37 3.95 0.15 3.9 Mrk 896 27.4 2.18 0.22 1.01 IRAS F14463+3612 9.5 0.16 15.6 0.51 0.33 Mrk 766 97.4 1.81 0.19 1.03 Mrk 836 3.8 0.33 0.66 0.12 1.8 NGC 4051 144 0.084 0.008 0.96 J152139.66+033729.2 7.5 0.21 15.6 0.90 0.6 PHL 1092 10.5 0.35 289 19 0.67 J163631.29+420242.6 2.6 0.37 1.16 0.33 2.8 PG1244+026 17.7 48.5 0.14 0.29 PG1416-129 7.9 17.3 0.51 0.30 RE J1034+393 30.1 6.33 0.56 0.88 J171902.28+593715.9 6.1 0.12 23.8 0.9 0.4 Mrk 1239 361 16.2 0.23 0.14 PG0052+251 21.5 0.76 70.2 5.0 0.71 Mrk 957 10.5 6.46 4.62 7.14 Mrk 1146 14.9 2.62 0.17 0.63 Mrk 507 12.7 4.73 1.77 3.75 Mrk 590 30.2 0.23 2.42 0.04 0.2 Mrk 291 4.0 0.57 0.50 8.79 IRAS 07598+6508 162.5 480 5.30 0.11 Mrk 493 32.9 3.71 0.58 1.58 VII Zw 244 11.5 26.0 0.53 0.20 PG 1448+273 19.9 0.27 10.2 0.28 0.27 Mrk 106 114 0.47 225 1.9 0.08 Mrk 705 42.2 4.13 0.29 0.70 Mrk 1298 42.1 18.2 0.29 0.16 KUG 0301+002 6.4 1.49 0.20 1.34 Ton 1542 28.3 0.12 14.0 0.12 0.08 J082912.67+500652.3 2.1 0.46 0.13 2.79 NGC 4593 150.8 1.36 0.03 0.21 J024912.86-081525.6 0.4 0.18 0.04 0.03 8.8 Mrk 231 746 159 2.65 0.17 IRAS 04312+4008 4.17 1.98 0.83 4.17 Ton 730 10.2 0.14 9.61 0.26 0.27 Mrk 110 36.5 90.6 0.04 0.005 Mrk 279 76.7 8.20 0.16 0.2 J131305.80+012755.9 1.1 0.31 0.11 0.06 5.7 PG 1415+451 16.4 27.5 0.92 0.33 J094310.12+604559.1 18.0 0.19 12.2 0.26 0.22 PG 1519+226 23.4 58.4 0.68 0.12 Mrk 142 12.2 2.90 0.47 1.63 PG 2209+184 10.1 6.02 0.40 0.66 Mrk 42 7.6 0.52 0.20 3.85 III Zw 2 39.8 0.49 39.6 0.47 0.25 J142748.28+050222.0 4.2 0.2 6.03 0.56 0.93 Mrk 141 21.3 43.3 0.58 1.34 IC 3599 3.5 0.18 0.05 2.68 PG 1149-110 16.6 4.70 0.07 0.14 J170246.09+602818.9 0.6 0.35 0.09 2.60 IC 4329A 486 14.0 0.10 0.07 J114008.71+030711.4 1.2 0.97 0.60 6.18 PG1202+281 14.9 55.8 1.02 0.18 J145047.19+033645.4 0.6 0.21 0.33 0.23 - PG 2304+042 9.2 0.14 1.89 0.06 0.3 J124035.81-002919.4 4.6 0.29 3.73 0.47 1.3 J151653.22+190048.2 70.2 1.3 360 14 0.4 J125055.28-015556.8 0.7 0.27 0.57 0.45 7.8 PG 0804+761 94.0 0.29 119 0.74 0.06 J135724.52+652505.8 1.1 0.18 15.8 0.50 3.2 PG 0923+201 25.5 0.21 131 2.20 0.2 J141234.68-003500.0 1.0 0.29 2.12 1.24 5.9 PG 1411+442 60.4 0.25 60.6 0.51 0.08 J144507.30+593649.9 0.4 0.10 0.86 0.42 4.9 PG 1626+554 11.3 26.0 0.54 0.21 IRAS 15462-0450 32.9 41.5 5.86 1.41 PG 1048+382 7.4 28.5 0.75 0.26 J172759.15+542147.0 0.7 0.10 0.88 0.25 2.8 PG 1114+445 35.2 0.12 97.9 0.65 0.07 I Zw 1 187 83.9 1.45 0.17 PG 0844+349 27.0 0.18 13.3 0.17 0.13 PG 1211+143 72.8 0.55 58.8 0.88 0.15 PG 1116+215 59.0 0.70 258 6.2 0.24 PKS 0558-504 23.8 59.4 3.31 0.56 Mrk 1383 55.6 0.18 51.7 0.33 0.06 IRAS 11119+3257 56.2 285 8.50 0.30 PG 1435-067 17.8 0.14 37.0 0.57 0.15 IRAS 13349+2438 321 0.45 479 1.34 0.03 Mrk 876 53.4 117 4.45 0.38 PG 1404+226 9.0 10.9 0.38 0.35 Mrk 877 24.5 0.12 41.1 0.39 0.10 Mrk 478 51.2 37.3 1.76 0.47 Mrk 304 55.1 0.18 28.8 0.18 0.06 PHL 1811 58.7 308 4.71 0.15 PG1322+659 15.9 62.0 1.37 0.22 PG 0026+149 16.8 0.10 47.4 0.55 0.12 PG 1151+117 10.5 1.0 46.0 8.9 1.9 PG 1402+261 40.2 0.35 149 2.6 0.18 PG1307+085 18.1 1.3 59.1 8.2 1.4 PG 1115+047 13.7 44.8 2.81 0.63 PG1309+355 25.5 1.1 122 10 0.8 PG 1001+054 15.3 53.6 0.96 0.18 IRAS 21219-1757 69.6 115 1.73 0.15 PG 2130+099 87.2 0.45 40.3 0.42 0.10 PKS 2349-01 23.2 97.8 1.32 0.13 IRAS 03450+0055 93.5 0.90 10.3 0.20 0.19 PG1012+008 17.3 0.30 85.5 2.9 0.34 PG 1011-040 17.7 7.11 0.11 0.16 Mrk 734 37.8 11.3 0.24 0.22 Mrk 486 34.8 6.13 0.05 0.08 IRAS 20237-1547 34.7 182 20.3 1.11 ESO 323-G077 247 6.15 0.74 1.2 PG 1552+085 12.2 0.10 22.4 0.36 0.16
| Zone | R (NLS1) | R (BLS1) | FSB |
|---|---|---|---|
| A1 | 0.185 | - | - |
| A2 | 0.387 | 0.085 | 4.6 |
| B1 | 0.179 | 0.022 | 8.2 |
| B2 | 0.052 | 2.8 | |
| B3 | 0.10 | ||
| C1 | 0.015 | 0.007 | 2.2 |
| C2 | 0.047 | 0.008 | 5.9 |
| C3 | 0.025 | 0.014 | 1.8 |
| D2 | 0.018 | ||
| D3 | 0.063 | 0.003 | 24 |
References
- Brandt & Gallagher (2000) Brandt, W. N., & Gallagher, S. C. 2000, New Astronomy Review, 44, 461
- Boller et al. (1996) Boller, T., Brandt, W. N., & Fink, H. 1996, A&A, 305, 53
- Boroson & Green (1992) Boroson, T. A., & Green, R. F. 1992, ApJS, 80, 109
- Boroson & Meyers (1992) Boroson, T. A., & Meyers, K. A. 1992, ApJ, 397, 442
- Boroson (2002) Boroson, T. A. 2002, ApJ, 565, 78
- Cao et al. (2008) Cao, C., Xia, X. Y., Wu, H., Mao, S., Hao, C. N., & Deng, Z. G. 2008, MNRAS, 390, 336
- Chen et al. (2009) Chen, Y.-M., Wang, J.-M., Yan, C.-S., Hu, C., & Zhang, S. 2009, ApJ, 695, L130
- Corbin (1997) Corbin, M. R. 1997, ApJS, 113, 245
- Di Matteo et al. (2005) Di Matteo, T., Springel, V., & Hernquist, L. 2005, Nature, 433, 604
- Fabian et al. (2009) Fabian, A. C., et al. 2009, Nature, 459, 540
- Ferrarese & Merritt (2000) Ferrarese, L., & Merritt, D. 2000, ApJ, 539, L9
- Gallagher et al. (2005) Gallagher, S. C., Schmidt, G. D., Smith, P. S., Brandt, W. N., Chartas, G., Hylton, S., Hines, D. C., & Brotherton, M. S. 2005, ApJ, 633, 71
- Gallo et al. (2004) Gallo, L. C., Boller, T., Tanaka, Y., Fabian, A. C., Brandt, W. N., Welsh, W. F., Anabuki, N., & Haba, Y. 2004, MNRAS, 347, 269
- Gallo (2006) Gallo, L. C. 2006, MNRAS, 368, 479
- Gebhardt et al. (2000) Gebhardt, K., et al. 2000, ApJ, 539, L13
- Genzel et al. (1998) Genzel, R., et al. 1998, ApJ, 498, 579
- Grupe et al. (2004) Grupe, D., Wills, B. J., Leighly, K. M., & Meusinger, H. 2004, AJ, 127, 156
- Grupe (2004) Grupe, D. 2004, AJ, 127, 1799
- Grupe & Mathur (2004) Grupe, D., & Mathur, S. 2004, ApJ, 606, L41
- Hao et al. (2005) Hao, L., et al. 2005, ApJ, 625, L75
- Hao et al. (2005) Hao, C. N., Xia, X. Y., Mao, S., Wu, H., & Deng, Z. G. 2005, ApJ, 625, 78
- Higdon et al. (2004) Higdon, S. J. U., et al. 2004, PASP, 116, 975
- Houck et al. (2004) Houck, J. R., et al. 2004, ApJS, 154, 18
- Kaspi et al. (2005) Kaspi, S., Maoz, D., Netzer, H., Peterson, B. M., Vestergaard, M., & Jannuzi, B. T. 2005, ApJ, 629, 61
- Kawakatu & Wada (2009) Kawakatu, N., & Wada, K. 2009, ApJ, 706, 676
- Lutz et al. (2008) Lutz, D., et al. 2008, ApJ, 684, 853
- Maiolino et al. (2007) Maiolino, R., Shemmer, O., Imanishi, M., Netzer, H., Oliva, E., Lutz, D., & Sturm, E. 2007, A&A, 468, 979
- Marconi & Hunt (2003) Marconi, A., & Hunt, L. K. 2003, ApJ, 589, L21
- Marconi et al. (2004) Marconi, A., Risaliti, G., Gilli, R., Hunt, L. K., Maiolino, R., & Salvati, M. 2004, MNRAS, 351, 169
- Marziani et al. (2003) Marziani, P., Sulentic, J. W., Zamanov, R., Calvani, M., Dultzin-Hacyan, D., Bachev, R., & Zwitter, T. 2003, ApJS, 145, 199
- Mathur (2000) Mathur, S. 2000, MNRAS, 314, L17
- Mathur et al. (2001) Mathur, S., Kuraszkiewicz, J., & Czerny, B. 2001, New Astronomy, 6, 321
- Mulchaey et al. (1996) Mulchaey, J. S., Wilson, A. S., & Tsvetanov, Z. 1996, ApJS, 102, 309
- Nardini et al. (2008) Nardini, E., Risaliti, G., Salvati, M., Sani, E., Imanishi, M., Marconi, A., & Maiolino, R. 2008, MNRAS, 385, L130
- Netzer & Trakhtenbrot (2007) Netzer, H., & Trakhtenbrot, B. 2007, ApJ, 654, 754
- Netzer et al. (2007) Netzer, H., et al. 2007, ApJ, 666, 806
- Netzer (2009) Netzer, H. 2009, ApJ, 695, 793
- Osterbrock & Pogge (1985) Osterbrock, D. E., & Pogge, R. W. 1985, ApJ, 297, 166
- (39) Pet, R. & Peto, J. 1972, Journal of the Royal Statistical Society, Series A (General) 135 (2): 185–207
- Peterson et al. (2000) Peterson, B. M., McHardy, I. M., & Wilkes, B. J. 2000, New Astronomy Review, 44, 491
- Risaliti et al. (2006) Risaliti, G., et al. 2006, MNRAS, 365, 303
- Rowan-Robinson (1995) Rowan-Robinson, M. 1995, MNRAS, 272, 737
- Rowan-Robinson & Efstathiou (2009) Rowan-Robinson, M., & Efstathiou, A. 2009, MNRAS, 399, 615
- Schmid et al. (2003) Schmid, H. M., Appenzeller, I., & Burch, U. 2003, A&A, 404, 505
- Shemmer & Netzer (2002) Shemmer, O., & Netzer, H. 2002, ApJ, 567, L19
- Shemmer et al. (2004) Shemmer, O., Netzer, H., Maiolino, R., Oliva, E., Croom, S., Corbett, E., & di Fabrizio, L. 2004, ApJ, 614, 547
- Shi et al. (2006) Shi, Y., et al. 2006, ApJ, 653, 127
- Shi et al. (2007) Shi, Y., et al. 2007, ApJ, 669, 841
- Silk & Rees (1998) Silk, J., & Rees, M. J. 1998, A&A, 331, L1
- Smith et al. (2003) Smith, P. S., Schmidt, G. D., Hines, D. C., & Foltz, C. B. 2003, ApJ, 593, 676
- Spoon et al. (2002) Spoon, H. W. W., Keane, J. V., Tielens, A. G. G. M., Lutz, D., Moorwood, A. F. M., & Laurent, O. 2002, A&A, 385, 1022
- Spoon et al. (2007) Spoon, H. W. W., Marshall, J. A., Houck, J. R., Elitzur, M., Hao, L., Armus, L., Brandl, B. R., & Charmandaris, V. 2007, ApJ, 654, L49
- Sturm et al. (2005) Sturm, E., et al. 2005, ApJ, 629, L21
- Tacconi et al. (2002) Tacconi, L. J., Genzel, R., Lutz, D., Rigopoulou, D., Baker, A. J., Iserlohe, C., & Tecza, M. 2002, ApJ, 580, 73
- Tanaka et al. (2004) Tanaka, Y., Boller, T., Gallo, L., Keil, R., & Ueda, Y. 2004, PASJ, 56, L9
- Thomas et al. (1998) Thomas, H.-C., Beuermann, K., Reinsch, K., Schwope, A. D., Truemper, J., & Voges, W. 1998, A&A, 335, 467
- Thompson et al. (2009) Thompson, G. D., Levenson, N. A., Uddin, S. A., & Sirocky, M. M. 2009, ApJ, 697, 182
- Véron-Cetty et al. (2001) Véron-Cetty, M.-P., Véron, P., & Gonçalves, A. C. 2001, A&A, 372, 730
- Véron-Cetty & Véron (2006) Véron-Cetty, M.-P., & Véron, P. 2006, A&A, 455, 773
- Whalen et al. (2006) Whalen, D. J., Laurent-Muehleisen, S. A., Moran, E. C., & Becker, R. H. 2006, AJ, 131, 1948
- Weedman & Houck (2008) Weedman, D. W., & Houck, J. R. 2008, ApJ, 686, 127
- Zheng et al. (2002) Zheng, X. Z., Xia, X. Y., Mao, S., Wu, H., & Deng, Z. G. 2002, AJ, 124, 18
- Zhou et al. (2006) Zhou, H., Wang, T., Yuan, W., Lu, H., Dong, X., Wang, J., & Lu, Y. 2006, ApJS, 166, 128
- Zwicky & Zwicky (1971) Zwicky, F., & Zwicky, M. A. 1971, Guemligen: Zwicky, —c1971,