Imaging-based Parametric Resonance in an Optical Dipole Atom Trap
Abstract
We report sensitive detection of parametric resonances in a high-density sample of ultracold atoms confined to a far-off-resonance optical dipole trap. Fluorescence imaging of the expanded ultracold atom cloud after a period of parametric excitation shows significant modification of the atomic spatial distribution and has high sensitivity compared with traditional measurements of parametrically-driven trap loss. Using this approach, a significant shift of the parametric resonance frequency is observed, and attributed to the anharmonic shape of the dipole trap potential.
pacs:
37.10.Gh, 37.10.JkParametrically driven processes are ubiquitous in nature, and occur in a range of classical and quantum systems Pippard ; Strogatz ; Davidson ; Insperger ; Kobes . In a parametrically driven system, a system parameter may be harmonically varied in time. For a one-dimensional harmonic oscillator with a characteristic frequency , such excitation generates resonances at frequencies , where n is an integer n = 1,2,.. A familiar example is the inverted pendulum, which may be stabilized against decay of small oscillations by appropriately driving the pivot point. One important role of parametric excitation in atomic physics is its influence on ultracold atoms confined in magneto-optical Kim1 , magnetic Kumakura ; Yanbo ; Zhang ; Singh , and optical dipole traps Friebel ; Savard ; Gehm ; Grimm ; Gardiner . For situations where long lived traps are desirable, excitation due to noise in the trap parameters normally heats the atoms and thus leads to atoms being expelled from the trap. Under some circumstances parametric driving of a system with an anharmonic potential can also cool the atom cloud Kumakura ; Yanbo ; Zhang . The lifetime of the trap is limited by technical noise in any of the trap parameters Savard ; Gehm ; Grimm , two important ones for optical dipole traps being the pointing stability and the intensity noise characteristics of the trapping lasers. In addition to this deleterious effect, parametric resonance is a useful and widely employed tool for characterizing the shape of the trap, including the harmonic frequencies of the trap Grimm . This is important in experiments where the spatial shape of the trapping potential is needed for interpretation of the results. In experiments in our laboratory, we are interested in obtaining a high density of atoms in an optical dipole trap, and in knowing the peak density as well as possible. This requires that the number of atoms, atom temperature, and shape of the trapping potential be well known. A main goal of these experiments is to study the electromagnetic analog of Anderson Localization Havey1 ; CommentAMO ; LPLReview ; Akkermans1 of light in an ultracold atomic gas.
In this paper we present experimental results on parametric excitation of a sample of ultracold atoms confined in an optical dipole trap. Such studies are frequently done by measuring the relative number of atoms that are removed from the trap as excitation parameters are varied. In the present case we measure instead modification of images of the ultracold cloud following parametric excitation and a subsequent period of free expansion. Analysis of the images provides a more sensitive measure of the effects of parametric excitation, including clear evidence of the frequency shift of the parametric resonance frequency due to trap anharmonicity Zhang ; Yanbo ; Jauregui . In the following we provide a brief description of the experimental apparatus. This is followed by presentation of the measured images and their analysis.
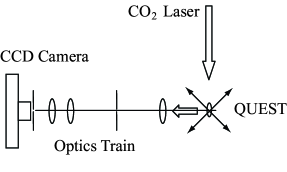
A schematic of the experimental apparatus is shown in Fig. 1. In the figure, the central part of the experimental apparatus is a magneto optical trap (MOT) confining ultra cold atoms. The MOT is a vapor-loaded trap formed in a vacuum chamber with a base pressure Torr. The six MOT beams are derived from an external cavity diode laser (ECDL) with the grating arranged in Littrow configuration. The master diode laser is frequency locked to a saturation absorption feature produced in a Rb vapor cell. The laser power is increased by injecting the output into a slave laser, thus providing more than 20 mW of light in trapping laser beams of cross sectional area 2 . The slave output is switched and spectrally shifted as required with an acousto optical modulator (AOM) to a frequency about 18 MHz below the trapping transition. The repumper laser is also an ECDL of the same design as the MOT laser, and is locked to the hyperfine transition. The repumper delivers a beam of maximum intensity 0.6 and is delivered along the same optical path as the trapping laser beams. Repumper switching is controlled with an AOM.
The cold atom sample is initially produced in the higher energy F = 2 hyperfine level. Direct absorption imaging measurements of the peak optical depth on the transition yielded, for this sample, 10 in a Gaussian radius of = 0.45 mm MOTFormulas . This corresponds to a total number of atoms and a peak number density . However, the main goal is to transfer the trapped atoms to a carbon-dioxide () laser-based optical dipole trap. The 100 W laser operates at 10.6 . The laser is focussed to a radial spot size of 55 , and a corresponding Rayleigh range of 750 . The laser focal zone is overlapped with the MOT trapping region, while application of the beam itself is controlled by a 40 MHz AOM. After the atom sample is formed in the MOT, the laser is applied and the sample is compressed and loaded into the quasi static dipole trap (QUEST). This is done by detuning the MOT master laser 60 MHz to the low frequency side of the trapping transition, while simultaneously lowering the repumper intensity by an order of magnitude. The resulting temporal dark spot MOT loads the atoms into the lower energy F = 1 hyperfine component, with about 15 of the MOT atoms transferred to the QUEST. It is important to note that this transfer efficiency is measured after a QUEST holding period of about 1 second, during which the atomic sample collisionally evolves towards thermal equilibrium. Measurements of the QUEST characteristics, after the hold period, by absorption imaging, parametric resonance, and the measured number of atoms transferred show a sample with peak density about 6 1013 and a temperature of 65 . The 1/e lifetime of the confined atoms is greater than 5 s, limited by background gas collisions. The residual magnetic field in the sample area, when the MOT quadrupole field is switched off, is estimated to be a few mG.
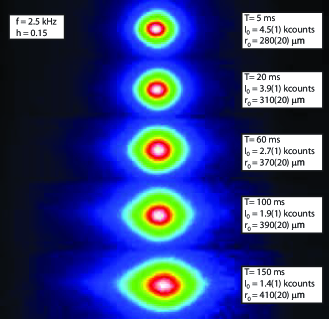
Here we are concerned with parametric excitation of atoms confined to the QUEST and the sample characteristics. The sample is excited by modulation of the power which, for a Gaussian focused beam, determines both axial and radial harmonic trap frequencies. Here these are about 1.25 kHz for radial excitation and 50 Hz for axial excitation; imposition of acoustic modulation on the laser AOM in the range 0 - 10 kHz is then sufficient to drive the fundamental parametric resonances. The characteristics of the modulation are the modulation frequency f, the modulation time T, and the modulation depth h. Detection of the result of excitation is made in two ways, each based on measurements on an image of the QUEST following a 3 ms period of free expansion. The expansion period allows the density of the sample to be reduced sufficiently that the QUEST becomes optically thin, so that measurement of light scattered from the sample is proportional to the number of atoms in the sample. In the first more traditional method, loss of a certain number of atoms is made through measurement of the total intensity of light scattered from the sample. This trap loss method measures the survival probability of atoms in the trap. In the second method, and the one we focus on here, the average peak intensity in the central region of the image is measured; this is proportional to the survival probability of atoms more localized spatially in the harmonic region of the trap, even after a time T of parametric resonance. The main measured quantities are fluorescence images of the expanded atomic cloud, these being recorded for different h, T, and f. Characteristic results are shown in Fig. 2, where the images show a clear increase in the axial and radial Gaussian radii and a loss in peak intensity as T is increased at fixed h and f = 2.5 KHz. We also draw attention to the change in shape of the cloud with increasing T. This is due to heating of the atom sample while it is confined, and consequent expansion in the weakly confining axial direction.
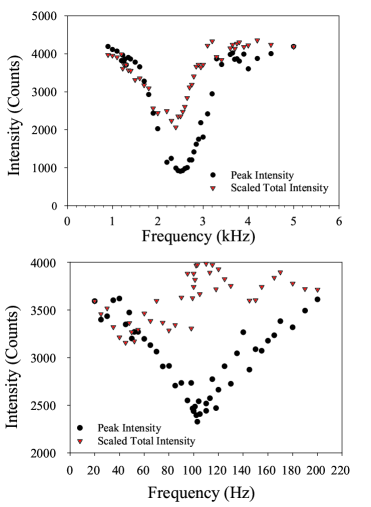
We begin our analysis by showing in Fig. 3(a) the excitation spectrum in the spectral vicinity of the fundamental radial resonance. Two sets of data are displayed. In the first, we show the total number of trap atoms surviving the parametric excitation, while in the second we show the depletion of signal from the central spatial region of the atom cloud image. The differences between the two are striking. First, even for the quite large modulation depth of 15 the total trap loss, as a fraction of the entire signal level, is clearly weaker than the depletion signal. The second main feature is that the trap loss signal is shifted by -0.3(1) KHz to lower frequencies. Both aspects of the total trap loss signals represent significant experimental disadvantages if one wants to characterize the lower energy portion of the optical dipole trap potential. We attribute the frequency shift to the anharmonic nature of the trapping potential; as the average amount of excitation energy of atoms in the trap increases, the resonance harmonic frequency for those atoms decreases, shifting the resonance to lower values. Because the resonances can be intrinsically quite broad, this shifts the overall response to lower frequencies. Roughly speaking, one can envision the process as parametric evolution of an atom distribution localized deep in the trap to a warmer one which is more broadly distributed over the attractive part of the optical dipole potential. This leads to a ’freezing out’ of the parametric resonance condition and to a depletion of the number of atoms in the deepest part of the atom trap. We emphasize that similar results are obtained for a range of h and T, but that the shift of the resonance to lower frequencies becomes more pronounced as h is increased. Within the range of our data, the resonance positions are insensitive to T. We illustrate the point further in Fig. 3(b), which shows the main axial resonance for the same two measurement approaches used in Fig. 3(a), but for a larger modulation depth of 20 . In this data, there is no clear resonance for the trap loss signal, but a distinct one appearing at about 105 Hz for the depletion signal. The spectral location of this resonance is, within the experimental uncertainty, where it is expected based on the spectral location of the fundamental radial mode at 2.5 kHz, and assuming a trap formed at the focus of a Gaussian trapping beam.
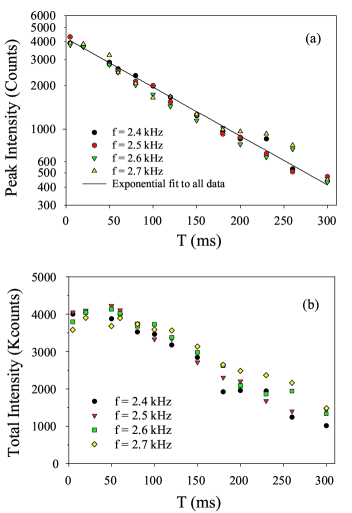
We now turn our attention to the role of the modulation time T, which represents the amount of time that the trap depth is modulated before the atoms are released. Physically, T represents the amount of time that energy may be delivered to the ultracold atom sample. We point out that this time scale is short compared to the 5 s hold time of the atom sample. The variation with T of the intensity at the peak of the image, for several modulation frequencies, is shown in Fig. 4(a). There we see that the peak image intensity appears to decrease exponentially for a range of f. This decrease is evident from the smallest T = 5 ms, and continues for a factor of 60 in T. In Fig. 4(b) the variation of the total trap loss with T for the same modulation frequencies is shown. In contrast to the peak intensity, the total intensity decreases approximately linearly with T, and further shows a threshold below which minimal variation is measured. We qualitatively interpret these results as follows: the atoms in the trap are initially in thermal equilibrium at a temperature of approximately . While the modulation is applied the average energy of the atoms is expected to increase. Further, the elastic collision rate is quite large at the experimental conditions, so the atomic cloud is expected to stay in approximate thermal equilibrium at some temperature. This temperature should increase as T increases. Even if no atoms were removed from the trap by this process, the peak intensity would still decrease, for both the spatial volume occupied by the atom cloud, and the rate of free expansion are increased as temperature is increased. However, as the trap depth is finite, some of the atoms have sufficient energy to leave the trap. This leads to a decrease in the integrated image intensity (due to trap loss), and a corresponding additional decrease in the peak image intensity. These arguments also explain why there is a threshold in the appearance of trap loss; the average amount of energy deposited per atom in the system by parametric excitation must be sufficiently large that a significant number of them have a total energy in excess of the trap depth before trap loss is observed. Additional measurements of the Gaussian width of the images (as in Fig. 2) with increasing T provide a direct measure of about 800 K/s for the heating rate, confirming this interpretation. We also point out that there is an important relationship between the results of Fig. 4(a) and 4(b): when the decrease in the total number of atoms in the trap is accounted for by the data in Fig. 4(b), the remaining decrease seen in Fig. 4(a) scales quantitatively as the mean cloud temperature , as is expected for the temperature dependent decrease in the peak intensity of a Gaussian atom cloud.
Finally we point out that increasing T does not indefinitely increase the mean temperature of the atom cloud. As predicted in Savard ; Gehm , above a certain critical amount of energy deposition in the system the temperature of the atom cloud remains constant, the additional energy going into removing additional atoms from the trap. As we show elsewhere Balik , this interpretation is supported by measurements on the variation of the Gaussian radius of the atomic cloud with T after ballistic expansion. The radius is seen to initially increase with T, but then to reach a steady value corresponding to a cloud temperature of about of the trap depth, consistent with the results of Gehm, et al. Gehm .
We acknowledge the financial support of the National Science Foundation (Grant No. NSF-PHY-0654226).
References
- (1) A.B. Pippard, The Physics of Vibration, Cambridge University Press (Cambridge, UK 1978).
- (2) Steven H. Strogatz, Nonlinear Dynamics and Chaos, Addison Wesley (Reading, MA 1994).
- (3) A. Kaplan, M. Andersen, N. Friedman, and N. Davidson, Atom-Optics Billiards, in Chaotic Dynamics and Transport in Classical and Quantum Systems, NATO Science Series II. V. 182, Kluwer Academic Publishers (Dordrecht, The Netherlands 2003).
- (4) T. Insperger and G. Stepan, Proc. R. Soc. Lond. A 458, 1989 (2002).
- (5) R. Kobes and S. Peles, arXiv:nlin/0005005 (2000).
- (6) Kihwan Kim, Heung-Ryoul Noh, and Wonho Jhe, Optics Comm. 236, 349 (2004).
- (7) M. Kumakura, Y. Shirahata, Y. Takasu, Y. Takahashi, and T. Yabuzaki, Phys. Rev. A 68, 021401(R) (2003).
- (8) Yan Bo, Li Xiao-Lin, Ke Min, and Wang Yu-Zhu, Chin. Phys. B 17, 921 (2008).
- (9) P. Zhang, H. Zhang, X. Xu, and Y. Wang, Chin. Opt. Lett. 6, 87 (2008).
- (10) M. Singh, M. Volk, A. Akulshin, A. Sidorov, R. McLean and P. Hannaford, J. Phys. B. 41, 165301 (2008).
- (11) S. Friebel, C.D’Andrea, J.Walz, M. Weitz, and T.W. Hänsch, Phys. Rev. A 57, R20 (1998).
- (12) T.A. Savard, K.M. O’Hara, and J.E. Thomas, Phys. Rev. A 56, R1095 (1997).
- (13) M.E. Gehm, K.M. O’Hara, T.A. Savard, and J.E. Thomas, Phys. Rev. A 58, 3914 (1998).
- (14) R. Grimm, M. Weidenmuller, and Y. Ovchinnokov, Adv. Atom., Mol., and Opt. Phys. 42, 95 (2000).
- (15) C.W. Gardiner, J. Ye, H.C. Nagerl, and H. J. Kimball, Phys. Rev. A 61, 045801 (2000).
- (16) M.D. Havey, Contemporary Physics, to appear (2009).
- (17) Mark D. Havey and Dmitriy V. Kupriyanov, Phys. Scr. 72, C30 (2005).
- (18) D.V. Kupriyanov, I.M. Sokolov, C.I. Sukenik, and M.D. Havey, Laser Phys. Lett. 3, 223 (2006).
- (19) E. Akkermans, A. Gero, and R. Kaiser, Phys. Rev. Lett. 101, 103602 (2008).
- (20) R. Juregui, N. Poli, G. Roati, and G. Modugno, Phys. Rev. A 64, 033403 (2001).
- (21) For a Gaussian atom distribution of size and peak density . The total number of atoms is and the peak optical depth is is the weak field resonance light scattering cross section.
- (22) S. Balik, A. Win, and M.D. Havey, in preparation.