Extrapolation of Multiplicity distribution in +() collisions to LHC energies
Abstract
The multiplicity () and pseudorapidity distribution () of primary charged particles in + collisions at Large Hadron Collider (LHC) energies of = 10 and 14 TeV are obtained from extrapolation of existing measurements at lower . These distributions are then compared to calculations from PYTHIA and PHOJET models. The existing measurements are unable to distinguish between a logarithmic and power law dependence of the average charged particle multiplicity () on , and their extrapolation to energies accessible at LHC give very different values. Assuming a reasonably good description of inclusive charged particle multiplicity distributions by Negative Binomial Distributions (NBD) at lower to hold for LHC energies, we observe that the logarithmic dependence of are favored by the models at midrapidity. The versus for the existing measurements are found to be reasonably well described by a function with three parameters which accounts for the basic features of the distribution, height at midrapidity, central rapidity plateau and the higher rapidity fall-off. Extrapolation of these parameters as a function of is used to predict the pseudorapidity distributions of charged particles at LHC energies. calculations from PYTHIA and PHOJET models are found to be lower compared to those obtained from the extrapolated versus distributions for a broad range.
1 Introduction
The Large Hadron Collider (LHC) at CERN is designed for colliding proton-proton beams upto = 14 TeV [1]. Collisions at these unprecedented high energies will provide opportunities for new physics [1]. In order to fully exploit the enormous physics potential it is important to have a complete understanding of the reaction mechanism. The particle multiplicity distributions, one of the first measurements to be made at LHC, will be used to test various particle production models based on different physics mechanism and also provide constrains on model features. Some of these models are based on string fragmentation mechanism [2] and some are based on Pomeron exchange [3].
In this paper, we first make a compilation of the existing data on the average charged particle multiplicity (at midrapidity and full rapidity range) and charged particle pseudorapidity distribution as a function of . Then we judiciously extrapolate the measurements to obtain prediction of (for midrapidity and full rapidity range), charged particle multiplicity distributions and distributions at LHC energies of = 10 and 14 TeV. These results are also compared to calculations from PYTHIA [2] and PHOJET [3] monte carlo models. Energy dependence of average number of particles produced in +() collisions can be used to distinguish various models [4]. A statistical model [5] and some hydrodynamical models [6] predict a dependence of , whereas multiperipheral models [7] and Feynman’s scaling [8] lead to the dependence as . Such a logarithmic dependence and on higher powers of is also predicted by Regge-Mueller model [9]. Arguments based on simple phase space considerations [10] however predict a power law dependence as . In this work we show that for the data available at various , we cannot distinguish the logarithmic and power law dependences on . However the measurements at the LHC energies will provide a clear answer. The pseudorapidity distributions on the other hand is found to be described by a form which resembles a generalized Fermi distribution. Such distributions have been used to explain the pseudorapidity distributions of produced particles in hadronic collisions at ISR [11] and heavy-ion collisions at RHIC [12].
The compiled experimental data presented in this paper corresponds to Non Singly Diffractive (NSD) events for minimum bias triggers. The charged particle data were corrected for secondary interactions, gamma conversions, short lived decays (, ), reconstruction efficiency and acceptance effects by the experiments. To match the experimental conditions, the model simulations presented are also corrected for short lived decays. A transverse momentum () cut of greater than 100 MeV/ are usually used in realistic experimental conditions, as for example in ALICE experiment at LHC. Model simulations using PYTHIA and PHOJET suggest, a 6% 2% effect on the charged hadron multiplicity due to a 100 MeV/ cut-off in at = 10-14 TeV. The error of 2% comes from the difference in results from PYTHIA and PHOJET models. At LHC, while most of the experiments will have mid-rapidity measurements of charged particle multiplicity, ALICE experiment has the possibility to measure the distributions over -5.0 3.5 range [1]. The CMS and ATLAS experiments will have a more limited coverage of 2.5 units [1].
The model results presented are from PYTHIA using version 6.4 (ATLAS tuned) and those from PHOJET with version 1.12 (default settings). It may be mentioned that recently a new tuned version of PYTHIA has been released [13]. The PHOJET model combines the ideas based on a dual parton model [14] on soft process of particle production and uses lowest-order perturbative QCD for hard process. Regge phenomenology is used to parameterize the total, elastic and inelastic cross-sections. The initial and final state parton shower are generated in leading log-approximation. PYTHIA on the other hand uses string fragmentation as a process of hadronization and tends to use the perturbative parton-parton scattering for low to high particle production. Although there are several other theoretical predictions on total cross section expected at LHC energies [15], current work focuses on how a judicious extrapolation from existing multiplicity data compares to the calculations from some of the available models [2, 3].
2 Multiplicity distribution
The measurements of charged particle multiplicity distribution has been found to be well described by negative binomial distribution (NBD) at midrapidity and also for the full rapidity region in + [16]. The NBD distribution has a form,
| (1) |
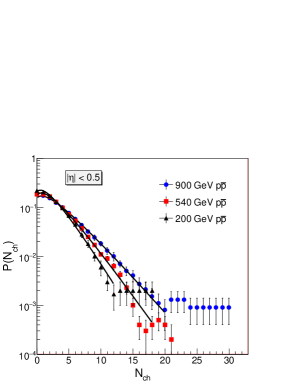
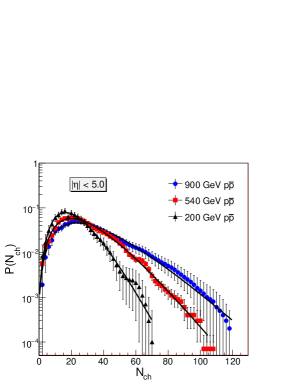
The NBD has two parameters, and . Where the parameter is an interesting quantity, 1/ 0 would correspond to Poisson distribution (independent particle production) and = 1 would correspond to Geometric distribution. Under the limit of large multiplicity ( Large), the NBD distribution goes over to a Gamma Distribution. Some of the measured multiplicity distributions at midrapidity () and over full pseudorapidity range () are fitted to NBD distribution and are shown in Fig. 1 left and right panels respectively. The NBD parameters and extracted are plotted in Fig. 2 left and right panels respectively. The CDF experiment results are not used in the current studies as they have multiplicity distributions with a high cut-off of 400 MeV/ measured within 1 [17]. PYTHIA and PHOJET model calculations suggest that there is more than 50% loss in the average number of charged particles due to a cut-off of 400 MeV/ at midrapidity. Since all other results presented have a much smaller cut-off 100 MeV/, inclusion of CDF results would make this comparative study heavily dependent on the model based extrapolation to lower regions.
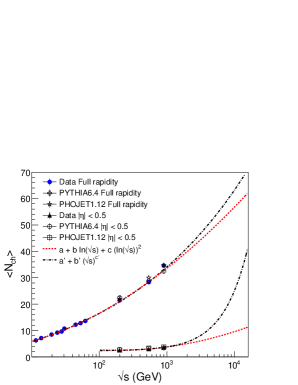
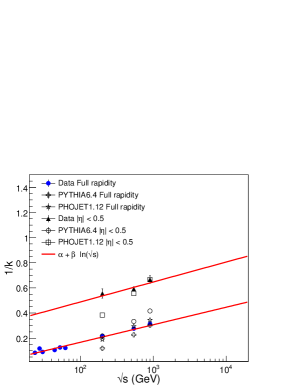
It is observed from Fig. 2 that both at midrapidity and full rapidity range the increases with while the value decreases with . The region for which measurements exists, the dependence can be described reasonably well by both the following expressions (as shown in Fig. 2),
| (2) |
and
| (3) |
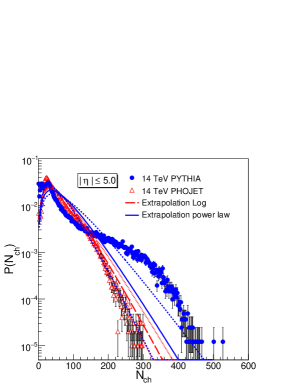
where , , , , and are fit parameters. The values of , , , , and at midrapidity are 3.8 0.1, 1.5 0.2, 0.45 0.1, 2.3 0.14, 1.5 0.13 and 1.2 0.26 respectively. For full rapidity coverage the values of , , , , and are 1.3 0.3, 0.62 0.17, 0.59 0.02, -10.5 0.86, 9.9 0.69 and 0.22 0.01 respectively. It is noted that extrapolation of the power law function to LHC energies seems to lead to a sudden increase in average charged particle multiplicity at midrapidity. Such a large unexpected jump in the multiplicities at midrapidity already seems to put constraints on applicability of such a functional form. As will be seen later in Fig. 4 such a functional form will lead to a probability distribution of charged particle multiplicity at midrapidity not showing the characteristic drop at higher multiplicity. Such a drop is expected from PYTHIA, PHOJET models and is seen for available experimental data shown in Fig. 1. In Fig. 2 the average number of charged particles from experiments at = 200, 540 and 900 GeV are compared to corresponding results from PYTHIA and PHOJET models. Both the models seem to be in reasonable agreement with the measurements at midrapidity and full rapidity.
The 1/ dependence on has the form + , where and are fit parameters. For midrapidity the values of and are 0.65 0.03 and 0.07 0.03 respectively. For full rapidity case, the values of and are -0.11 0.006 and 0.06 0.001 respectively. The results from PYTHIA and PHOJET models are also shown. At higher energies the results from PHOJET is in better agreement with the measurements compared to those from PYTHIA. For the midrapidity measurements PHOJET model calculations fail to match the data for = 200 GeV.
We have examined the charged particle multiplicity distribution from E735 Collaboration for + collisions at = 1800 GeV [18]. The multiplicity distribution is found to be well explained using the sum of two NBD functions instead of a single NBD as for the rest of the data discussed above. The sum of two NBD is given as,
| (4) |
where and have the same form as in Eqn 1, is the weight factor, and , and are the respective NBD parameters. The fit to the E735 data by this function is shown in Fig. 3.
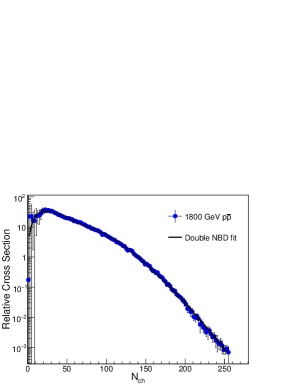
The values of various parameters obtained from the fit are, = 36.5 1.7, = 86.9 2.6, = 2.8 0.2, = 10.3 0.8 and = 0.18 0.03. The overall average value of the charged particle multiplicity is 44.4. Since this data could not be fitted to a single NBD, in contrast to the data from other energies discussed in this paper, we have not included this measurement in our extrapolation studies. Further it is observed from the Fig. 2 that the two extrapolations discussed in Eqns 2 and 3 tend to differ only above = 2000 GeV. The physics reason attributed to a different shape of multiplicity distribution at = 1800 GeV compared to those at lower energies is due to multiple parton interactions [18]. These result are also indicative of the deviation from the KNO (Koba, Nielsen and Olesen) scaling [19]. The weight factor shows the second NBD distribution dominates among the two. It will certainly be interesting to find out if this feature is more pronounced at the LHC energies.
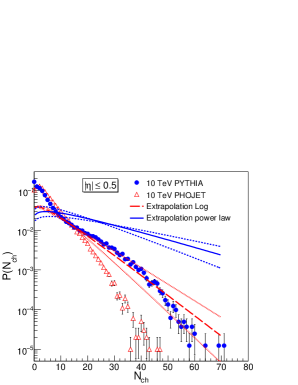
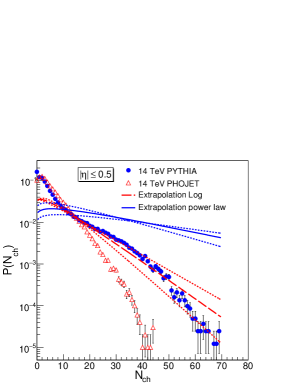
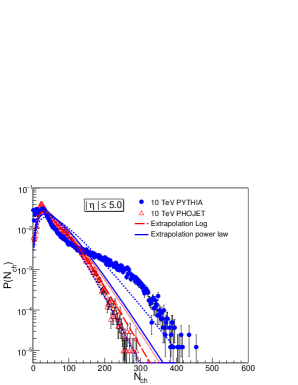
The extrapolated values of and at both midrapidity and full rapidity regions using the functional forms as in Eqns 2 and 3 for = 10 and 14 TeV are given in the Table 1. Note the difference in values of depending on the dependence on as per Eqn. 2 (logarithmic dependence) or Eqn. 3 (power law dependence). Knowing these values (parameters of NBD function) we can predict the multiplicity distributions for both midrapidity and full rapidity ranges at = 10 and 14 TeV using Eqn. 1. These distributions for both midrapidity regions and full rapidity regions are shown in Fig. 4 and Fig. 5 respectively. The left panels are for = 10 TeV and right panels are for = 14 TeV. The results when compared to PYTHIA and PHOJET model calculations show that the extrapolation of using Eqn. 2 is favored by the models at midrapidity. The extrapolated results show no such preference to models in full rapidity region. In general PYTHIA results are found to be higher compared to those from PHOJET calculations. Actual experimental measurements at LHC will confirm the preferred dependence on .
| Eqn. | (TeV) | range | ||
|---|---|---|---|---|
| Eqn. 2 | 10 | 9.6 1.1 | 1.2 0.14 | |
| Eqn. 2 | 10 | 56.7 3.8 | 2.2 0.09 | |
| Eqn. 3 | 10 | 25.0 11.5 | 1.24 0.14 | |
| Eqn. 3 | 10 | 63.7 11.3 | 2.2 0.09 | |
| Eqn. 2 | 14 | 10.8 1.3 | 1.20 0.14 | |
| Eqn. 2 | 14 | 60.7 4.0 | 2.14 0.09 | |
| Eqn. 3 | 14 | 36.2 18.5 | 1.20 0.14 | |
| Eqn. 3 | 14 | 69.4 12.2 | 2.14 0.09 |
3 Pseudorapidity distribution
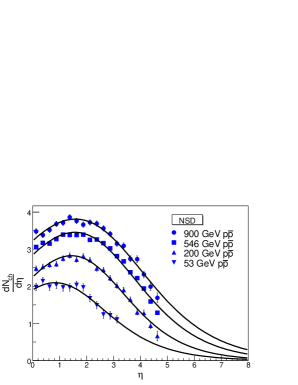
The pseudorapidity distributions of charged particles from the existing data at = 53, 200, 546 and 900 GeV [20] can be described by the following functional form,
| (5) |
This formula is chosen to describe the central plateau and the fall off in the fragmentation region of the distribution by means of the parameters and respectively. The term , is a fit parameter, describes the magnitude of the distribution and the dip at the = 0. A similar form has been used to describe the + data at ISR energies [11] and heavy-ion collisions at RHIC [12]. The distribution is a generalization of Fermi distribution and recent work suggests a relation of this functional form to string percolation model [21].
| Collision | (GeV) | |||
|---|---|---|---|---|
| + | 53 | 2.4 0.23 | 1.5 0.17 | 1.12 0.1 |
| + | 200 | 2.5 0.07 | 2.5 0.05 | 1.10 0.04 |
| + | 546 | 3.0 0.10 | 2.9 0.07 | 1.15 0.04 |
| + | 900 | 3.6 0.10 | 3.0 0.05 | 1.36 0.05 |
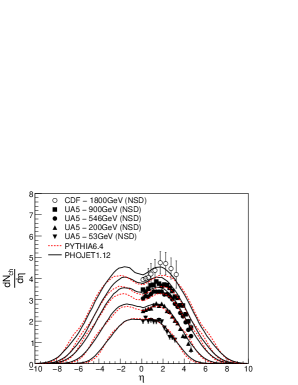
The values of the parameters , and obtained by fitting the data distributions with Eqn. 5 are given in Table 2 and the fits to data are shown in Fig. 6 (left panel). The value of parameters and are found to increase with increasing . The value of the parameter is found to be approximately independent of within errors. The constancy of is another way of demonstrating the concept of limiting fragmentation [22]. In such a scenario, multiplicity density in pseudorapidity when plotted as a function of pseudorapidity shifted by beam rapidity is expected to be independent of pseudorapidity at forward rapidities [12]. Shown in the right panel of Fig. 6 are the comparisons of the experimentally measured charged particle pseudorapidity distributions to those from the PYTHIA and the PHOJET calculations. The CDF measurements [23] are not used to obtain the parameters , and for making predictions at LHC energies as discussed later, because of their very limited coverage. It is observed that for the lowest beam energy studied, = 53 GeV, both PYTHIA and PHOJET are in very good agreement with the experimental data. As the beam energy increases PYTHIA results seems to be in better agreement with the data. While for the top energy ( = 1800 GeV [17]) studied the error bars are large to make a conclusion on which of the two models have better agreement with the data.
Using the average value of and extrapolating the value of and to = 10 and 14 TeV, we are able to predict the full pseudorapidity distribution for charged particles. The extrapolation is done by fitting the variation of with with a functional form
| (6) |
and the variation of with as
| (7) |
The values of obtained are 7.63 0.87 and 8.43 1.04 for = 10 and 14 TeV respectively. Those for are 4.01 0.14 and 4.15 0.15 for = 10 and 14 TeV respectively. Assuming the functional form given in Eqn. 5 is valid for = 10 and 14 TeV and using the parameter values obtained as above, we can now predict the full pseudorapidity distribution of charged particles at = 10 and 14 TeV. These distributions are shown in Fig. 7 along with expectations calculated from PYTHIA and PHOJET models for the same collisions. The left panel shows the results for = 10 TeV and right panel shows the results for = 14 TeV.
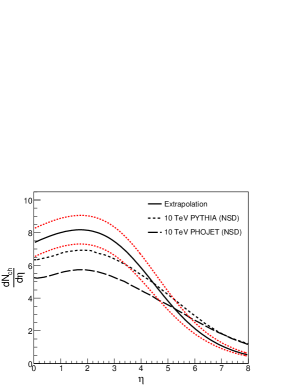
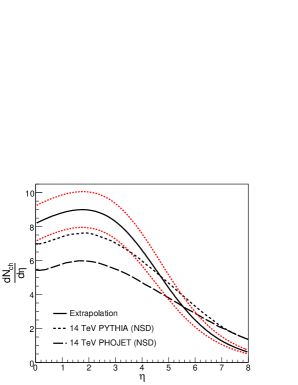
It is observed that at both = 10 and 14 TeV, the predictions from a judicious extrapolation of existing data in general are above the model predictions. The PYTHIA results are close to the lower error band (dotted lines) for 4. The values from PYTHIA are higher than those from PHOJET model calculation over a large pseudorapidity range presented. In general all the three distributions have almost similar shape. The differences between the models could arise due to several reasons. The event generation in PYTHIA is mainly designed to describe the possible hard interactions in +() collisions. It also combines sophisticated models dealing with soft hadronic interactions [2]. However in the case of PHOJET, the main approach is to describe the soft component of hadron-hadron, photon-hadron interactions at high energies. It combines the hard component calculated by perturbative QCD at the partonic level [3]. Due to the different underlying theoretical models used PYTHIA has larger model parameters which can be adjusted in order to better reproduce the data compared to PHOJET. Another difference lies in the parametrisation used get the +() cross-sections. PYTHIA uses those derived from the Pomeron exchange model while the PHOJET uses the optical theorem and cross-sections are corrected for high energies using the unitarity principle.
4 Summary
We have obtained the , distribution
and versus for = 10 and 14 TeV using extrapolations
of existing data. The results have been compared to calculations from PYTHIA and PHOJET.
Measurements at midrapidity at LHC will help distinguish whether
has a power law or a logarithmic dependence on . The shape of versus obtained from the extrapolation of information from existing measurements are very similar to
those calculated from models. PYTHIA calculations of and
distributions seem to be higher compared to those from PHOJET model.
The distributions from models suggest the multiplicity distribution at LHC
energies may not be well described by a single NBD distribution, already such a behaviour
has been seen at = 1.8 TeV [18].
Acknowledgments
Financial assistance from the Department of Atomic Energy, Government
of India is gratefully acknowledged.
References
- [1] B. Alessandro, et al., ALICE Collaboration, J. Phys. G 32 (2006) 1295; F. Carminati, et al., ALICE Collaboration, J. Phys. G 30 (2004) 1517; David G. d’Enterria,et al., CMS Collaboration, J. Phys. G 34 (2007) 2307; G. L. Bayatian, et al.,CMS Collaboration, J. Phys. G 34 (2007) 995; G. Aad, et al., ATLAS Collaboration, arXiv:0901.0512; A. Augusto Alves et al., LHCb Collaboration, JINST 3 (2008) S08005.
- [2] T. Sjostrand, et al., Computer Physics Commun. 135 (2001) 238; T. Sjostrand and M. van Zijl, Phys. Rev. D 36 (1987) 2019; T. Sjostrand and P. Skands, Eur. Phys. J. C 39 (2005) 129; T. Sjostrand and P. Skands, JHEP 0605 (2006) 026.
- [3] R. Engel, Z. Phys. C 66 (1995) 203; R. Engel, J. Ranft and S. Roesler, Phys. Rev. D 52 (1995) 1459.
- [4] S. N. Ganguli and P.K. Malhotra, Phys. Lett. B 42 (1972) 83; P. Carruthers and Minh Duong-Van, Phys. Lett. B 114 (1982) 169.
- [5] E. Fermi, Prog. Theor. Phys. 5 (1950) 570; Phys. Rev. 81 (1951) 683; P. Carruthers, Ann. NY. Acad. Sci. 229 (1974) 91.
- [6] S. Z. Belenjki and L. D. Landau, Suppl. Nuovo Cim. 3 (1956) 15.
- [7] C. E. DeTar, Phys. Rev. D 3 (1971) 128.
- [8] R. P. Feynman, Phys. Rev. Lett. 23 (1969) 1415.
- [9] A. H. Mueller, Phys. Rev. D 2 (1970) 2945; S. Rai Choudhury and D.P. Majumdar, Nucl. Phys. B 61 (1973) 502.
- [10] H. Satz, Nuovo Cim. 37 (1965) 1407; E. L. Berger and A. Krzywicki, Phys. Lett. B 36 (1971) 380.
- [11] W. Thome et al., Nucl. Phys. B 129, 365 (1977).
- [12] J. Adams et al., STAR Collaboration, Phys. Rev. Lett. 95 (2005) 062301;Phys. Rev. C 73 (2006) 03490 6; B. I. Abelev, et al., STAR Collaboration, arXiv:0906.2260; B. B. Back, et al., PHOBOS Collaboration, Phys. Rev. Lett. 91 (2003) 052303; B. B. Back, et al., PHOBOS Collaboration, Phys. Rev. C 72 (2005) 031901; B. Alver, et al., PHOBOS Collaboration, Phys. Rev. Lett. 102 (2009) 142301.
- [13] P. Z. Skands, arXiv:0905.3418.
- [14] A. Capella, et al., Phys. Rep. 236 (1994) 225.
- [15] V. A. Abromovsky and N.V. Radchenko, arXiv:0812.2465; P.Z. Skands, FERMILAB-CONF-07-706-T, 2009; M. Bahr et al., arXiv:0905.4671; A. Achilli et al., Phys. Lett. B 659 (2008) 137; M. Bahr et al., JHEP 0901 (2009) 065.
- [16] R.E. Ansorge, et al., UA5 Collaboration, Z. Phys. C 43 (1989) 357; R.E. Ansorge, et al., UA5 Collaboration, Z. Phys. C 37 (1988) 191; G. J. Alner et al., UA5 Collaboration, Phys. Lett. B 160 (1985) 193; Phys. Lett. B 167 (1986) 476; Phys. Lett. B 160 (1985) 199.
- [17] D.E. Acosta, et al., CDF Collaboration, Phys. Rev. D 65 (2002) 072005.
- [18] T. Alexopoulos, et al., E735 Collaboration, Phys. Lett. B 435 (1998) 453.
- [19] Z. Koba, H.B. Nielsen, P. Olesen, Nucl. Phys. B 40 (1972) 317.
- [20] G. J. Alner, et al., UA5 Collaboration, Z. Phys. C 33 (2004) 1.
- [21] J. Dias de Deus and J.G. Milhano, Nucl. Phys. A 795 (2007)98.
- [22] J. Benecke, et al., Phys. Rev. 188 (1969) 2159.
- [23] F. Abe, et al., CDF Collaboration, Phys. Rev. D 41 (1990) 2330.