Magneto-electric excitations in multiferroic TbMnO3 by Raman scattering
Abstract
Low energy excitations in the multiferroic material TbMnO3 have been investigated by Raman spectroscopy. Our observations reveal the existence of two peaks at 30 cm-1 and 60 cm-1. They are observed in the cycloidal phase below the Curie temperature but not in the sinusoidal phase, suggesting their magnetoelectric origin. While the peak energies coincide with the frequencies of electromagnons measured previously by transmission spectroscopy, they show surprisingly different selection rules, with the 30 cm-1 excitation enhanced by the electric field of light along the spontaneous polarization. The origins of the modes are discussed under Raman and infrared selection rules considerations.
pacs:
77.80.Bh, 75.50.Ee, 75.25.+z, 78.30.HvMultiferroics have both ferroelectricity and magnetism. For some of these materials, the magnetoelectric coupling is especially strong and has attracted much attention for new spin-based device applications Bea . Substantial efforts have been dedicated to the reseach on the origin of the close coupling between the magnetic and electric orders. TbMnO3 is one of the most intensively studied magnetoelectric manganite among the frustated magnets. The ferroelectricity in TbMnO3 appears to be induced by an inverse Dzyaloshinski-Moriya interaction Katsura ; Sergienko , even if the microscopic mechanism remains under debate Sergienko2 . The strength of the magnetoelectric coupling gives rise to dynamical effects like electromagnons, magnons with an electric dipole activity predicted by Baryachtar and Chupis Baryakhtar . Such excitations have been observed by far infrared transmission Pimenov ; Takahashi ; Sushkov ; Valdes ; Lee ; Pimenov2 . This spectroscopy detects electromagnons for electric field of light E parallel to the axis of the crystal at around 2.5 meV (20 cm-1) and 7.5 meV (60 cm-1). Inelastic neutron measurements detect magnetic excitations at the same energies along the same crystallographic direction Sneff . From a theoretical point of view, Katsura et al. have proposed a model based on spins current to describe the electromagnons Katsura2 . This model can be regarded as an inverse Dzyaloshinskii-Moriya effect and predicts the observation of one electromagnon (25 cm-1) with selection rule E a-axis perpendicular to the bc plane in the spiral phase. Recent approaches based on indirect Heisenberg exchange Sushkov2 and on cross-coupling between magnetostriction and spin-orbit interactions Sousa were proposed to explain respectively one electromagnon (60 cm-1) and the both excitations (30 and 60 cm-1). Optical spectroscopies have different selection rules and the scattering processes involved in each spectroscopy should be differently sensitive to the electric dipole activity of the electromagnons. Among them, Raman scattering is an efficient probe for studying both magnetic (magnons) and ferroelectric (phonons) excitations and their mutual coupling Cazayous ; Singh ; Scott1 ; Cazayous2 . However, up to now the electromagnon signature in TbMnO3 has not been detected by Raman scattering.
Here, we investigate the magnetic excitations in TbMnO3 through Raman measurements. Our study reveals magnons at 30 cm-1 and 60 cm-1 with the electric field of light E a. The intensity of the magnon at 30 cm-1 is enhanced with electric field E c, the magnon at 60 cm-1 disappears and a strong band is detected at 128 cm-1. Both magnetic modes (30 cm-1 and 60 cm-1) are only observed in the ferroelectric phase (cycloidal phase) which points out their electric-dipole activity. The band at 128 cm-1 presents the same frequency shift as a function of the temperature as the 113 cm-1 polar phonon. In a magnon-phonon scattering scenario, this indicates that the band at 128 cm-1 comes from a second order scattering process involving the 30 cm-1 magnon and the 113 cm-1 phonon.
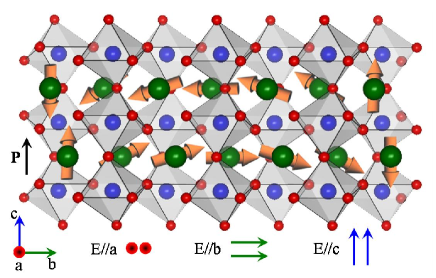
TbMnO3 single crystals were grown using the floating zone method and crystallize in the orthorhombic symmetry of space group Pbnm Sakata . Below the Néel temperature K the Mn magnetic moments order antiferromagnetically in an incommensurate sinusoidal wave with a modulation vector along the axis (sinusoidal phase). At still lower temperature K, the spin wave modulation continuously transforms into a cycloid (cycloidal phase) with spins confined to the plane (Fig. 1). This transition is associated with the appearance of a spontaneous electric polarization along the axis. In this work, two samples with and planes have been investigated.
We have performed Raman measurements in a backscattering geometry with a triple spectrometer Jobin Yvon T64000 using the 568 nm excitation line from a Ar+-Kr+ mixed gas laser. Tiny signals have been obtained with other laser wavelengths. The high rejection rate of the spectrometer allows us to detect the magnons at frequencies below 100 cm-1. The temperature dependences have been performed using a ARS closed cycle He cryostat. Figure 1 shows the two configurations of light polarizations used. Incident and scattered lights are polarized along the same crystallographic axis.
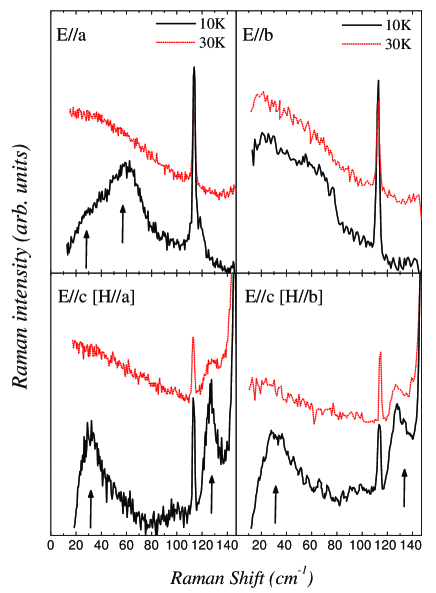
Figure 2 shows the Raman response with different light polarizations in the cycloidal (below TC) and sinusoidal phases (below TN). (E, H) are the electric and magnetic fields of the light, respectively. In E a, a strong peak is observed at 60 cm-1 and a shoulder at 30 cm-1 (10 K) and both disappear at 30 K. The signature of the both peaks seems to be present in E b but with a negligible intensity. Using E c (H a or H b) the peak at 60 cm-1 disappears, the peak at 30 cm-1 grows up with a band at 128 cm-1, both with the same intensities in the two configurations. No phonon is expected under 100 cm-1. These peaks can be thus attributed to magnon modes. However, the origin of the two magnon modes is not obvious and is discussed below.
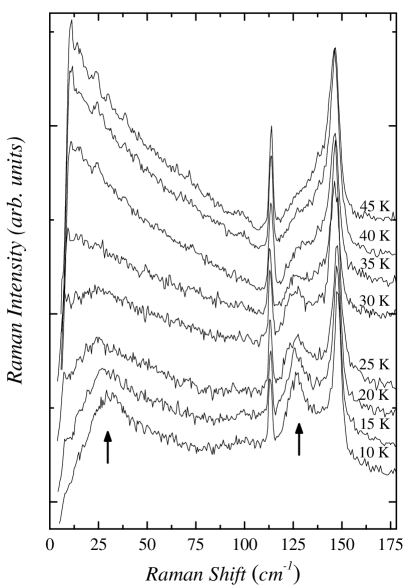
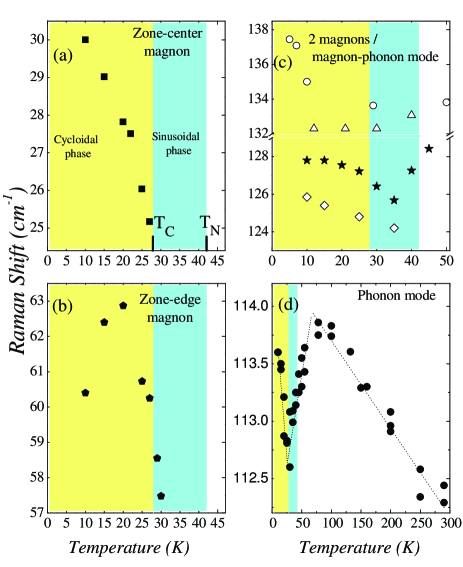
Figure 3 shows the temperature dependence of Raman spectra in the range 0-175 cm-1 from 10 to 45 K with E c. The magnon mode at 30 cm-1 clearly disappears upon is entering in the sinuso dal phase (T¿30 K) whereas the band at 128 cm-1 is still observed in the collinear sinusoidal phase before finally vanishing at the Néel temperature ( K). Figure 4(a) shows quantitatively that the frequency of the magnon mode at 30 cm-1 decreases down to the end of the cycloidal phase. The frequency of 60 cm-1 magnon (Fig. 4(b)) first increases from 10 K up to 20 K before decreasing until 30 K. These both magnetic excitations are only detected in the cycloidal phase whereas they should exist in the sinusoidal phase until the Néel temperature K as expected for ordinary magnetic excitations. Our data show that both excitations have not a pure magnetic activity and are intimetly related to the cycloidal phase below TC.
Let us focus on the origin of the observed magnetic peaks and on the Raman polarization selection rules.
The peak at 60 cm-1 is assigned to a zone-edge magnon with an energy close to the zone-edge energy Lee ; Valdes . Previously measured at the same energy and with the same polarization E a by far infrared transmission spectroscopy, this magnetic excitation has been identified as an electromagnon Pimenov ; Takahashi . Raman measurements show that this magnetic excitation exists only in the cycloidal phase underlying the polar caracter of the zone-edge magnon. Optical spectroscopies like Raman scattering probe dispersion branches close to the zero wave vector. The activation of 60 cm-1 zone-edge magnon can be explained by the alternation of the Heisenberg exchange interaction along axis Valdes or by the coupling of this mode with the spontaneous polarization through the dynamical magnetoelectric field Sousa .
The origin of the 30 cm-1 peak is more tricky. It might be assigned to zone-center magnon mode. A broad peak has been already reported by infrared between 20 cm-1 and 25 cm-1 and has been assigned to electromagnon Pimenov ; Takahashi ; Pimenov2 . Based on neutron measurements, the peak observed by infrared corresponds to a propagating mode of the spins out of the cycloidal plane Sneff . However, infrared measurements show only this peak with E a whereas this peak is enhanced with E c in Raman scattering. Raman scattering is induced by the electric field E of the light irrespective to the polarization direction of H. No significant Raman signal has been measured using light cross polarizations. This result is unexpected refering to the Fleury and Loudon approach showing that the one-magnon response exists for cross configuration Loudon . This unexpected selection rule might be interpreted as the electric-dipole activity of the magnon mode in TbMnO3. Raman scattering is very different from IR experiments whose electromagnon peaks arise directly from electric dipole activity of magnons. The selections rules (the polarization of the electric field of the light) involved in the Raman scattering process might be not directly connected to the polarization that activates the electromagnon. Recently, A. Cano shows that the magnetoelectric response giving rise to the electromagnon features in optical experiments not always can be reduced to an effective electric permittivity Cano . This might induce discrepancy between the selection rules of different experimental techniques. We can notice that the 30 cm-1 mode measured by Raman scattering has a higher frequency compare to the electromagnons measured by infrared spectrosopies (20-25 cm-1). These optical spectroscopies might be differently sensitive to the hybridization degree of electromagnons. The observation of this electromagnon at lower energy in infrared spectroscopy would suggest that infrared spectroscopy is more affected by the polar activity of the electromagnons than the Raman one. The Dzyaloshinskii-Moriya interaction has been proposed to explain the electromagnon at 30 cm-1 with a polar activity predicted for the electric field of light along the axis Katsura2 . A recent model based on cross-coupling between magnetostriction and spin-orbit interactions can explain the both peak at 30 cm-1 and 60 cm-1 Sousa . In this model the 30 cm-1 is not connected to zone-center magnon mode but corresponds to an excitation combining the zone-edge magnon wavevector and twice the cycloid wavevector.
In Fig. 3 the phonon modes at 113 cm-1 and 148 cm-1 correspond to Ag-symmetry modes associated to displacements of the Tb3+ ions Venugopalan ; Martin . The mode at 113 cm-1 is measured with Raman scattering in the two polarizations E a and E c whereas the mode at 148 cm-1 is only present in the polarization E c. The behaviour of the lowest phonon mode at 113 cm-1 is unusual (Fig. 4(d)) with a sharp frequency decreasing in the cycloidal phase followed by an increase up to 75 K before the usual frequency decrease at higher temperature due to the thermal expansion of the lattice.
The detection of phonon anomalies related to ferroelectricity is a quest to determine the microscopic mechanism involved and to explain how the spontaneous polarization appears Katsura . Barath et al. have observed the evolution of the phonon mode at 147 cm-1 under a magnetic field Barath . More recently, no phonon anomalies were found below 400 cm-1 by X-ray scattering suggesting a non conventional displacive ferroelectric transition in TbMnO3 Kajimoto . Here, we clearly observe an anomaly in a -polarized phonon frequency at 113 cm-1 across TC (Fig. 4(d)). The small frequency shift ( = 1 0.15 cm-1) of this mode shows that the coupling between the spontaneous polarization and the lattice is weak and confirms the magnetic origin of the ferroelectricity.
In Fig. 4(c), the frequency of the band at 128 cm-1 is shown with previously reported far infrared and Raman measurements. It decreases from 10 to 35 K and increases up to 45 K. The measurements performed by Schmidt et al. Schmidt and Barath et al. Barath present the same decrease up to 35 K. The data of Takahashi et al. show a small discrepancy Takahashi .
The origin of this band has been already discussed and interpreted as a magnon, a two-magnon scattering or a magnon-phonon process Takahashi ; Lee ; Schmidt . As already mentionned this band disappears at the Néel temperature which underlines its magnetic character. This band can not be associated with a one magnon procces because the zone-edge for magnetic excitations is around 60 cm-1.
First, the band at 128 cm-1 can be explained by the two-magnon scattering process i.e. twice the magnon energy at 60 cm-1 Takahashi . The zone-edge magnon at 60 cm-1 disappears at TC whereas the two-magnon scattering process associated with this mode is still measured in the cycloidal phase up to TN. This points out the mixed character of the zone-edge magnon in the two magnon scattering picture.
Second, we consider the one-magnon + one-phonon scenario Lockwood . In the range 10-45 K, the temperature dependence of the 128 cm-1 band (Fig. 4(c)) is similar to the one of the 113 cm-1 phonon mode (Fig. 4(d)). This indicates that the band at 128 cm-1 can arise from a magnon-phonon scattering process involving the magnon at 30 cm-1 and the 113 cm-1 phonon. In this scenario, our data show a strong coupling between the lowest optical phonon and the 30 cm-1 magnon mode. The two scenarios discussed here advocate in favour of the electric-dipole ac tivity of the Raman magnon modes observed at 30 and 60 cm-1.
In conclusion, our Raman observations reveal two magnetic excitations at 30 cm-1 and 60 cm-1 with light polarization E a. Surprisingly, our measurements show that the 30 cm-1 mode is enhanced with a light electric field along the spontaneous polarization ( axis). Both modes are only present in the cycloidal phase below TC. The mode at 60 cm-1 is interpreted as the zone-edge magnon-phonon hybridization with the phonon part describing the electric polarization parallel to . The Raman selection rules for 30 cm-1 excitation show its complex origin. Finally, we show the intimate relationship between the optical 113 cm-1 phonon mode and the mode at 128 cm-1.
The authors would like to thank R. de Sousa for helpful discussions and for a critical reading of the manuscript.
References
- (1) H. Béa, M. Gajek, M. Bibes and A. Barthelemy, J. Phys. Cond. Matt. 20, 434221 (2008).
- (2) H. Katsura, N. Nagaosa, and A. V. Balatsky, Phys. Rev. Lett. 95, 057205 (2005).
- (3) I. A. Sergienko, and E. Dagotto, Phys. Rev. B 73, 094434 (2006).
- (4) I. A. Sergienko, C. Sen, and E. Dagotto, Phys. Rev. Lett. 97, 227204 (2006).
- (5) V. G. Baryakhtar and I. E. Chupis, Sov. Phys. Solid State 11, 2628 (1970).
- (6) A. Pimenov et al., Nature Physics 2, 97 (2006).
- (7) A. B. Sushkov, R. Valds Aguilar, S. Park, S-W. Cheong, and H. D. Drew, Phys. Rev. Lett. 98, 027202 (2007).
- (8) Y. Takahashi et al., Phys. Rev. Lett. 101, 187201 (2008).
- (9) R. Valds Aguilar et al., Phys. Rev. Lett. 102, 047203 (2009).
- (10) J. S. Lee et al., Phys. Rev. B 79, 180403(R) (2009).
- (11) A. Pimenov et al., Phys. Rev. Lett. 102, 107203 (2009).
- (12) D. Senff et al., Phys. Rev. Lett. 98, 137206 (2007).
- (13) H. Katsura, A. V. Balatsky, and N. Nagaosa, Phys. Rev. Lett. 98, 027203 (2007).
- (14) A. B. Sushkov, M. Mostovoy, R. Valdes Aguilar, S-W. Cheong, and H. D.Drew, J. Phys. Condens. Matter 20, 434210 (2008).
- (15) M.P.V. Stenberg, and R. de Sousa, arXiv:0906.3059 (2009).
- (16) A. Cano, arXiv:0902.0495 (2009).
- (17) M. Cazayous et al., Phys. Rev. Lett. 101, 037601 (2008).
- (18) M. K. Singh, R. Katiyar, and J. F. Scott, J. Phys. Condens. Mat. 20, 252203 (2008).
- (19) J. F. Scott, M. K. Singh, and R. Katiyar, J. Phys. Condens. Mat. 20, 322203 (2008); J. F. Scott, M. K. Singh, and R. Katiyar, ibid. 20, 425223 (2008).
- (20) P. Rovillain et al., Phys. Rev. B 79, 180411(R) (2009).
- (21) P. A. Fleury and R. Loudon, Phys. Rev. 166, 514 (1968).
- (22) J. Blasco et al., Phys. Rev. B 62, 5609 (2000).
- (23) T. Kimura et al., Nature 426, 55 (2003).
- (24) T. Goto et al., Phys. Rev. Lett. 92, 257201 (2004).
- (25) L. Martin-Carron, A. de Andres, M. J. Martinez-lope, M. J. Casais, and J. A. Alonso, Phys. Rev. B 66, 174303 (2002).
- (26) S. Venugopalan, Mitra Dutta, A. K. Ramdas and J. P. Remeika, Phys. Rev. B 31, 1490 (1985).
- (27) H. Barath et al., Phys. Rev. B 78, 134407 (2008).
- (28) R. Kajimoto et al., Phys. Rev. Lett. 102, 247602 (2009).
- (29) Schmidt et al., Eur. Phys. J. B, e2009-00215-3 (2009).
- (30) D. J. Lockwood, G. Mischler, I. W. Johnstone, and M. C. Schmidt, J. Phys. C 12, 1955 (1979).