Near-infrared Polarimetry of flares from Sgr A* with Subaru/CIAO
Abstract
We have performed near-infrared monitoring observations of Sgr A*, the Galactic center radio source associated with a supermassive black hole, with the near-infrared camera CIAO and the 36-element adaptive optics system on the Subaru telescope. We observed three flares in the band (2.15m) during 220 minutes monitoring on 2008 May 28, and confirmed the flare emission is highly polarized, supporting the synchrotron radiation nature of the near-infrared emission. Clear variations in the degree and position angle of polarization were also detected: an increase of the degree of polarization of about 20 %, and a swing of the position angle of in the declining phase of the flares. The correlation between the flux and the degree of polarization can be well explained by the flare emission coming from hotspot(s) orbiting Sgr A*. Comparison with calculations in the literature gives a constraint to the inclination angle of the orbit of the hotspot around Sgr A*, as (close to edge-on).
1 Introduction
Sagittarius A* (Sgr A*), the compact source of radio, infrared, and X-ray emission at the center of our Galaxy, is associated with a supermassive black hole (SMBH; Eckart & Genzel, 1996; Ghez et al., 2000; Schödel et al., 2002) weighing in at (Ghez et al., 2008; Gillessen et al., 2009). Since the first identification of Sgr A* in the near-infrared (NIR) wavelengths (Genzel et al., 2003), NIR flares have been studied extensively. Such observations have found that Sgr A* is highly variable, and periodicity of minutes claimed in monitoring observations (e.g., Genzel et al., 2003; Eckart et al., 2006) would place the corresponding emission region at roughly three Schwarzschild radii for the black hole mass. If this picture is correct, the NIR flares from Sgr A* are powerful tools that allow us to investigate an accretion flow and the behavior of matter and radiation in the strong gravity regime very close to the SMBH.
Polarization in the NIR bands stands as one of the few observables of Sgr A* not extensively investigated due to its difficulties (Meyer et al., 2006b). Successful NIR polarimetry of Sgr A* needs (i) the occurrence of a fairly bright flare, (ii) quick measurements to trace the intrinsic rapid variation of polarization, and (iii) excellent and stable atmospheric conditions during the entire observations. Up to now, more than a dozen NIR flares have been observed photometrically, but only four have been observed in linear polarization (Eckart et al., 2006; Meyer et al., 2006a, b; Eckart et al., 2008), with all the observations carried out with the NAOS/CONICA at the Very Large Telescope (VLT). Also, the duration of the observations was generally not very long (about 100 minutes). Time-resolved polarized light curves carry specific information about the interplay between the gravitational and magnetic fields near the Sgr A* event horizon, because the propagation of the polarization vector is sensitive to the presence and properties of these fields along the light trajectories (Genzel & Karas, 2007).
In this letter, we present the first independent polarimetric measurements using the NIR camera CIAO and the adaptive optics (AO) system AO36 on the 8.2 m telescope Subaru111 Based on data collected at Subaru Telescope, which is operated by the National Astronomical Observatory of Japan. This is an almost non-stop polarimetric observation of Sgr A* over 220 minutes, and we have detected three main flares and shorter sub-flares superimposed on the underlying main flares. We will show that the profile is fairly well explained in the context of a hotspot orbiting the SMBH.
2 Observations and Data Analysis
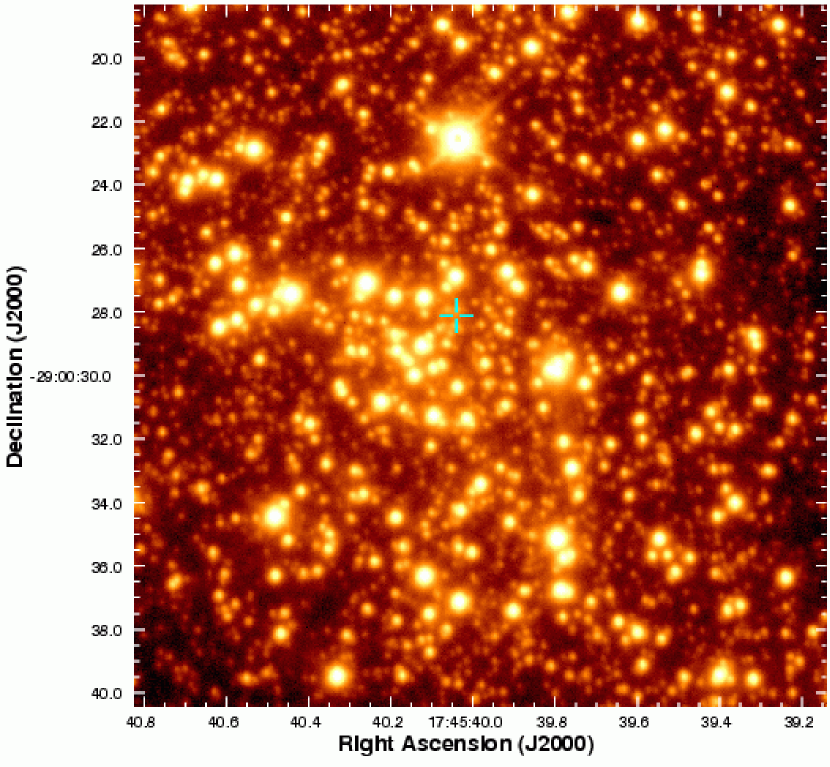
On 2008 May 28, we conducted band (m) polarimetric observations of Sgr A* using CIAO and its polarimeter (Tamura et al., 2003) and AO36 (Takami et al., 2004) on the Subaru telescope (Iye et al., 2004). CIAO provides an image of a area of sky with a scale of 21.7 mas pixel-1 (Fig. 1). With the mag natural guide star USNO 0600-28577051 located about from Sgr A*, and stable atmospheric condition during the observations, AO36 provided a stable correction with seeing values between 017 and 021 in the band. CIAO employs a rotatable half wave plate installed in front of the AO and a fixed wire grid polarizer in the cryostat to measure linear polarization. We made 20 sec exposures at four wave plate angles in the sequence of , , , and .222 In this sequence of observation, rapid variation of Sgr A* flux can bias polarization measurements, but we confirmed that such “instrumental polarization” is only a few % except when the flux changes rapidly at 150 minutes in the current observation (Fig. 3). Including time for readout and rotation of the wave plate, about 200 sec is required for one sequence of observation. We observed a dark cloud located at a few arcmin northwest from Sgr A* before and after the observations of Sgr A* to obtain sky measurements.
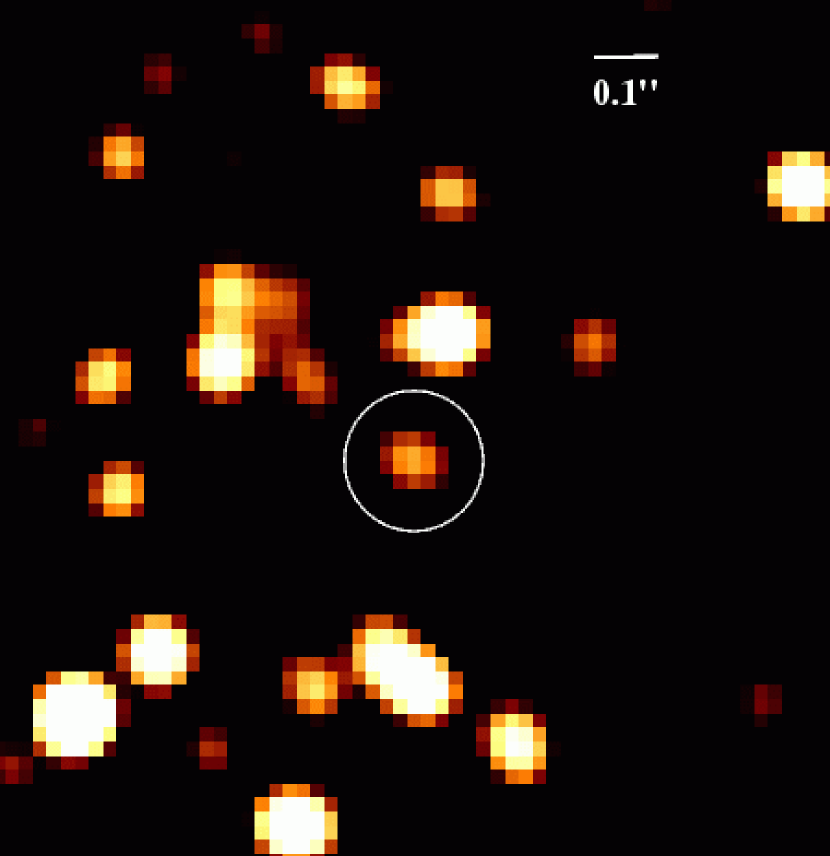
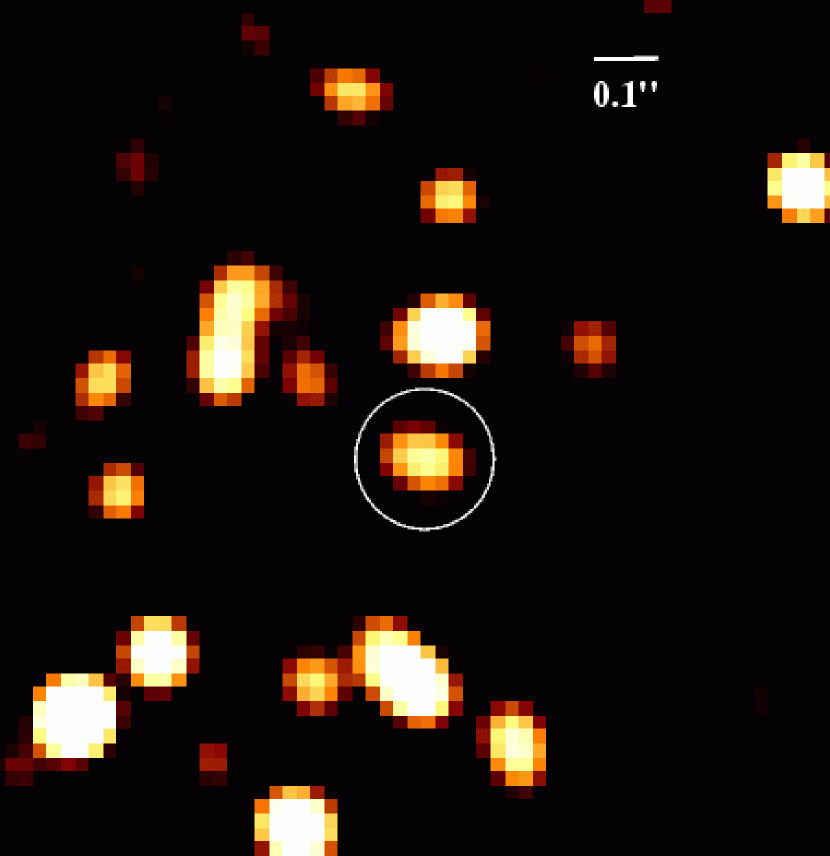
IRAF (Image Reduction and Analysis Facility)333 IRAF is distributed by the National Optical Astronomy Observatory, which is operated by the Association of Universities for Research in Astronomy, Inc., under cooperative agreement with the National Science Foundation. software package was used to perform dark- and flat-field corrections, sky background estimation and subtraction followed by bad pixel corrections. A point spread function was extracted via point-source fitting with the program StarFinder (Diolaiti et al., 2000) from each image. Each image was then deconvolved with the Lucy-Richardson algorithm (Lucy, 1974; Richardson, 1972), and beam restored with a Gaussian beam of FWHM corresponding to the respective wavelengths (66 mas at 2.15 m). The deconvolved images show clear flares at the position of Sgr A* (Fig. 2).
Flux densities of Sgr A* and other point sources were obtained via aperture photometry in Stokes images []. We used DAOFIND and APPHOT tasks for point sources identification and photometry. The flux density of each image was calibrated with 10 sources in the same field. For extinction correction, we assumed mag (Eisenhauer et al., 2005). The flux was corrected for a background flux density contribution , which was determined as the mean flux measured in the same aperture size at six different positions, which are free from contributions of individual stars. The photometric error at each flux of Sgr A* was estimated by fitting a power-law to the rms uncertainty in the flux for non-variable faint stars of similar flux densities. We found a typical dependence of the photometric error on flux as mJy.
The Stokes parameters , and for Sgr A* and other point sources were determined by aperture polarimetry as follows. DAOFIND and APPHOT tasks were used to obtain an intensity for each wave plate angle (, , , ) with an aperture radius of 5 pixel (011, see a circle in Fig. 2). Based on the intensities, we calculated the Stokes parameters as , , and . With these Stokes parameters, the degrees and position angles of polarization for stars in the same field were obtained. We confirmed that and for IRS 21, and and for mean polarization of field stars; these agree well with the results by Ott et al. (1999). We obtained a small mean RMS of the degrees of polarization as for the non-variable faint sources in the same field, suggesting a stable atmospheric condition and a reliable photometry.
To obtain intrinsic degree and position angle of polarization for Sgr A*, contributions of interstellar polarization and a faint nearby star S17 should be taken into account. Here we assume that S17 is an intrinsically unpolarized source. An observed Stokes parameter normalized by intensity, , is given by
| (1) |
where is a Stokes parameter for Sgr A*, and are Stokes parameters for Sgr A* and S17, respectively, and is a normalized Stokes parameter for the interstellar polarization. Hence, we can obtain an intrinsic, normalized Stokes parameter for Sgr A* as
| (2) |
(and ) can be calculated accurately with bright stars in the same fields, as and , in the assumption that they are located near the Galactic Center and are intrinsically unpolarized. We derived the last term in Eq. (2) as , where is the total flux density of Sgr A* and S17, is a background flux density contribution, and mJy (dereddened flux; an observed magnitude is 15.3 mag, see Gillessen et al., 2009). With the parameters and and equations
| (3) |
we can obtain the intrinsic degree and the position angle of polarization for Sgr A*. The position angle is measured from the north and increasing counterclockwise.
3 Results
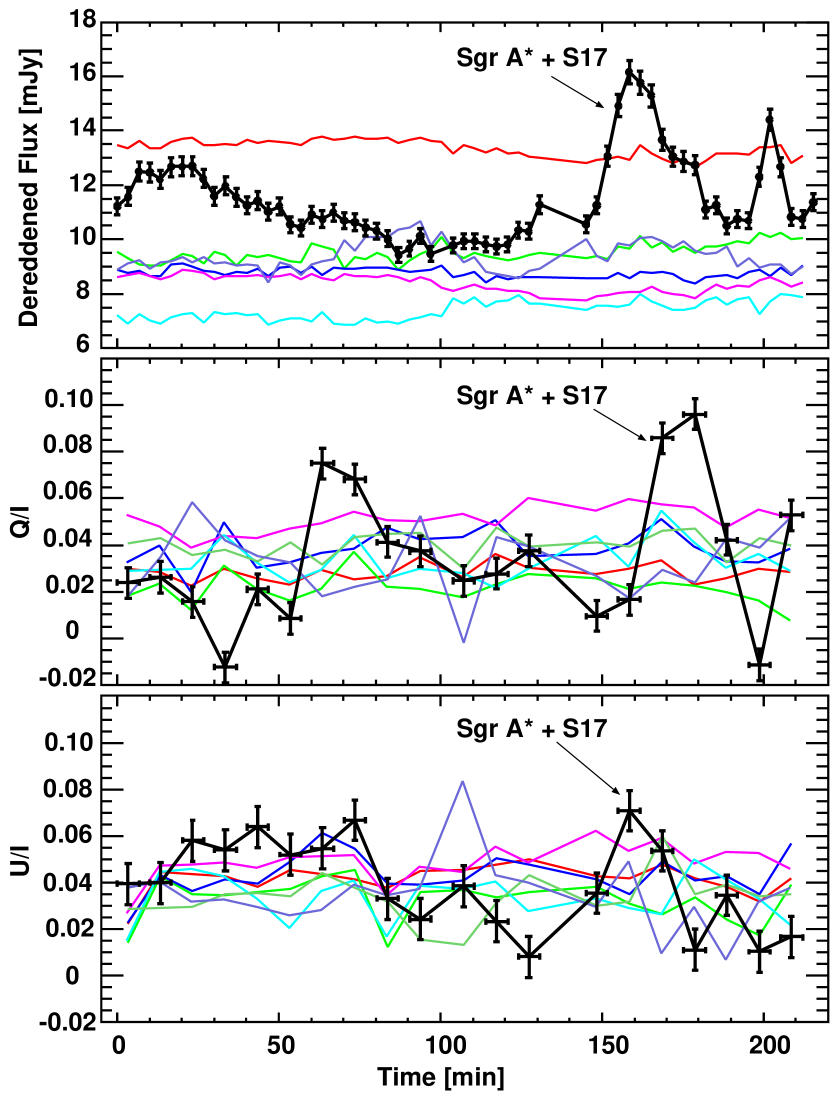
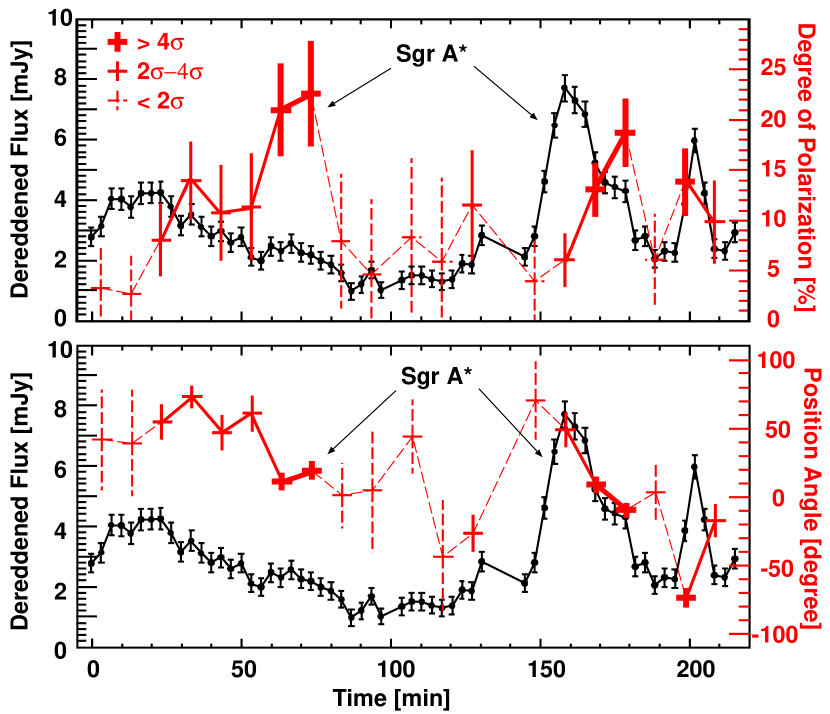
The dereddened flux of Sgr A* plus S17 show a clear variation (Fig. 3, top panel, black line). For reference, those for the non-variable faint sources in the same field are also shown in the same panel (colored lines). There are three major peaks: the broadest, and the weakest flare from to 90 minutes, the strongest flare from 145 to 190 minutes, in which a peak is followed by a bump, and the narrowest peak with the shortest rise/decay time from 195 to 210 minutes. The AO system did not work at - minutes; therefore, if there was a flare around 130 minutes, we missed that. In the first flare, substructures might exist around 60 minutes. The rise/decay timescale of minutes in the third flare is consistent with the light crossing timescales for the inner part of the accretion disk, less than 10 Schwarzschild radii, around a black hole.
The middle and bottom panels in Fig. 3 represent time evolutions of and , respectively, for Sgr A* plus S17 (black line) and the non-variable faint sources (colored lines). The colored lines show nearly constant values. The variation of for Sgr A* is much larger than those of the other sources. In the equatorial coordinates, the variation in of SgrA* is smaller than . The error bars of and for Sgr A* were determined from the mean RMS of and for the non-variable faint sources of similar flux densities.
We find clear variations in the intrinsic degree of polarization and the position angle of Sgr A* (Fig. 4). The polarization was often detected with not more than , and thus we will focus our discussion on the observations where was detected with more than (thin red lines in Fig. 4) and more than (thick red lines) levels. The first and second flares consist of a weakly or non- polarized main flare and a highly polarized sub-flare. The rises slowly up to % and probably decays sharply in the first flare. In the second flare, rises again up to %. Both rises occur after the bright flare phase, when flux of Sgr A* is decaying. These profiles are consistent with the previous observations (Meyer et al., 2006a; Trippe et al., 2007; Eckart et al., 2008). The variation in is complex: swings from to in the first flare. The behaviour of between the first and second flares is not clear due to large uncertainties, but swings from to in the second flare. Due to the short duration of only minutes, binning of the data points makes it impossible to trace the variation of and in the third flare.
4 Discussion
So far, the time evolutions of polarization of Sgr A* in the NIR bands have been obtained just for the four flares on 2004 June 12, 2005 July 29, 2006 May 31, and 2007 May 15 (Eckart et al., 2006; Meyer et al., 2006a, b; Trippe et al., 2007; Eckart et al., 2008; Zamaninasab, 2008). As pointed out by Trippe et al. (2007), the observed polarization parameters, in particular the position angle, in the first three flares show “remarkable permanence”, and the last 2007 flare has also similar parameters in spite of some differences (Eckart et al., 2008). In the typical flare in 2006, the degree of polarization rises up to 30% - 40%, and simultaneously, the position angle swings about in the decay phase of the broad underlying flare (Meyer et al., 2006a; Trippe et al., 2007).
The first flare we observed shows similar properties to those detected in the previous observations. It shows a rise in and a swing in at minutes, where the long flare (duration of more than 90 minutes) is slowly fading away. The observed during the flare peak is , which agrees well with of the flare measured by Eckart et al. (2006), and by Meyer et al. (2006a).
Such flares can be explained with a hotspot model. Eckart et al. (2006) made fitting for the flares in 2004 and 2005 with a two-component (hotspot plus disk) model. For the flares in 2005 and 2006, Meyer et al. (2006a, b) adopted a hotspot plus ring model, which leads to reasonable fits of polarimetric light curves. In their models, the broad overall flare is caused by a time varying underlying disk or ring, and the shorter sub-flares are due to a hotspot on a relativistic orbit around the SMBH. Eckart et al. (2008) proposed a temporary disk with a short jet model, in which quasi-periodic variation is due to a hotspot on the disk.
The second flare from 145 to 190 minutes seems to be different from other polarized flares. The flare survives only for 30 minutes, and is not superimposed on a broader underlying flare. However, similarly to the previous flares, the second flare shows sub-structures; the highest peak is followed by a lower peak or a bump structure. The two peaks are separate in time by about 15 minutes, which is very similar to a quasi-periodicity of minutes obtained by Meyer et al. (2006b), so these sub-structures can be explained by periodic orbital motions of a single hotspot. If we consider the time evolution of degree of polarization, however, we can find similarities between our results and the expected light curves for a single orbital motion of a hotspot (Broderick & Loeb, 2006).
Many authors calculated light curves from an emitting bright spot on the surface of an accretion disk and comoving with the disk (e.g., Pineault, 1981; Asaoka, 1989; Bao, 1992; Fukue, 2003). Recently, Broderick & Loeb (2006) calculated light curves in infrared wavelengths, including polarization, associated with a hotspot orbiting the SMBH in the Galactic center. The primary feature of the light curves with a large orbital inclination angle (close to the edge-on view) is a narrow and higher peak followed by a broad lower peak/bump. The first peak is formed by a gravitational lensing effect which is strongest when the hotspot is right behind the black hole. Doppler effect and beaming due to the relativistic motion of the hotspot in the approaching regime make the second peak/bump. The time evolutions of polarized flux show a double-peak profile with a higher second peak than the first one, or a slow-rise and sharp-decay profile (with a lower time resolution). The variation of the position angle is mainly influenced by the inclination angle .
The similarities between the second flare and the calculations by Broderick & Loeb (2006) suggest that the second flare could be explained with a single orbital motion of a hotspot. In the light curve of the second flare from 145 to 190 minutes, we can see the “first peak and second peak/bump” profile. In the time evolution of degree of polarization, it is clearly seen that increases in the decay phase of the flare. The profiles of are asymmetric, showing slow rise and sharp decay. If the observed time evolution of polarization comes from such a hotspot, comparison with calculations allows us to investigate the inclination angle of the hotspot orbits around Sgr A*, because the time evolution profile of the flux and the degree of polarization strongly depend on the inclination angle. Broderick & Loeb (2006) showed that when , light curves show a bump after the first peak. In addition, the time evolution of polarization has a double-peak or slow-rise and sharp-decay profile. These are very similar to the second flare in our observations. When , by contrast, the light curve has a smooth decay phase and the polarization shows a symmetric or slow-decay profile. These comparisons could exclude a small inclination angle (near face-on) of . This is consistent with recent results, by Meyer et al. (2006a), by Meyer et al. (2006b), by Meyer et al. (2007), and with which Eckart et al. (2008) found a minimum reduced- value in the modeling of the observed time evolution of flux and polarization.
Although the hotspot model is a favorite model with our results, it is premature to use such a simple model to draw strong conclusions. For example, Trippe et al. (2007) proposed that the swing of the position angle in NIR polarization is caused by either a magnetic field geometry changes due to a vanishing of the accretion disk, or materials move out of the accretion disk, perhaps into a jet. A model of the expansion of hot self-absorbed synchrotron plasma blob was also proposed from multi-wavelengths observations (e.g., Yusef-Zadeh et al., 2006, 2008; Marrone et al., 2008). This model explains the time delay between different wavelengths in flare emissions, while the hotspot model does not. Meyer et al. (2008) and Do et al. (2009) reported non-detection of a statistically significant periodicity in NIR light curves. Based on the model to a two-temperature magnetorotational instability driven accretion flow by Liu et al. (2007), Huang et al. (2008) showed the spectrum and frequency-dependent polarization for Sgr A* with general relativistic effects, and explain the flip of the position angle between submillimeter and NIR observations.
Although time-resolved light curves have been presented by many authors (e.g., Goldston et al., 2005; Falanga et al., 2007), no “time-resolved, polarized” light curves have been available for the models other than those by Broderick & Loeb (2006). Polarization provides new information which is extremely useful to break degeneracy of various model parameters. Our observations demonstrated that it is now possible to monitor the polarimetric variation of Sgr A* continuously up to hr by combining contiguous Subaru and VLT observations, as done for the NIR flux density using VLT and Keck observations (Meyer et al., 2008). Simulations including polarization evolution to test the various models for Sgr A* are now strongly encouraged.
References
- Asaoka (1989) Asaoka, I., 1989, PASJ, 41, 763
- Bao (1992) Bao, G., 1992, A&A, 257, 594
- Broderick & Loeb (2006) Broderick, A. E., & Loeb, A. 2006, MNRAS, 367, 905
- Diolaiti et al. (2000) Diolaiti, E., et al. 2000, A&AS, 147, 335
- Do et al. (2009) Do, T., Ghez, A. M., Morris, M. R., Yelda, S., Meyer, L., Lu, J. R., Hornstein, S. D., & Matthews, K. 2009, ApJ, 691, 1021
- Eckart & Genzel (1996) Eckart, A., & Genzel, R. 1996, Nature, 383, 415
- Eckart et al. (2006) Eckart, A., Schödel, R., Meyer, L., Trippe, S., Ott, T., & Genzel, R. 2006, A&A, 455, 1
- Eckart et al. (2008) Eckart, A., et al. 2008, A&A, 479, 625
- Eisenhauer et al. (2005) Eisenhauer, F., et al. 2005, ApJ, 628, 246
- Falanga et al. (2007) Falanga, M., Melia, F., Tagger, M., Goldwurm, A., & Bélanger, G. 2007, ApJ, 662, L15
- Fukue (2003) Fukue, J. 2003, PASJ, 55, 1121
- Genzel et al. (2003) Genzel, R., Schödel, R., Ott, T., Eckart, A., Alexander, T., Lacombe, F., Rouan, D., & Aschenbach, B. 2003, Nature, 425, 934
- Genzel & Karas (2007) Genzel, R., & Karas, V. 2007, in Proc. IAU Symp. 238, Black Holes from Stars to Galaxies, 173
- Ghez et al. (2000) Ghez, A. M., Morris, M., Becklin, E. E., Tanner, A., & Kremenek, T. 2000, Nature, 407, 349
- Ghez et al. (2008) Ghez, A. M., et al. 2008, ApJ, 689, 1044
- Gillessen et al. (2009) Gillessen, S., Eisenhauer, F., Trippe, S., Alexander, T., Genzel, R., Martins, F., & Ott, T. 2009, ApJ, 692, 1075
- Goldston et al. (2005) Goldston, J. E., Quataert, E., & Igumenshchev, I. V. 2005, ApJ, 621, 785
- Huang et al. (2008) Huang, L., Liu, S., Shen, Z.-Q., Cai, M. J., Li, H., & Fryer, C. L. 2008 ApJ, 676, L119
- Iye et al. (2004) Iye, M., et al. 2004, PASJ, 56, 381
- Liu et al. (2007) Liu, S., Qian, L., Wu, X.-B., Fryer, C. L., & Li, H. 2007, ApJ, 668, L127
- Lucy (1974) Lucy, L. B. 1974, AJ, 79, 745
- Marrone et al. (2008) Marrone, D. P., et al. 2008, ApJ, 682, 373
- Meyer et al. (2006a) Meyer, L., Schödel, R., Eckart, A., Karas, V., Dovčiak, M., Duschl, W. J. 2006a, A&A, 458, L25
- Meyer et al. (2006b) Meyer, L., Eckart, A., Schödel, R., Duschl, W. J., Mužić, K., Dovčiak, M., Karas, V. 2006b, A&A, 460, 15
- Meyer et al. (2007) Meyer, L., Schödel, R., Eckart, A., Duschl, W. J., Karas, V., Dovčiak, M. 2007, A&A, 473, 707
- Meyer et al. (2008) Meyer, L., Do, T., Ghez, A., Morris, M. R.,Witzel, G., Eckart, A., Belanger, G., & Schödel, R. 2008, ApJ, 688, L17
- Ott et al. (1999) Ott, T., Eckart, A., & Genzel, R. 1999, ApJ, 523, 248
- Pineault (1981) Pineault, S., 1981, ApJ, 246, 612
- Richardson (1972) Richardson, W. H. 1972, J. Opt. Soc. Am., 62, 55
- Schödel et al. (2002) Schödel, R., et al. 2002, Nature, 419, 694
- Takami et al. (2004) Takami, H., et al. 2004, PASJ, 56, 225
- Tamura et al. (2003) Tamura, M., Fukagawa, M., Murakawa, K., Suto, H., Itoh, Y., & Doi, Y. 2003, SPIE, 4843, 190
- Trippe et al. (2007) Trippe, S., Paumard, T., Ott, T., Gillessen, S., Eisenhauer, F., Martins, F., & Genzel, R. 2007, MNRAS, 375, 764
- Yusef-Zadeh et al. (2006) Yusef-Zadeh, F., et al. 2006, ApJ, 644, 198
- Yusef-Zadeh et al. (2008) Yusef-Zadeh, F., Wardle, M., Heinke, C., Dowell, C. D., Roberts, D., Baganoff, F. K., & Cotton, W. 2008, ApJ, 682, 361
- Zamaninasab (2008) Zamaninasab, M. et al. 2008, J. Phys. Conf. Ser. 131