Quantifying the Coexistence of Massive Black Holes and Dense Nuclear Star Clusters
Abstract
In large spheroidal stellar systems, such as elliptical galaxies, one invariably finds a - supermassive black hole at their centre. In contrast, within dwarf elliptical galaxies one predominantly observes a - nuclear star cluster. To date, few galaxies have been found with both type of nuclei coexisting and even less have had the masses determined for both central components. Here we identify one dozen galaxies housing nuclear star clusters and supermassive black holes whose masses have been measured. This doubles the known number of such hermaphrodite nuclei — which are expected to be fruitful sources of gravitational radiation. Over the host spheroid (stellar) mass range –, we find that a galaxy’s nucleus-to-spheroid (baryon) mass ratio is not a constant value but decreases from a few percent to 0.3 percent such that . Once dry merging has commenced by and the nuclear star clusters have disappeared, this ratio is expected to become a constant value.
As a byproduct of our investigation, we have found that the projected flux from resolved nuclear star clusters can be well approximated with Sérsic functions having a range of indices from 0.5 to 3, the latter index describing the Milky Way’s nuclear star cluster.
keywords:
black hole physics — galaxies: nuclei — galaxies: structure1 Introduction
Ferrarese et al. (2006a) and Wehner & Harris (2006) have recently shown that the division between either a (black hole)- or a (nuclear cluster)-dominated galaxy core occurs around a galaxy mass of 10. Wehner & Harris (2006) wrote that “dE,N nuclei themselves [the nuclear star clusters] show no evidence of harbouring massive black holes”. Indeed, in the contemporaneous investigation by Ferrarese et al. (2006a), they identified only two galaxies (M32 and the Milky Way) as potentially hosting both types of nuclear component. While apparently rare, Filipenko & Ho (2003) had identified at least one galaxy with both a nuclear cluster (NC) and a massive black hole (BH) and Graham & Driver (2007) subsequently reported on the existence of two additional such galaxies (NGC 3384 and NGC 7457).
To investigate this near dichotomy in the type of central massive object which galaxies house, Seth et al. (2008) searched for evidence of active galactic nuclei (AGN), and thus massive BHs, in galaxies with known NCs. Gonzalez Delgado et al. (2008) simultaneously undertook a complementary approach and searched for the presence of NCs in galaxies with known AGN. While they both detected some galaxies in the mass range to which contain both a NC and an AGN, they were not able to acquire the BH masses of the AGN.
To explore not only how commonplace these systems are, but importantly the nature of the above mentioned transition, we have searched for NCs in galaxies whose BH mass has already been determined via direct dynamical measurements. This is important because the nucleus-to-(host spheroid) mass ratio, as a function of spheroid mass, may provide useful constraints for potential galactic evolutionary assembly processes. For example, some massive BHs may grow through the runaway collision of NC stars (e.g., Lightman & Shapiro 1978; Kochanek et al. 1987; Lee 1993), or conversely the BH may evaporate the surrounding NC (e.g., Ebisuzaki et al. 2001; O’Leary et al. 2006), or perhaps some other mechanism dominates. Curiously, the continuous relations shown by Wehner & Harris (2006) and Ferrarese et al. (2006a) involving either the BH or NC mass and the host galaxy mass are suggestive of, at some level, mutually common physics governing the two types of nuclei. Moreover, given that the main mechanism of galaxy growth is thought to be through the process of hierarchical merging, modelling their dual nuclei may be important for properly understanding the growth of supermassive black holes. For example, dense nuclear star clusters may, through N-body interactions, greatly facilitate the coalesence rate of binary massive black holes.
The coexistence of NCs and massive BHs is of further interest due to associated physical phenomenon. The inward spiral of stars onto a massive BH is a likely source of UV/X-ray flaring events (Komossa & Bade 1999; Komossa & Merritt 2008; Lodato et al. 2008; Rosswog et al. 2008). The disruption of binary stars may result in the high-speed ejection of hypervelocity stars (Bromley et al. 2006). Rapid inspiral events may also generate gravitational radiation (e.g., Quinlan 1996; Alexander 2008; O’Leary et al. 2008; Merritt 2008). As such, galactic nuclei with confirmed BHs and NCs may prove useful targets for experiments such as the Laser Interferometer Space Antenna (LISA, Danzmann et al. 1996) which are hoping to discover such as yet undetected radiation. Given that the amplitude of gravitational waves decays linearly with distance, and X-ray flaring events with distance squared, the relative proximity of the galaxies listed here makes them particularly attractive compared to more distant, nucleated AGN.
In the following section we briefly describe our galaxy data set, with more detailed information contained within the Appendix. In Section 3 we present a tentative new scaling law involving dense star clusters and massive black holes, plus a more robust scaling relation which involves the mass of the host spheroid. Finally a discussion, including some of the implications of this work, and a brief summary are provided in Sections 4 and 5 respectively.
2 Data
Graham (2008a) tabulated a sample of 50 (+26) predominantly inactive galaxies with useful (rough) measurements of their central BH mass. This compilation was acquired by scouring the literature for published values which were then updated if new distances were available. Of these 76 galaxies, Table 1 lists those which additionally contain a NC. Included in this list is our own galaxy the Milky Way (Burbidge 1970; Rubin 1974), M32 (Tonry 1984), the active galaxies NGC 3621 and NGC 4395 (Barth et al. 2008; Filippenko & Ho 2003), plus NGC 3384 and NGC 7457 which were previously noted to contain both types of nuclei. An additional seven predominantly inactive galaxies (NGC 1023, 1399, 2778, 3115, 4026111Taken from Gültekin et al. (2009)., 4564. 4697) which house both type of nuclear component have been identified — although no NC mass is currently available for NGC 4564. In addition, Table 1 includes another four galaxies with known NC masses but only upper limits on their BH masses (as is the case for NGC 3621 mentioned above), three globular clusters with possible BHs, twelve core galaxies with no NC (included for reference) and one young star cluster (MGG-11) with a probable intermediate mass black hole. The massive globular clusters included here are of interest for scenarioes in which they may be the relic nuclei of stripped galaxies (e.g. Freeman 1993; Bassino et al. 1994; Meylan et al. 2001; Bekki et al. 2003; Walcher et al. 2005).
The Appendix contains references to, or derivations of, all quantities shown in Table 1. Briefly, the black hole masses have been taken from the individual (usually discovery) papers which reported these values, and, when necessary, adjusted to our updated distances which are also provided in the Appendix. While galaxy masses were used for the elliptical galaxies, bulge masses have been used for the disc galaxies. From here on we shall generically refer to an elliptical galaxy or the bulge of a disc galaxy as a “spheroid”. The spheroid masses were primarily obtained by multiplying the observed spheroid luminosity by an appropriate stellar mass-to-light () ratio. The NC masses were also obtained this way, albeit using a different stellar mass-to-light ratio from the spheroid’s value. We found that the uncertainty involved in this process is generally constrained to within a factor of two. While comparison with dynamically-determined masses, when available, supports this level of accuracy, detailed spectroscopy that establishes the mean ages and metallicities of the stars (e.g. Walcher et al. 2005) is desirable for better constraining ratios. Such details, however, were not available for most systems and therefore we usually adopted the single colour approach used by Ferrarese et al. (2006a) and Seth et al. (2008) to determine the nuclear cluster masses. For five galaxies (M32, NGC 205, NGC 2778, NGC 4697 and the Milky Way) we have modelled, in the Appendix, their observed light distribution to derive their NC fluxes.
| Object | Type | |||
|---|---|---|---|---|
| Twelve “core galaxies” with but no detectable NC | ||||
| NGC 3379 | E | … | ||
| NGC 3608 | E | … | ||
| NGC 4261 | E | … | ||
| NGC 4291 | E | … | ||
| NGC 4374 | E | … | ||
| NGC 4473 | E | … | ||
| NGC 4486 | E | … | ||
| NGC 4649 | E | … | ||
| NGC 5077 | E | … | ||
| NGC 5813 | E | … | ||
| NGC 6251 | E | … | ||
| NGC 7052 | E | … | ||
| Twelve galaxies with and a NC | ||||
| Milky Way | SBbc | |||
| M32 | cE | |||
| NGC 1023 | SB0 | |||
| NGC 1399a | E | |||
| NGC 2778b | SB0 | |||
| NGC 3115 | S0 | |||
| NGC 3384 | SB0 | |||
| NGC 4026 | S0 | |||
| NGC 4395c | Sm | |||
| NGC 4564 | S0 | ? | ||
| NGC 4697 | E | |||
| NGC 7457d | S0 | |||
| Galaxies with a NC but only an upper limit on | ||||
| M33 | Scd | |||
| NGC 205 | E | |||
| NGC 3621 | Sd | |||
| NGC 4041e | Sbc | |||
| VCC 1254 | dE | |||
| Star clusters with less secure | ||||
| G1f | GC | … | ||
| M15f | GC | … | ||
| MGG-11c | SC | … | ||
| Cenf | GC | … | ||
References are available in the extended version of this Table, provided in the Appendix. Uncertainties on the spheroid stellar masses and the nuclear cluster masses are roughly a factor of two. The three globular clusters and one young star cluster (MGG-11) have no associated spheroid mass as they are not located at the centre of a spheroid. Notes: a NC detection weak; b NC & BH detection weak; c indirect BH mass estimate; d BH detection weak; e disc might be dynamically decoupled; f maybe no BH.
Although roughly one dozen galaxies (including NGC 3621 and excluding NGC 4026) from the sample of 76 galaxies in Graham (2008a) appear to have both a NC and a BH, it would be inappropriate to conclude that roughly 16 per cent of galaxies contain both. This is because sample selection effects have not been considered. For example, high mass galaxies tend not to have nuclear star clusters; a sample dominated by such galaxies would be biased toward low percentages. In passing we note that because the central stellar density in high mass, bright elliptical galaxies decreases as a function of increasing galaxy luminosity (e.g., Faber et al. 1997), nuclear star clusters are actually easier to detect in luminous galaxies than in intermediate luminosity elliptical galaxies. At the other end of the scale, the sphere-of-influence of a BH within a lower-mass spheroid having a velocity dispersion of 100 km s-1 is only 0.01 arcseconds at the distance of the Virgo galaxy cluster; such BHs would therefore go undetected. Gallo et al. (2008) have however reported that 3-44 per cent of early-type galaxies less massive than have an X-ray active BH, while 49-87 per cent of more massive early-type galaxies do. This may in part be a reflection that massive BHs are less prevalent in lower mass galaxies. In any event, our galaxy identification in Table 1 confirms that the coexistence of NCs and BHs is not as rare as previously thought. Table 1 effectively doubles the number of galaxies reported to contain a dense nuclear star cluster and having a direct supermassive black hole mass measurement.
Shown in Table 1 is the morphological type of each object. Not surprisingly, the first dozen galaxies with a BH but no signs of a NC are big elliptical galaxies. The next dozen objects, those with evidence for both a BH and a NC, are predominantly disc galaxies; the exceptions are the elliptical galaxy NGC 4697, the “compact elliptical” galaxy M32 (which may be a disc galaxy undergoing transformation, e.g. Bekki et al. 2001; Graham 2002) and the elliptical galaxy NGC 1399 with only tentative evidence for a NC (possibly a swallowed GC, Lyubenova et al. 2008, which is one of the propsed mechanisms for building NCs). However, given that almost every galaxy with a reliable BH mass measurement that is less than is a disc galaxy, their prevalence is not surprising. Finally, lacking kinematical information on the level of rotational versus pressure support in the bulges of our sample, we are unable to comment on the role that pseudobulges versus classical bulges may play.
In the following section we attempt to probe the nature of the transition from one type of nuclei to the other.
3 Mass ratios
3.1 From star clusters to massive black holes
Figure 1 shows the ratio of the BH mass to the combined BH plus NC mass. It is plotted against the stellar mass of the host spheroid: either an elliptical galaxy, the bulge of a disc galaxy, or nothing in the case of the three globular clusters and one young star cluster (see Table 1). For spheroids with stellar masses below there is a dearth of reliable BH detections, although the majority of low-mass spheroids are known to contain NCs (e.g., Binggeli et al. 1987; Ferguson 1989; Carollo et al. 1998; Stiavelli et al. 2001; Balcells et al. 2003; Graham & Guzmán 2003; Côté et al. 2006). From Local Group dwarf galaxies, such as NGC 205, we know that any potential BHs which these low mass galaxies might host are less massive than their NCs. This is reflected by the upper limits on five of the data points in Figure 1. The situation is reversed for spheroid masses greater than , where the BHs dominate at the expense of the NCs. Figure 1 reveals that in between is mutual ground where both BHs and NCs appear to coexist within the same spheroid. For the first time we are able to gain some preliminary insight into the nature of this transition as a function of mass, although we recognise that more data is needed in Figure 1 before any possible relation can be defined with certainty.
The demise of NCs at a host spheroid mass of (Figure 1, see also Ferrarese et al. 2006a and Wehner & Harris 2006) is interesting. The onset of partially depleted galaxy cores occurs at an absolute -band magnitude of mag (e.g., Faber et al. 1997; Graham & Guzmán 2003), which is also where the dynamical properties vary (e.g., Davies et al. 1983; Dressler & Sandage 1983; Matković & Guzmán 2005). For an old stellar population, this stellar flux corresponds to a stellar mass of — which has recently been noted by many studies as marking the transition of several galaxy properties (e.g. Rogers et al. 2008) and may also coincide with the turnover of the galaxy mass function (Li & White 2009). As noted by Ferrarese et al. (2006a), it may therefore be that coalescing BHs in dry merger events (Begelman, Blandford, & Rees 1980; Merritt, Mikkola & Szell 2007; Berentzen et al. 2009) preferentially destroy their shroud of NC stars prior to the creation of the galactic loss cones observed in spheroids brighter than -mag. Alternatively, perhaps the life span of a NC is simply short once the mass of the BH dominates, hence the scarcity of NCs around BHs with .
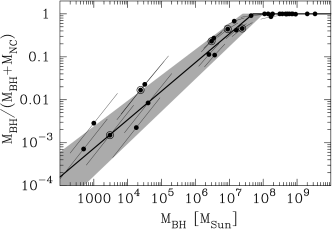
Figure 2 shows the same mass ratio as seen in Figure 1, but plotted against the BH mass. Plotting it like this reveals, without recourse to the host spheroid, the nature of the coexistence of black holes and dense star clusters. The line shown in Figure 2 has simply been marked by eye to roughly capture the behaviour of the points and is such that
| (1) |
for and equals zero for larger BH masses and when . Given the somewhat sparse nature of the data, a more sophisticated regression analysis for this new (black hole)-(nuclear cluster) mass ratio relation is not performed here.
3.2 Nuclei-to-spheroid mass ratios
It is generally accepted that massive BHs are associated with the host spheroid rather than the host galaxy (e.g., Kormendy & Gebhardt 2001). Given this, we have displayed in Figure 3 the combined mass of the BH and the NC, divided by the stellar mass of the host spheroid. For high spheroid masses, where supermassive BHs dominate the core region, one can see that this ratio scatters between values from to . One can also see that this mass ratio is greater in the lower mass spheroids whose cores are dominated by a NC222If a population of yet-to-be-detected, low-mass spheroids with exists, they would act to increase the distribution of points at the low-mass end of Figure 3 to higher values and thereby steepen the relation further.. From an orthogonal regression analysis, using the code BCES (Akritas & Bershady 1996), and assuming a factor of two uncertainty on each data point in both directions, one obtains the relation333Excluding NGC 205 from Figure 3 gives a consistent slope and intercept of and , respectively.
| (2) |
Repeating the analysis while assigning a factor of 5 uncertainty to the ordinate (and a factor of 2 in the abscissa) does not change this result by more than the quoted 1 uncertainties. Setting for the systems which only have upper limits on their BH masses also does not significantly alter these results. The Pearson and Spearman correlation coefficients are -0.73 and -0.65, and the probability of such a strong correlation occurring by chance is less than 0.02 per cent. The vertical scatter (i.e. in the direction) is 0.41 dex, and 0.36 dex without NGC 205.
While equation 1 expressed the relevant dominance of the BH compared to the NC as a function of BH mass, equation 2 reveals their combined importance (in terms of mass) relative to the host spheroid’s stellar mass. It also effectively provides a new means to predict the central mass in systems where one is unable to directly measure this quantity.
Once dry merging commences at mag (e.g. Graham & Guzmán 2003, and references therein), or roughly mag (or to ), the mass ratio should remain constant (or decrease if BHs can be ejected, e.g., Merritt et al. 2004; Gualandris & Merritt 2008). The one-to-one - relation given by Graham (2007, which is dominated by systems with ), coupled with a near constant stellar ratio for massive elliptical galaxies, supports the scenario in which the / baryon444This terminology assumes that the black holes have been built by baryons (e.g. Shankar et a. 2004). mass ratio is a roughly constant value. Using the -band stellar mass-to-light ratio , for (Forbes et al. 2008, their Figure 10), and the colour-magnitude relation , for mag (Forbes et al. 2008, their Equation 1), one has the expression . Applying this to the -band expression from Graham (2007, his section 5.2) gives . For comparison, Marcomi & Hunt (2003) report for their “Group 1” galaxies, while Häring & Rix (2004) report for a slightly larger galaxy sample. It should however be noted that these latter two studies have, at some level, also accounted for the contribution from dark matter in the spheroid mass, an isue we discuss in the following Section.
4 Discussion
Only a few years ago it was generally believed that massive black holes and nuclear star clusters did not (frequently) coexist at the centres of galaxies. Here, as in Seth et al. (2008) and Delgado et al. (2008), we present evidence suggesting the contrary for galactic spheroids with stellar masses ranging from –. Furthermore, we take an important step forward by reporting on systems for which we have been able to acquire the (black hole and stellar) masses of the nuclear components and the (stellar) mass of the host spheroid. This has enabled us to present mass relations defining this exciting coexistence.
From Equation 2, when one has a nucleus-to-spheroid mass ratio of 0.04, and when one has a ratio of 0.0027. Perhaps not surprisingly, the latter value is in excellent agreement with the mean ratio from studies of galaxies at the high-mass end with , and which excluded any NC mass component (e.g. Merritt & Ferrarese 2001; Häring & Rix 2004). At the low-mass end, from an analysis of nuclear star clusters in dwarf elliptical galaxies and the bulges of early-type disc galaxies, the stellar mass ratio has been observed to be both higher and to increase (decrease) as one samples lower (higher) mass spheroids. Balcells et al. (2003) find a value of 2 per cent when and from a sample of dwarf elliptical galaxies a value of 1 per cent when is readily derived from Graham & Guzmán (2003, their Eq.3 assuming an F606W filter mass-to-light ratio of 3).
As noted above, in low-mass spheroids it has been known for some years how the stellar flux ratio of the nucleus and host spheroid vary (see also Lotz et al. 2004, their Figure 7). Grant et al. (2005), for example, report that their -band data for dwarf elliptical galaxies yields , which implies a nine-fold variation in the nuclear-to-spheroid flux ratio over a host spheroid flux range of 1000. (For comparison, given that at the low mass end of equation 2, one has the (stellar mass) relation when the NCs dominate. From Shen et al.’s (2008) analysis of 900 broad line AGN, they report that .) In Figure 3 we have revealed, over a host spheroid stellar mass range of , how the combined central object mass (black hole plus nuclear star cluster) divided by the stellar mass of the host spheroid varies with the latter quantity. This ratio increases by more than an order of magnitude from 0.1 per cent in giant elliptical galaxies dominated by massive black holes, to 5–9 percent in dwarf galaxies and the bulges of late-type disc galaxies whose inner regions are dominated by a nuclear star cluster (see also Balcells et al. 2007).
At first glance, this result may appear to contradict recent claims of a constant (central massive object)-to-(host galaxy) mass ratio, where the central massive object in such works was either a nuclear star cluster or a massive black hole. In the case of Wehner & Harris (2006), they effectively took the above flux relation for dwarf elliptical galaxies from Grant et al. and used the expression ( to obtain . If the nuclear clusters have similar stellar ratios, this leads to the result that the nuclear cluster mass is linearly proportional to the total (dark matter plus stellar) mass of the host spheroid; i.e. that this mass ratio is constant with varying spheroid mass. The mass ratios presented by Ferrarese et al. (2006a), while also accounting for dark matter at some level, are slightly different due to their inclusion/treatment of disc galaxies from a sample of early-type, Virgo cluster galaxies. Although their application of the virial theorem () using the velocity dispersion of the (pressure supported) bulge component together with the effective half-light radii of the whole galaxy — which are effected by the size of the (rotationally supported) disc component — is a questionable meausure of a lenticular galaxy’s mass, it is clear that these virial products are larger than the spheroid masses that would be obtained from the use of in such a formula.555A more subtle issue is that the nuclear cluster fluxes (and thus masses) may have been underestimated due to the steeper inner Sérsic profiles obtained from single higher Sérsic index fits to each disc galaxy rather than from a Sérsic bulge exponential disc fit. The average nucleus-to-spheroid mass ratio would therefore be larger than the reported value of 0.2 per cent for the nucleus-to-galaxy total mass ratio.
While an investigation of whether the use of is an appropriate tracer of total mass is beyond the intended scope of this paper, it does seem apt to remind readers that this question has a long history, often discussed in association with the Fundamental Plane (Djorgovski & Davis 1987; Faber et al. 1987; Djorgovksi, de Carvalho & Han 1988). For example, even within elliptical galaxies, luminosity-dependent dynamical non-homology may severely bias the applicability of aperture velocity dispersion measurements when deriving such quasi-”virial masses” from , and thus also bias any trends with luminosity (e.g. Hjorth & Madsen 1995; Ciotti et al. 1996; Busarello et al. 1997; Graham & Colless 1997; Prugniel & Simein 1997). Aside from concerns about measuring total spheroid masses, baryonic fuelling and feedback, albeit within a dark matter halo, are commonly thought to be responsible for establishing the (bulk of the) nuclei mass and setting the observed nuclear-to-(host spheroid) mass ratios (e.g. Silk & Rees 1998; Kauffmann & Haehnelt 2000; Benson et al. 2003; Croton et al. 2006; Booth & Schaye 2009). It therefore seems reasonable to construct a baryonic rather than (only) total mass-ratio relation. Moreover, we have been able to do so for the first time when including the mass of both nuclear components from the same galaxy.
While inward gas flow may result in galactic-centric star formation or fuelling much of the growth of massive BHs (e.g. Shankar et al. 2004), it has also been suggested that NCs may grow through the accretion of globular clusters, and/or super star clusters in spiral galaxies, via dynamical friction (Tremaine et al. 1975; Quinlan & Shapiro 1990). Dark matter may thus also have a role to play, thereby motivating the pursuit of reliable total masses. It has additionally been suggested that some BHs may be built through the runaway collision of the NC stars (Kochanek et al. 1987) or that, alternatively, a massive BH may effectively evaporate the surrounding NC (Ebisuzaki et al. 2001; O’Leary et al. 2006). It has also been proffered that NCs and massive BHs may have developed from the same initial formation process (Wehner & Harris 2006), such that a slower gas infall rate in smaller spheroids allows time for star formation and thus produces nuclear star clusters rather than massive black holes. Our larger (stellar) mass ratios in smaller mass spheroids may have implications for the required efficiency of feedback mechanisms in which supernova and stellar winds from NC stars regulate the nuclear-to-spheroid mass ratio (McLaughlin et al. 2006b). Moreover, it is hoped that the nuclear-to-spheroid (baryonic) mass ratios provided here may provide useful constraints for any potential evolutionary scenarios.
In future work we intend to present a new diagram showing versus velocity dispersion, . This will be achieved via a careful analysis of high-resolution HST images for as many of the 50 (+26) galaxies as possible. While barred galaxies can deviate from the - relation defined by non-barred galaxies (e.g. Graham 2008b; Graham & Li 2009), and one expects them to similarly deviate in the new - diagram due to their elevated values of , it may prove insightful to investigate this further. If barred galaxies have preferentially larger mass ratios than non-barred galaxies of the same velocity dispersion, then one may find less scatter in the new diagram and further potential clues to their evolution.
Within galaxy clusters, dwarf galaxies are the most common type of galaxy (e.g. Binggeli et al. 1985) and many of these are nucleated. Within the field environment, the most common type of galaxies are spiral galaxies (e.g. Allen et al. 2006; Baldry et al. 2006) and many of these are also known to be nucleated (e.g. Carollo et al. 1998; Böker et al. 2002; Balcells et al. 2003). Due to the difficulties associated with the detection of low mass black holes () in external galaxies, we speculate that androgynous nuclei might be far more common than currently recognised. Furthermore, given that nuclear star clusters are among the highest stellar density objects in the Universe, such a commonplace coexistence of nuclear star clusters and massive black holes may open up the prospect for numerous detections of low frequency gravitational radiation (e.g. Ju et al. 2000, and references therein) with the Laser Interferometer Space Antenna (LISA, Danzmann et al. 1996) from rapidly inspiralling stars, white dwarfs, neutron stars and stellar mass black holes about these massive black holes. Due to the substantially higher density of stars in NCs, compared to the underlying host galaxy (see Figure 5), past estimates of LISA-detectable gravitational radiation events (e.g. Sigurdsson 1997; Freitag 2001; Gair et al. 2004; Hopman & Alexander 2005, 2006a,b) may need to be revised upwards. The sense of the correction is of course welcome given the significance a direct detection could have by not only supporting Einstein’s concept of space and time but opening an entire new window through which to view, or rather listen to, our Universe.
5 Summary
We have identified roughly a dozen galaxies with a direct BH mass measurement and a nuclear star cluster, doubling the previous sample size for which these measurements are available. We speculate that the existence of such hermaphrodite nuclei may be a rather common event for spheroids with stellar-masses ranging from to (see also Gonzalez Delgado et al. 2008 and Seth et al. 2008).
We have shown that the mass of the nuclear component(s) increases from 0.1 per cent of the host spheroid’s stellar mass in large elliptical galaxies whose cores are dominated by a massive black hole, to several per cent in low stellar mass () spheroids whose cores are dominated by a nuclear star cluster (see Figures 1 and 3, and also Balcells et al. 2007).
We have derived a linear relation between the nuclear mass (BH and NC combined) and the stellar mass of the host spheroid. Given in equation 2, the relation can be expressed as (see Figure 3). We hereby suggest that this baryonic, nuclear-to-spheroid mass ratio relation is applicable to spheroids with eith either nuclear clusters or dual nuclei type, noting that the exponent may equal a value of 1 once dry merging commences (assuming no loss of nuclear components).
We have also identified a new (black hole)-(nuclear cluster) mass ratio relation pertaining to the coexistence of these entities. We provide a preliminary quatification of this relation in equation 1, which is such that for (see Figure 2).


6 acknowledgment
We thank Kenji Bekki for motivating us in 2007 to undertake this project. A.G. thanks the organisers of the February 2008 “Nuclear Star clusters across the Hubble Sequence” workshop held at the Max-Planck-Institut für Astronomie in Heidelberg, Germany, and the organisers of the July 2008 Lorentz Centre Workshop “Central Mass Concentrations in Galaxies” held in Leiden, The Netherlands, where preliminary versions of Figure 1 were presented.
References
- [1] Akritas, M.G., & Bershady, M.A., 1996, ApJ, 470, 706
- [2] Alexander, T. 2008, in the 2nd Kolkata conference on Observational Evidence for Black Holes in the Universe, ed. S.Chakrabarti, AIP Conf.Ser. 1053, 79
- [3] Allen, P.D., Driver, S.P, Graham, A.W., Cameron, E., Liske, J., & de Propris, R. 2006, MNRAS, 371, 2
- [4] Argon, A.L., et al. 2004, ApJ, 615, 702
- [5] Balcells, M., Graham, A.W., Domínguez-Palmero, L., & Peletier, R.F. 2003, ApJ, 582, L79
- [6] Balcells, M., Graham, A.W., Peletier, R. 2007, ApJ, 665, 1084
- [7] Baldry, I.K., Balogh, M.L., Bower, R.G., Glazebrook, K., Nichol, R.C., Bamford, S.P., & Budavari, T. 2006, MNRAS, 373, 469
- [8] Barth, A.J., Strigari, L.E., Bentz, M.C., Greene, J.E., & Ho, L.C. 2009, ApJ, 690, 1031
- [9] Bash, F.N., Gebhardt, K., Goss, W.M., & Vanden Bout, P.A. 2008, AJ, 135, 182
- [10] Bassino, L.P., Muzzio, J.C., & Rabolli, M. 1994, ApJ, 431, 634
- [11] Baumgardt, H., Hut, P., Makino, J., McMillan, S., & Portegies Zwart, S. 2003a, ApJ, 582, L21
- [12] Baumgardt, H., Makino, J., Hut, P., McMillan, S., & Portegies Zwart, S. 2003b, ApJ, 589, L25
- [13] Becklin, E.E., & Neugebauer, G. 1968, ApJ, 151, 145
- [14] Begelman, M.C., Blandford, R.D., & Rees, M.J. 1980, Nature, 287, 307
- [15] Bekki, K., Couch, W.J., Drinkwater, M.J., & Gregg, M.D. 2001, ApJ, 557, L39
- [16] Bekki, K., Couch, W.J., Drinkwater, M.J., Shioya, Y. 2003, MNRAS 344, 399
- [17] Bekki, K., & Norris, J.E. 2006, ApJ, 637, L109
- [18] Bellazzini, M., et al. 2008, AJ, 136, 1147
- [19] Benson A.J., Bower R.G., Frenk C.S., Lacey C.G., Baugh C.M., Cole S. 2003, MNRAS, 599, 38
- [20] Berentzen, I., Preto, M., Berczik, P., Merritt, D., & Spurzem, R. 2009, ApJ, 695, 455
- [21] Berghea, C.T., Weaver, K.A., Colbert, E.J.M., Roberts, T.P. 2008, ApJ, 687, 471
- [22] Bessell, M.S., Castelli, F., & Plez, B. 1998, A&A, 333, 231
- [23] Binggeli, B., Sandage, A., & Tammann, G.A. 1985, AJ, 90, 1681
- [24] Binggeli, B., Tammann, G A., & Sandage, A. 1987, AJ, 94, 251
- [25] Böker, T., Laine, S., van der Marel, R.P., Sarzi, M., Rix, H.-W., Ho, L.C., & Shields, J.C. 2002, AJ, 123, 1389
- [26] Böker, T., Stanek, R., & van der Marel, R.P. 2003, AJ, 125, 1073
- [27] Booth, C.M., & Schaye, J. 2009, MNRAS, in press (arXiv:0904.2572)
- [28] Bothun, G. 1992, AJ, 103, 104
- [29] Bower, G.A., et al. 2001, ApJ, 550, 75
- [30] Bromley, B.C., Kenyon, S.J., Geller, M.J., Barcikowski, E., Brown, & W.R., Kurtz, M.J. 2006, ApJ, 653, 1194
- [31] Brown, T.M. 2009, in “Galaxy Evolution: Emerging Insights and Future Challenges” (arXiv:0901.2577)
- [32] Bruzual, G., & Charlot, S. 2003, MNRAS, 344, 1000
- [33] Burbidge, G.R. 1970, ARA&A, 8, 369
- [34] Busarello, G., Capaccioli, M., Capozziello, S., Longo, G., & Puddu, E. 1997, A&A, 320, 415
- [35] Butler, D.J., & Martínez-Delgado, D. 2005, AJ, 129, 2217
- [36] Byun, Y.-I., et al. 1996, AJ, 111, 1889
- [37] Caon, N., Capaccioli, M., D’Onofrio, M., 1993, MNRAS, 265, 1013
- [38] Capaccioli, M. 1989, in The World of Galaxies, ed. H.G. Corwin, L. Bottinelli (Berlin: Springer-Verlag), 208
- [39] Cappellari, M., Verolme, E.K., van der Marel, R.P., Kleijn, G.A.V., Illingworth, G.D., Franx, M., Carollo, C.M., & de Zeeuw, P.T. 2002, ApJ, 578, 787
- [40] Cappellari, M., et al. 2008, in the proceedings of IAU Symposium 245, “Formation and Evolution of Galaxy Bulges”, eds. M.Bureau, E.Athanassoula, and B.Barbuy, p.215
- [41] Cardone, V.F., & Sereno, M. 2005, A&A, 438, 545
- [42] Carollo, C.M., Stiavelli, M., & Mack, J. 1998, AJ, 116, 68
- [43] Carollo, C.M., Franx, M., Illingworth, G.D., & Forbes, D.A. 1997, ApJ, 481, 710
- [44] Carter, D., & Sadler, E. 1990, MNRAS, 245, 12P
- [45] Catchpole, R.M., Whitelock, P.A., & Glass, I.S. 1990, MNRAS, 247, 479
- [46] Chabrier, G. 2003, AJ, 586, L113
- [47] Ciotti, L., Lanzoni, B., & Renzini, A. 1996, MNRAS, 282, 1
- [48] Coelho, P., Mendes de Oliveira, C., & Cid Fernandes, R. 2009, MNRAS, in press (arXiv:0903.0448)
- [49] Colina, L., Gonzalez Delgado, R., Mas-Hesse, J.M., & Leitherer, C. 2002, ApJ, 579, 545
- [50] Condon, J.J., Cotton, W.D., Greisen, E.W., Yin, Q.F., Perley, R.A., Taylor, G.B., & Broderick, J.J. 1998, AJ, 115, 1693
- [51] Côté, P., et al. 2006, ApJS, 165, 57
- [52] Cox, D.P. 2000, Allen’s Astrophysical quantities, New York: AIP Press; Springer
- [53] Croton, D.J., et al. 2006, MNRAS, 365, 11
- [54] Dabringhausen, J., Hilker, M., Kroupa, P. 2008, MNRAS, 386, 864
- [55] Danzmann, K., et al. 1996, Classical and Quantum Gravity, 13, A247
- [56] Davies, R.L., et al. 1983, ApJ, 266, 516
- [57] de Francesco, G., Capetti, A., & Marconi, A. 2008, A&A, 479, 355
- [58] de Paolis, F., Gurzadyan, V.G., & Ingrosso, G. 1996, A&A, 315, 396
- [59] De Rijcke, S., Prugniel, P., Simien, F., & Dejonghe, H. 2006a, MNRAS, 369, 1321
- [60] De Rijcke, S., Buyle, P., & Dejonghe, H. 2006b, MNRAS, 368, L43
- [61] de Vaucouleurs, G., de Vaucouleurs, A., Corwin, H.G.,Jr., Buta, R.J., Paturel, G., & Fouque, P. 1991, Springer-Verlag (RC3)
- [62] Djorgovski, S., & Davis, M. 1987, ApJ, 313, 59
- [63] Djorgovski, S., de Carvalho, R., & Han, M.-S. 1988, The Extragalactic Distance Scale, 4, 329
- [64] D’Onofrio, M., Capaccioli, M., & Caon, N. 1994, MNRAS, 271, 523
- [65] Dressler, A., & Sandage, A. 1983, ApJ, 265, 664
- [66] Driver, S. P., Popescu, C. C., Tuffs, R. J., Liske, J., Graham, A. W., Allen, P. D., & de Propris, R. 2007, MNRAS, 379, 1022
- [67] Dull, J.D., Cohn, H.N., Lugger, P.M., Murphy, B.W., Seitzer, P.O., Callanan, P.J., Rutten, R.G.M., & Charles, P.A 1997, ApJ, 481, 267
- [68] Dull, J.D., Cohn, H.N., Lugger, P.M., Murphy, B.W., Seitzer, P.O., Callanan, P.J., Rutten, R.G.M., & Charles, P.A 2003, ApJ, 585, 598
- [69] Dwek, E., et al. 1995, ApJ, 445, 716
- [70] Ebisuzaki, T., et al. 2001, ApJ, 562, L19
- [71] Emsellem, E., Dejonghe, H., & Bacon, R. 1999, MNRAS, 303, 495
- [72] Fabbiano, G., et al. 2003, ApJ, 588, 175
- [73] Faber, S.M., Dressler, A., Davies, R.L., Burstein, D., & Lynden-Bell, D. 1987, Nearly Normal Galaxies. From the Planck Time to the Present, 175
- [74] Faber, S.M., et al. 1997, AJ, 114, 1771
- [75] Ferguson, H.C. 1989, AJ, 98, 367
- [76] Ferrarese, L., Ford, H.C., Jaffe, W. 1996, ApJ, 470, 444
- [77] Ferrarese, L., et al. 2006a, ApJ, 644, L21
- [78] Ferrarese, L., et al. 2006b, ApJS, 164, 334
- [79] Ferrarese, L., & Ford, H.C. 1999, ApJ, 515, 583
- [80] Ferraro, F. R., Possenti, A., Sabbi, E., Lagani, P., Rood, R. T., D’Amico, N., & Origlia, L. 2003, ApJ, 595, 179
- [81] Filippenko, A.V., & Ho, L.C. 2003, ApJ, 588, L13
- [82] Forbes, D.A., Franx, M., & Illingworth, G.D. 1995, AJ, 109, 1988
- [83] Forbes, D.A., Lasky, P., Graham, A.W., Spitler, L.R. 2008, MNRAS, 389, 1924
- [84] Freeman, K. 1993, in: Graeme H. Smith & Jean P. Brodie (eds.), The Globular Cluster-Galaxy Connection, ASP-CS, vol.48, p.608
- [85] Freitag, M. 2001, Classical and Quantum Gravity, 18, 4033
- [86] Fukugita, M., Shimasaku, K., & Ichikawa, T. 1995, PASP, 107, 945
- [87] Gair, J.R., Barack, L., Creighton, T., Cutler, C., Larson, S.L., Phinney, E.S., & Vallisneri, M. 2004, Classical and Quantum Gravity, 21, 1595
- [88] Gallo, E., Treu, T., Jacob, J., Woo, J.-H., Marshall, P.J., Antonucci, R. 2008, ApJ, 680, 154
- [89] Gebhardt, K., et al. 1996, AJ, 112, 105
- [90] Gebhardt, K., et al. 2001, AJ, 122, 2469
- [91] Gebhardt, K., Rich, R.M., & Ho, L.C. 2002, ApJ, 578, L41
- [92] Gebhardt, K., et al. 2003, ApJ, 583, 92
- [93] Gebhardt, K., Rich, R.M., & Ho, L.C. 2005, ApJ, 634, 1093
- [94] Gebhardt, K., et al. 2007, ApJ, 671, 1321
- [95] Geha, M., Guhathakurta, P., & van der Marel, R.P. 2002, AJ, 124, 3073
- [96] Geha, M., Guhathakurta, P., & van der Marel, R.P. 2003, AJ, 126, 1794
- [97] Georgiev, I.Y., Hilker, M., Puzia, T.H., Goudfrooij, P., Baumgardt, H. 2009, MNRAS, 396, 1075
- [98] Gerssen, J., van der Marel, R.P., Gebhardt, K., Guhathakurta, P., Peterson, R.C., & Pryor, C. 2002, AJ, 124, 3270
- [99] Gerssen, J., van der Marel, R.P., Gebhardt, K., Guhathakurta, P., Peterson, R.C., & Pryor, C. 2003, AJ, 125, 376
- [100] Ghez, A. M., Salim, S., Hornstein, S. D., Tanner, A., Lu, J. R., Morris, M., Becklin, E. E., & Duchêne, G. 2005, ApJ, 620, 744
- [101] Ghosh, K.K., Suleymanov, V., Bikmaev, I., Shimansky, S., & Sakhibullin, N. 2006, MNRAS, 371, 1587
- [102] González Delgado, R.M., Pérez, E., Cid Fernandes, R., & Schmitt, H. 2008, AJ, 135, 747
- [103] Graham, A.W. 2002, ApJ, 568, L13
- [104] Graham, A.W. 2007, MNRAS, 379, 711
- [105] Graham, A.W. 2008a, PASA, 25, 167 Hu, J. 2008, MNRAS, 386, 2242
- [106] Graham, A.W. 2008b, ApJ, 680, 143
- [107] Graham, A.W., & Colless, M.M. 1997, MNRAS, 287, 221
- [108] Graham, A.W., & Driver, S.P. 2005, PASA, 22, 118
- [109] Graham, A.W., & Driver, S.P. 2007, ApJ, 655, 77
- [110] Graham, A.W., & Guzmán, R. 2003, AJ, 125, 2936
- [111] Graham, A.W., & Li, I. 2009, ApJ, 698, 812
- [112] Graham, A.W., & Worley, C.C. 2008, MNRAS, 388, 1708
- [113] Graham, A. W., Merritt, D., Moore, B., Diemand, J., & Terzić, B. 2006, AJ, 132, 2701
- [114] Grant, N.I., Kuipers, J.A., & Phillipps, S. 2005, MNRAS, 363, 1019
- [115] Gualandris, A., & Merritt, D. 2008, ApJ, 678, 780
- [116] Gültekin, K. et al. 2009, ApJ, 695, 1577
- [117] Häring, N., & Rix, H.-W. 2004, ApJ, 604, L89
- [118] Harris, W.E. 1996. AJ, 112, 1487
- [119] Ho, L.C., Filippenko, A.V., & Sargent, W.L.W. 1995, ApJS, 98, 477
- [120] Hopman, C., & Alexander, T. 2005, ApJ, 629, 362
- [121] Hopman, C., & Alexander, T. 2006a, ApJ, 645, 1152
- [122] Hopman, C., & Alexander, T. 2006b, ApJ, 645, L133
- [123] Houghton, R.C.W., Magorrian, J., Sarzi, M., Thatte, N., Davies, R.L., & Krajnović, D. 2006, MNRAS, 367, 2
- [124] Hu, J. 2008, MNRAS, 386, 2242
- [125] Hughes, M.A., et al. 2005, AJ, 130, 73
- [126] Jarrett, T.H., Chester, T., Cutri, R., Schneider, S.E., Huchra, J.P. 2000, AJ, 119, 2498
- [127] Hjorth, J., & Madsen, J. 1995, ApJ, 445, 55
- [128] Jerjen, H., Binggeli, B., & Barazza, F.D., 2004, AJ, 127, 771
- [129] Jones, D. H., et al. 1996, ApJ, 466, 742
- [130] Ju, L., Blair, D.G., Zhao, C. 2000, Rep. Prog. Phys. 63, 1317
- [131] Kauffmann, G., & Haehnelt, M. 2000, MNRAS, 311, 576
- [132] Kent, S.M. 1985, ApJS, 59, 115
- [133] Kent, S.M. 1987, AJ, 94, 306
- [134] Kent, S.M., Dame, T., & Fazio, G., 1991, ApJ, 378, 131
- [135] King, I. 1962, AJ, 67, 471
- [136] Knapen, J.H., de Jong, R.S., Stedman, S., & Bramich, D.M. 2003, MNRAS, 344, 527
- [137] Kochanek, C.S., Shapiro, S.L., & Teukolsky, S.A. 1987, ApJ, 320, 73
- [138] Komossa, S. & Bade, N. 1999, A&A, 343, 775
- [139] Komossa, S., & Merritt, D. 2008, ApJ, 683, L21
- [140] Kormendy, J., & Gebhardt, K., 2001, in The 20th Texas Symposium on Relativistic Astrophysics, ed. H. Martel, & J.C. Wheeler, AIP, 586, 363
- [141] Kormendy, J., & McClure, R.D. 1993, AJ, 105, 1793
- [142] Kormendy, J., & Richstone, D. 1995, ARA&A, 33, 581
- [143] Kormendy, J., et al. 1996, ApJ, 459, L57
- [144] Lanzoni, B., Dalessandro, E., Ferraro, F.R., Miocchi, P., Valenti, E., & Rood, R.T. 2007, ApJ, 668, L139
- [145] Laor, A. 2001, ApJ, 553, 677
- [146] Lauer, T.R., Faber, S.M., Ajhar, E.A., Grillmair, C.J., & Scowen, P.A. 1998, AJ, 116, 2263
- [147] Lauer, T.R., et al. 2005, AJ, 129, 2138
- [148] Launhardt, R., Zylka, R., & Mezger, P. G. 2002, A&A, 384, 112
- [149] Lee, M.-H. 1993, ApJ, 418, L147
- [150] Lee, M.-H. 1995, MNRAS, 272, 605
- [151] Li, C., & White, S.D.M. 2009, MNRAS, submitted (arXiv:0901.0706)
- [152] Li, J., Ma, J., Zhou, X., Jiang, Z., Yang, Y., & Chen, J. 2004, A&A, 420, 89
- [153] Lightman, A.P., & Shapiro, S.L. 1978, Reviews of Modern Physics, 50, 437
- [154] Lodato, G., King, A.R., Pringle, J.E. 2008, MNRAS, 392, 332
- [155] Lotz, J.M., Miller, B.W., Ferguson, H.C. 2004, ApJ, 613, 262
- [156] Lyubenova, M., Kuntschner, H., Silva, D.R. 2008, A&A, 485, 425
- [157] Ma, J., de Grijs, R., Fan, Z., Rey, S.-C., Wu, Z., & Zhou, X. 2009, RAA, in press (arXiv:0904.0674)
- [158] Maccarone, T.J., & Servillat, M. 2008, MNRAS, 389, 379
- [159] Macchetto, F., Marconi, A., Axon, D. J., Capetti, A., Sparks, W., & Crane, P. 1997, ApJ, 489, 579
- [160] Maciejewski, W., & Binney, J. 2001, MNRAS, 323, 831
- [161] Marconi, A., et al. 2003, ApJ, 586, 868
- [162] Marconi, A., & Hunt, L.K., 2003, ApJ, 589, L21
- [163] Mateo M.L. 1998, ARA&A, 36, 435
- [164] Matković, A., & Guzmán, R. 2005, MNRAS, 362, 289
- [165] McConnachie, A.W., Irwin, M.J., Ferguson, A.M.N., Ibata, R.A., Lewis, G.F., Tanvir, N. 2005, MNRAS, 356, 979
- [166] McCrady, N., Gilbert, A.M., Graham, J.R. 2003, ApJ, 596, 240
- [167] McLaughlin, D.E., Anderson, J., Meylan, G., Gebhardt, K., Pryor, C., Minniti, D., & Phinney, S. 2006a, ApJS, 166, 249
- [168] McLaughlin, D.E., King, A.R., Nayakshin, S. 2006b, ApJ, 650, L37
- [169] Miller, N.A., Mushotzky, R.F., & Neff, S.G. 2005, ApJ, 623, L109
- [170] Merritt, D. 2008, ApJ, 694 959
- [171] Merritt, D., & Ferrarese, L. 2001, MNRAS, 320, L30
- [172] Merritt, D., Ferrarese, L., & Joseph, C.L. 2001, Science, 293, 1116
- [173] Merritt, D., Mikkola, S., & Szell, A. 2007, ApJ, 671, 53
- [174] Merritt, D., Milosavljević, M., Favata, M., Hughes, S.A., & Holz, D.E. 2004, ApJ, 607, L9
- [175] Meylan, G., Mayor, M., Duquennoy, A., & Dubath, P. 1995, A&A, 303, 761
- [176] Meylan, G., Sarajedini, A., Jablonka, P., Djorgovski, S.G., Bridges, T., & Rich, R.M. 2001, AJ, 122, 830
- [177] Mighell, K.J., & Rich, R.M. 1995, AJ, 110, 1649
- [178] Minniti, D., Olszewski, E. W. & Rieke, M. 1993, ApJ, 410, L79
- [179] Miniutti, G., Ponti, G., Dadina, M., Cappi, M., Malaguti, G., Fabian, A.C., & Gandhi, P. 2006, MNRAS, 373, L1
- [180] Noyola, E., Gebhardt, K., Bergmann, M. 2008, ApJ, 676, 1008
- [181] Nucita, A.A., De Paolis, F., Ingrosso, G., Carpano, S., & Guainazzi, M. 2008, A&A, 478, 763
- [182] Oh, S., Kim, S.S., & Figer, D.F. 2009, JKAS, 42, 17
- [183] O’Leary, R.M., Kocsis, B., Loeb, A. 2009, MNRAS, 395, 2127
- [184] O’Leary, R.M., Rasio, F.A., Fregeau, J.M., Ivanova, N., & O’Shaughnessy, R. 2006, ApJ, 637, 937
- [185] Pastorini, G., et al. 2007, A&A, 469, 405
- [186] Patruno, A., Portegies Zwart, S., Dewi, J., & Hopman, C. 2006, MNRAS, 370, L6
- [187] Peterson, B.M., et al. 2005, ApJ, 632, 799
- [188] Pinkey, J., et al. 2003, ApJ, 596, 903
- [189] Pooley, D., & Rappaport, S. 2006, ApJ, 644, L45
- [190] Portegies Zwart, S.F., Baumgardt, H., Hut, P., Makino, J., & McMillan, S.L.W. 2004, Nature, 428, 724
- [191] Prugniel, P., & Simien, F. 1997, A&A, 321, 111
- [192] Quinlan, G.D. 1996, New Astronomy, 1, 35
- [193] Quinlan, G.D., & Shapiro, S.L. 1987, ApJ, 321, 199
- [194] Quinlan, G.D., & Shapiro, S.L. 1990, ApJ, 356, 483
- [195] Ravindranath, S., Ho, L.C., Peng, C.Y., Filippenko, A.V., & Sargent, W.L.W. 2001, AJ, 122, 653
- [196] Regan, M.W., & Vogel, S.N. 1994, ApJ, 434, 536
- [197] Renzini, A., Greggio, L., di Serego Alighieri, S., Cappellari, M., Burstein, D., & Bertola, F. 1995, Nature, 378, 39
- [198] Rest, A., van den Bosch, F. C., Jaffe, W., Tran, H., Tsvetanov, Z., Ford, H. C., Davies, J., & Schafer, J. 2001, AJ, 121, 2431
- [199] Rix, H.-W., Carollo, C.M., & Freeman, K., 1999, ApJ, 513, L25
- [200] Rogers, B., Ferreras, I., Peletier, R.F. 2008, Silk, J. 2008, MNRAS, submitted (arXiv:0812.2029)
- [201] Rose, J. A., Arimoto, N., Caldwell, N., Schiavon, R. P., Vazdekis, A., & Yamada, Y. 2005, AJ, 129, 712
- [202] Rosswog, S., Ramirez-Ruiz, E., & Hix, R. 2009, ApJ, 695, 404
- [203] Rubin, V. 1974, Nuclei of Galaxies, Black Holes, and Collapsed Matter, 3rd, Erice, Italy, May 8-20, 1974, Lecture. 11 p.
- [204] Rubin, V.C., Peterson, C.J., & Ford, W.K., Jr. 1980, ApJ, 239, 50
- [205] Satyapal, S., Vega, D., Heckman, T., O’Halloran, B., & Dudik, R. 2007, ApJ, 663, L9
- [206] Schlegel, D. J., Finkbeiner, D. P., & Davis, M. 1998, ApJ, 500, 525
- [207] Schmidt, A. A., Bica, E., & Alloin, D. 1990, MNRAS, 243, 620
- [208] Schödel, R., et al. 2007, A&A, 469, 125
- [209] Schödel, R., Merritt, D., & Eckart, A. 2009a, Journal of Physics Conference Series, 131, 012044
- [210] Schödel, R., Merritt, D., & Eckart, A. 2009b, A&A, in press (arXiv:0902.3892)
- [211] Seigar, M., Carollo, C.M., Stiavelli, M., de Zeeuw, P.T., & Dejonghe, H. 2002, AJ, 123, 184
- [212] Seth, A., Agüeros, M., Lee, D., Basu-Zych, A. 2008, 678, 116
- [213] Shankar, F., Salucci, P., Granato, G.L., De Zotti, G., & Danese, L. 2004, MNRAS, 354, 1020
- [214] Shapiro, K.L., Cappellari, M., de Zeeuw, T., McDermid, R.M., Gebhardt, K., van den Bosch, R.C.E., & Statler, T.S. 2006, MNRAS, 370, 559
- [215] Shen, J., Vanden Berk, D.E., Schneider, D.P., & Hall, P.B. 2008, AJ, 135, 928
- [216] Shields, J.C., Walcher, C.J., Boeker, T., Ho, L.C, Rix, H.-W., van der Marel, R.P. 2008, ApJ, 682, 104
- [217] Silk J., & Rees M.J. 1998, A&A, 331, L1
- [218] Sigurdsson, S. 1997, Classical and Quantum Gravity, 14 1425
- [219] Sil’chenko, O.K. 1999, AJ, 117, 2725
- [220] Sil’chenko, O.K., Afanasiev, V.L., Chavushyan, V.H., & Valdes, J.R. 2002, ApJ, 577, 668
- [221] Smith, S. 1935, ApJ, 82, 192
- [222] Soria, R., Graham, A.W., Fabbiano, G., Baldi, A., Elvis, M., Jerjen, H., Pellegrini, S., & Siemiginowska, A. 2006, ApJ, 640, 143
- [223] Stanford, L.M., Da Costa, G.S., Norris, J.E., & Cannon, R.D. 2007, ApJ, 667, 911
- [224] Stiavelli, M., Miller, B.W., Ferguson, H.C., Mack, J., Whitmore, B.C., & Lotz, J.M. 2001, AJ, 121, 1385
- [225] Thim, F., Hoessel, J.G., Saha, A., Claver, J., Dolphin, A., & Tammann, G.A. 2004, AJ, 127, 2322
- [226] Tomita, A., Aoki, K., Watanabe, M., Takata, T., & Ichikawa, S.-I. 2000, AJ, 120, 123
- [227] Tonry, J.L., 1984, ApJ, 283, L27
- [228] Tonry, J.L., Dressler, A., Blakeslee, J.P., Ajhar, E.A., Fletcher, A.B., Luppino, G.A., Metzger, M.R., & Moore, C.B. 2001, ApJ, 546, 681
- [229] Tremaine, S.D., Ostriker, J.P., & Spitzer, L.Jr. 1975, ApJ, 196, 407
- [230] van de Ven, G., van den Bosch, R.C.E, Verolme, E.K., & de Zeeuw, P.T. 2006, A&A, 445, 513
- [231] van den Bosch, R., de Zeeuw, T., Gebhardt, K., Noyola, E., & van de Ven, G. 2006, ApJ, 641, 852
- [232] Valluri, M., Ferrarese, L., Merritt, D., & Joseph, C.L. 2005, ApJ, 628, 137
- [233] Verdoes Kleijn, G. A., Baum, S. A., de Zeeuw, P. T., & O’Dea, C.P. 2002, AJ, 123, 1334
- [234] Verolme, E.K., et al. 2002, MNRAS, 335, 517
- [235] Walcher, C.J., et al. 2005, ApJ, 618, 237
- [236] Wehner, E. H., & Harris, W. E. 2006, ApJ, 644, L17
- [237] Wolter, A., Trinchieri, G., & Colpi, M. 2006, MNRAS, 373, 1627
- [238] Worthey, G. 2004, AJ, 128, 2826
- [239] Wyse, R.F.G., Gilmore, G., & Franx, M. 1997, ARA&A, 35, 637
- [240] Yanny, B., Guhathakurta, P., Bahcall, J.N., & Schneider, D.P. 1994, AJ, 107, 1745
- [241] Zepf, S.E., et al. 2008, ApJL, 683, L139
7 APPENDIX: The Data
Here we provide sufficient information for the reader to reconstruct our data set, shown in Tables 1 and 2, and include the necessary references to relevant sources of literature. When no clear (refereed) literature data was available for a nuclear cluster’s magnitude, we have modelled the galaxy’s light profile ourselves to determine the stellar flux. Select notes on individual objects are provided below, along with a brief mention of some objects that were excluded.
Columns 1 and 2 of Table 2 provide the object name and its morphological type. The black hole masses (column 4 of Table 2) have been adjusted according to updated information on their distances, which are provided in column 3.
Galaxy magnitudes were used for the elliptical galaxies, while bulge magnitudes were used for the lenticular (and the few spiral) galaxies. These are listed in column 4 of Table 2. These “spheroid” magnitudes were then converted into solar masses. This first required that we calibrate them in terms of solar luminosity, and we used the following absolute solar magnitudes (Cox 2000): ; ; ; supplemented with (Bessell et al. 1998); and 666http://www.ucolick.org/cnaw/sun.html. These spheroid luminosities were then converted into masses using an appropriate stellar mass-to-light () ratio: for elliptical galaxies (and lenticular bulges) we assumed an age of 13 Gyr and [Fe/H] = 0.5 dex (and 7 Gyr and [Fe/H] = 0.3 dex), which gave a -band stellar mass-to-light ratio of dex (and dex). Given that the -band stellar mass-to-light ratio varies little with metallicities ranging from [Fe/H] = 0.0 to 0.6 dex, and with ages ranging from 5 to 13 Gyr, the above selection of age and metallicity has little effects on the results. For the bulges in spiral galaxies, and when no reliable -band magnitudes were available, the derivation of the stellar ratio is given below. The adopted ratios for each passband are shown in column 5 of Table 2, while the spheroid masses are given in column 6. Given the various sources of uncertainty in each step, these values are likely to be accurate to within a factor of two.
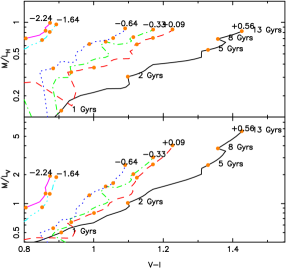
Because the NCs may have a considerable range of ages (and metallicities), individual stellar ratios were determined for each NC. To estimate these we have used the available NC colours (see below) together with the models by Bruzual & Charlot (2003) and a Chabrier (2003) initial mass function (see Figure 4). The approach adopted is discussed below for each NC, and the results are shown in columns 7 to 9 of Table 2. In some instances we bypassed this process and used literature established masses.
7.1 Notes on individual galaxies
Milky Way: Due to its proximity, the centre of our own galaxy, the Milky Way, has long been suspected of harbouring both a nuclear star cluster and a supermassive black hole (Rubin 1974). References to the masses of these entities (not the mass within the inner parsec: Schödel et al. 2009b) are provided in Table 2, along with an estimate of the mass of the Milky Way’s bulge.
The nuclear star cluster has most recently been examined by Schödel et al. (2009a) and Oh et al. (2009). In Figure 5 we have performed a separation of the Milky Way’s NC light from the background bulge (and at some level bar) light using a standard decomposition technique. For perhaps the first time, we report that the nuclear cluster of the Milky Way is reasonably well represented by a Sérsic function with index ; it has an effective half-light radius equal to 80 arcseconds (3.2 pc). It is perhaps worth emphasising that this is far from a Gaussian distribution which would have a Sérsic index of 0.5. Determination of whether alternative models, such as the King (1962) model, provide a better fit will be left for a separate study.
Due to the uncalibrated nature of the published light profile, we are not able to report a magnitude for the nuclear cluster. However, even though no extinction corrections were applied, having accounted for the background bulge flux in Figure 5, we can provide rough estimates to the negative logarithmic slope of the nuclear cluster’s projected density profile , with (Capaccioli 1989; Graham & Driver 2005). At , , and at , . The associated negative logarithmic slope of the nuclear cluster’s internal 3D (i.e. non-projected) density profile is 2.0 and 2.7, respectively (Graham et al. 2006, their Eq.23). This is steeper than previous estimates of 1.4 to 1.8 (Becklin & Neugebauer 1968; Catchpole et al. 1990; Schödel et al. 2009a, 2009b and references therein) which have been biased by bulge stars.
M32 Ferrarese et al. (2006a) suggest that M32 may contain both a nuclear star cluster (Smith 1935; Burbidge 1970; Worthey 2004) and a BH (Verolme et al. 2002, ). In Figure 6 we present an -band light profile which we have fitted with an inner nuclear component, plus a Sérsic bulge and an outer exponential envelope/disc (see Graham 2002). The inner component and the main spheroid component have an apparent magnitude of 10.0 and 7.5 mag, respectively. The Sérsic index of the inner component is 2.3 (the effective half-light radius is 1.65 arcseconds, equal to 6 pc). Together with the Milky Way’s nuclear star cluster, this paper presents the first clear evidence/statement that nuclear excesses do not all have a Gaussian-like structure (i.e. );
Although we initially excluded M32 due to the somewhat unknown nature of its central excess, spectroscopy has revealed that the inner region of M32 does possess a different mean chemistry and age (e.g. Worthey 2004; Rose et al. 2005) to the main spheroid, although no obvious transitional radius is apparent. This difference has most recently been quantified by Coelho et al. (2009), using an inner 1.5 arcsecond slit to sample the nuclear region. Using the spread of ages and metallicties from their Table 3 gives an -band, stellar ratio of and for the nucleus and main spheroid of M32.
Exclusion of M32 from the analysis has no significant effect on any of the results.
NGC 1023: Bower et al. (2001) show that the average colour within 1.0 (0.1) arcsecond is 1.4 (1.25). From the innermost colour our adopted stellar population models tell us that the metallicity is super-solar and that the population must be of an intermediate to old age, in agreement with the 7 Gyr old age from Sil’chenko (1999). From Figure 4 the associated -band, stellar ratio is in the range and we adopt for the NC magnitude from Bower et al. (2001, their Eq.2).
Faber et al. (1997) report for this galaxy, a typical colour for an old population. Assuming a 13 Gyr old stellar population, we have applied a -band stellar ratio of 1.0 to the -band bulge magnitude tabulated in Marconi Hunt (2003).
NGC 1399: While Houghton et al. (2006) had suggested that a nuclear disc may be present, Gebhardt et al. (2007) refute the existence of any second component at the centre of NGC 1399. However Lyubenova et al. (2008) have since suggested that a nuclear star cluster (perhaps a partially digested, bright globular cluster) may reside within the inner 0.3 arcseconds (30 pc) and we tentatively accept its existence. If, however, NGC 1399 does not possess a NC, it will have no impact on our results. This is because the NC/BH mass ratio is so small that the data point in our Figures 1 to 3 will barely move if we set .
For a 13 Gyr old population, , which was used for this galaxy. It is interesting to note that NGC 1399 is a “core galaxy”. No other such galaxies, with their partially depleted stellar cores, appear to house nuclear star clusters. The apparent excess nuclear flux in some “core galaxies” (for example, the Sy2 LINER NGC 4552) is almost invariably due to non-thermal radiation from an active galactic nucleus; in some instances it may also be due to residuals from the deconvolution process used on early HST images.
NGC 2778: From kinematical measurements, Rix et al. (1999) revealed that this object is a lenticular galaxy, in agreement with the designation by Kent (1985). Marconi & Hunt (2003) report a -band galaxy magnitude, which has been converted into a bulge magnitude by Graham & Driver (2007, their Section 4.2.1) that we use here. While Gebhardt et al. (2003) provide a BH mass for this galaxy, it is worth noting that their zero BH mass model is only ruled out at the 1.5-2 level. Lauer et al. (2005) provide a -band estimate for the magnitude of the central nucleus (a previously unpublished result from Gebhardt et al. 1996). The absence of radio flux at 1.4 GHz, according to the NRAO VLA Sky Survey777http://www.cv.nrao.edu/nvss/NVSSlist.shtml (NVSS; Condon et al. 1998), suggests that the nuclear source is due to thermal emission from stars rather than non-thermal emission from an AGN. The stated colour in Lauer et al. (2005) is 1.3, corresponding to a range in the stellar ratio of . Given the similarity with the colour for the NC in NGC 1023, we adopt , giving a NC mass of when using our updated distance.
Rest et al. (2001) did however report that there is no nuclear star cluster in NGC 2778 — although they noted that they had “been fairly conservative in assigning nucleation”. We have therefore inspected their published F702W WFPC2 data, and model their (Dexter-extracted)888A hard disc crash caused the loss of the original data (Rest 2009, priv. comm.). minor-axis light profile in our Figure 7. Using the minor axis light profile helps to avoid the discy, or bar-like, feature at 5 arcseconds (0.5 kpc) which dominates both the major-axis light profile and the ellipticity profile. We find that the nuclear component, fitted with an Sérsic model, has an apparent F702W magnitude of 20.0 mag. Given the colour of 1.3, we have a well constrained ratio of 1.50, giving a NC mass of , which we have used in this study. This value is only 40 per cent smaller than the value derived from the -band data.
NGC 3115: This is another lenticular galaxy with a large-scale rotating disc (Rubin et al. 1980). Kormendy et al. (1996) and Emsellem et al. (1999) have noted the presence of a nuclear point source, while Lauer et al. (2005) provide a -band magnitude for this NC which equates to mag for a galaxy distance of 9.7 Mpc (Tonry et al. 2001). The colour in Lauer et al. (2005) is 1.2, corresponding to for all combinations of stellar metallicities and ages. We again adopt for the NC.
NGC 3384: We have used the NC’s -band magnitude from Ravindranath et al. (2001). The nuclear colour of 1.3 from Lauer et al. (2005), implies a -band ratio of assuming [Fe/H] 0.56 (Figure 4). From this we derive a NC mass of . As a check, we note that Lauer et al. (2005, their Table 8) provide a -band NC luminosity of . Multiplying by an ratio of 2.5 gives a mass of , similar within a factor of 2.
NGC 3621: This Sd galaxy contains an AGN and a NC (Satyapal et al. 2007; Barth et al. 2008). The bulge is evident as excess light over the inner 10 arcseconds of the disc.
NGC 4026: We have taken the black hole mass from Gültekin et al. (2009) and adjusted its value according to the distance given by Tonry et al. (2001), who report a distance modulus of 30.67 for this edge-on lenticular galaxy. The -band nucelar cluster magnitude is reported by Lauer et al. (2005, their Table 8) to be mag when using a distance of 15.6 Mpc; which we adjust to mag for our adopted distance of 13.6 Mpc. The innermost colour, shown in Figure 3 of Lauer et al. (2005) is 1.1, corresponding to (see Figure 4). The mean colour of the bulge is 1.3, indicative of a . Gültekin et al. (2009) report an ratio of which we shall adopt here. The bulge magnitude is reported to be mag (Lauer et al. 2005), which we adjust to mag for our adopted distance. This has then been converted into a bulge magnitude by assuming a typical lenticular galaxy bulge-to-total flux ratio of 1/4 (e.g., Graham & Worley 2008, and references therein), and achieved by adding to give a value of mag.
NGC 4564: Côté et al. (2006) identified this S0 galaxy as hosting both a NC and a BH; although they were unable to measure the brightness of its NC. From the surface brightness, colour and ellipticity profile for NGC 4564 (VCC 1664) in Figure 61 from Ferrarese et al. (2006b), one can discern that this S0 galaxy has a relatively blue () nucleus and a large-scale stellar disc which starts to dominate beyond 5 arcseconds. However no reliable structural decomposition is available.
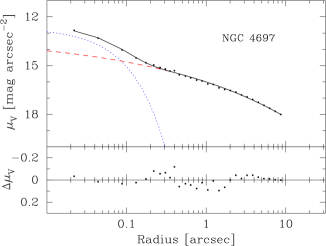
NGC 4697: The nuclear dust disc in this galaxy was masked out prior to the extraction of the light profile (Byun et al. 1996). In Figure 8 we have simultaneously fit the inner-component of NGC 4697’s surface brightness profile, taken from Byun et al. (1996), with an Sérsic model and the main galaxy with an Sérsic model (Soria et al. 2006). This yields a magnitude for the inner component of 17.5 F555W-mag and a half-light radius of 4.4 parsecs. Using a distance modulus of 30.34 (Tonry et al. 2001) and (Fukugita et al. 1995), one obtains an absolute magnitude of -mag. Based on the properties of the preceding galaxies, we have adopted for the NC.
NGC 7457: Ravindranath et al. (2001) report an -band magnitude for the nuclear cluster of NGC 7457 which is 0.8 mag brighter than the value in Balcells et al. (2007) because they treated the point source and the nuclear disc as a single entity. From a spectroscopic analysis, Sil’chenko et al. (2002) report a nuclear cluster age of 2-2.5 Gyr. Together with the colour from Lauer et al. (2005), this implies a metallicity of 0.5 and therefore a -band ratio of 0.4 (Figure 4). Sil’chenko et al. (2002) also report a host bulge age Gyr, which is in accord with our adopted value for the bulges of disc galaxies.
The BH mass for NGC 7457 was derived assuming that the excess central light, above the inward extrapolation of the outer light profile, is AGN flux (Gebhardt et al. 2003). While Ho et al. (1995) see no obvious nuclear emission from NGC 7457, Gebhardt et al. (2003) suggested that it may be a weak BL Lac object. Their BH mass determination inherently assumed there is no additional nuclear mass components present. However some of the excess nuclear light emanates from what is a nuclear disc and a likely star cluster (Balcells et al. 2007). The BH mass is therefore unfortunately in error at an unknown level. Resolving this issue is beyond the scope of this paper and we simply flag the data from this galaxy as uncertain.
7.2 Systems with only an upper limit to
NGC 598 (M33): For the Scd galaxy M33, we corrected the galaxy’s apparent -band magnitude of 6.27 mag (RC3) for 0.18 mag of Galactic extinction (via NED), and using an inclination of 54 degrees we corrected for 0.35 mag of internal extinction (Driver et al. 2007). This resulted in an absolute -band magnitude of mag for this galaxy. The average -band bulge-to-total () flux ratio for Scd galaxies is 0.027 (Graham & Worley 2008) giving an expected bulge magnitude of mag. From a bulge/disc decomposition of M33, Bothun (1992) reports a comparable -band bulge-to-disc () ratio of 0.02 (see also Minniti et al. 1993; Regan & Vogel 1994; and Mighell & Rich 1995). We do however note that while there is an obvious excess of flux above the inward extrapolation of this galaxy’s outer exponential light distribution, M33 does not possess a traditional bulge (Wyse et al. 1997; Brown 2009). The central excess of stars might be better thought of as a “pseudo-bulge” rather than a classical bulge, i.e. a small elliptical galaxy, and readers may ignore this system if they wish. The central bulge regions of M33 have been reported as 8-10 Gyr old (Li et al. 2004), and Wyse et al. (1997) note [Fe/H] . This implies , and we adopt the midpoint giving for the (pseudo-)bulge in M33.
The NC mass of was obtained from Kormendy & McLure (1993). NC masses should perhaps not be obtained from the virial theorem’s approximation, , because they are not isolated systems, but reside within the potential and pressure of their host spheroid. As a rough check, we note that the nuclear colour is while the galaxy colour is 1.0 (Gebhardt et al. 2001). Schmidt et al. (1990) have reported intermediate to old stars, with [Fe/H] , dominate the NC, and so from a diagram of versus (akin to Figure 4) one has that dex. Using the -band NC magnitude of mag from Kormendy & McLure (1993), the NC mass is .
NGC 205:
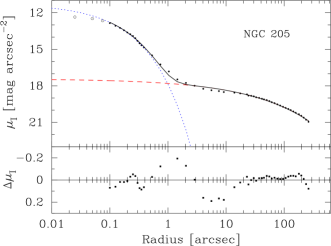
In addition to M33, NGC 205 also has only an upper limit to the mass of any potential BH at its centre (Valluri et al. 2005). It does however possess a very obvious nuclear star cluster (e.g., Carter & Sadler 1990). From the F814W surface brightness profile in Figure 9, the inner nuclear component has an absolute magnitude of -mag (using a distance of 0.82 Mpc)999We elected not to use the nuclear cluster magnitudes from Butler & Martínez-Delgado (2005) because they were derived from Nuker model fits whose outer power-law results in excessive light at large radii being assigned to the NC.. There is some evidence for excess light from 0.5 to 3 arcseconds and Butler & Martínez-Delgado (2005) have remarked that there may be a nuclear disc present. Using from Valluri et al. (2005), the associated mass of the nuclear cluster is , in fair agreement with our adopted (dynamical) value of from de Rijcke et al. (2006a).
For a 13 Gyr old spheroid population, , which is in good agreement with our adopted value of 2.7 from De Rijcke et al. (2006a).
NGC 4041: The absolute bulge magnitude has been derived from the (extinction corrected) apparent galaxy magnitude mag (RC3 and NED) using the average, -band, Sbc bulge-to-total flux ratio 0.069 (Graham & Worley 2008), giving -mag. This was transformed into a mass by first deriving a metallicity of [Fe/H] 0.25 dex, using (2MASS)101010Two micron all sky survey: Jarrett et al. (2000). and (RC3). Assuming an age of 1-5 Gyr for the bulge, the associated -band ratio ranges from 0.3 to 1.2. We adopted the midpoint of 0.6, and acknowledge a factor of two uncertainty in this value.
The nuclear cluster mass was constrained using the photometry from Marconi et al. (2003). From their nuclear colours, and , the logarithm of the -band ratio is constrained to , and we adopt for the NC.
VCC 1254: The upper limit to () is from Geha et al. (2002, their Section 3.2.3). It is however a rather high upper limit, as revealed by the location of this object in the - diagram given its velocity dispersion kms s-1. The nuclear cluster has a colour of while the main galaxy has colour gradient increasing from 1.2 at 1 arcsecond to 1.40 at 15 arcseconds (Stiavelli et al. 2001). The galaxy’s colour implies a metallicity [Fe/H] greater than dex. Assuming that the NC has a metallicity (between -0.1 and +0.56, see Figure 4), then its colour implies , and we have adopted for the nucleus. From Figure 4, we know that the galaxy must be relatively old, and adopting the outer colour, one has . Geha et al. (2002) reported = 6 and we have adopted this here for the galaxy.
7.3 Globular and Star Clusters
For the first three globular clusters noted below, our estimates of their stellar mass — which we use to roughly check their adopted dynamical mass — are derived assuming that their stellar populations are predominantly old.
M15: NGC 7078 was initially heralded as the first detection of a GC with an intermediate mass black hole (IMBH) (Yanny et al. 1994; Gerssen et al. 2002, 2003). These claims have however since been questioned (de Paolis et al. 1996; Baumgardt et al. 2003a; van den Bosch et al. 2006; Bash et al. 2008). The absolute -band magnitude from the updated Harris (1996) catalogue is mag (after dust correction). Using the metallicity [Fe/H] = dex from Harris (1996), one has dex, giving a stellar mass of . This is in good agreement with our adopted mass of from Dull et al. (1997), after correcting their distance of 7.2 kpc to 10.3 kpc (van den Bosch et al. 2006).
G1: Gebhardt et al. (2002, 2005) have claimed the existence of an IMBH in the suspected globular cluster G1 (but see Ma et al. 2009) associated with the Andromeda galaxy M31; with their zero mass BH model ruled out at the 97 per cent level. However a consensus has not been reached with plausible alternative scenarios yet to be properly ruled out (Baumgardt et al. 2003b; Pooley & Rappaport 2006). Again assuming a predominantly old stellar population, and using the metallicity [Fe/H] = dex from Harris (1996), one has dex. Brightening the cluster’s published absolute -band magnitude (Meylan et al. 2001) by 0.1 mag for our new distance, and by 0.2 mag for Galactic extinction, its magnitude of mag implies a stellar mass of , in reasonable agreement with our adopted value of (Baumgardt et al. 2003b).
Cen: As noted by Noyola et al. (2008), this object may have an IMBH, although these authors conclude that “detailed numerical simulations are required to confidently rule out other possibilities”. While we have adopted the dynamical mass for the cluster of from Meylan et al. (1995), we note that our derivation of the stellar mass is 2.5 times smaller. The absolute -band magnitude from the updated Harris (1996) catalogue is mag (after dust correction). Using the metallicity from Harris [Fe/H] = dex gives dex and thus a stellar mass of .
Dynamical-to-stellar mass ratios of 2 to 3 are not uncommon for bright globular clusters (e.g., Dabringhausen et al. 2008; Forbes et al. 2008). It is thought that this may be a reflection that the adopted initial stellar mass function is inappropriate, which therefore affects the estimated stellar ratio. The multiple stellar populations in Cen (e.g., Stanford et al. 2007, and references therein), and its possible origin as the nucleus of a stripped dwarf galaxy (Bekki & Norris 2006; Georgiev et al. 2009) also complicate matters.
RZ2109, 47 Tuc, NGC 6388, NGC 6752, and RBS 1032: The globular cluster RZ2109 associated with the Virgo elliptical galaxy NGC 4472 is not included as claims for its IMBH appear to have been premature (Zepf et al. 2008). The globular cluster 47 Tuc is also excluded (de Rijcke et al. 2006b; McLaughlin et al. 2006a) as the 1 uncertainties on the IMBH mass are consistent with a value of zero. Similarly, due to uncertainties as to their existence, potential intermediate mass BHs in NGC 6388 (Lanzoni et al. 2007; Nucita et al. 2008), NGC 6752 (Ferraro et al. 2003) and RBS 1032 (Ghosh et al. 2006) are also not included at this time. Lists of additional (lesser known) globular clusters which have been probed by others for signs of an IMBH can be seen in Maccarone & Servillat (2008, their Table 1).
MGG 11: The potential IMBH within the dense, young star cluster MGG-11 (Portegies Zwart et al. 2004; Patruno et al. 2006) — which is only 200 pc from the centre of NGC 3034 (M82) — is the brightest X-ray source in M82 . Dynamical friction (e.g., Bellazzini et al. 2008) is expected to result in the eventual centralisation of this star cluster within M82, albeit after some probable growth to the IMBH and perhaps some evaporation of the star cluster (e.g.. Ebisuzaki et al. 2001). The available BH mass estimate has however been acquired from a rather indirect method, and we refer readers to the cautionary note in Berghea et al. (2008) when considering the validity of this object.
The brightest ultraluminous X-ray source in the southern ring of the Cartwheel galaxy, known as N.10, has not yet been mated with any specific star cluster and hence, even if it is an intermediate mass BH, cannot be included (Wolter et al. 2006). Similarly, no such association is known for MCG03-34-63 X-1 (Miniutti et al. 2006) which is also excluded. Other ultraluminous X-ray sources, such as X-1 in the dwarf irregular galaxy Holmberg II (Miller et al. 2005), are also excluded due to their uncertain nature (Berghea et al. 2008).
7.4 Active Galactic Nuclei
An increasing number of galaxies with both NCs and active galactic nuclei (AGN) have been found. Perhaps the most well known is NGC 4395 (Filippenko & Ho 2003) because useful estimates of its BH mass exist. A second example is NGC 4303 (Colina et al. 2002), however its BH mass is poorly constrained (Pastorini et al. 2007) and thus not included here. From an analysis of 176 galaxies previously identified to have a NC, Seth et al. increase the count by identifying ten (their section 3.3: NGC 1042, NGC 3259, NGC 4411B, NGC 4750, NGC 5377, NGC 5879, NGC 6000, NGC 6384, NGC 6951, NGC 7418) plus two (their section 4: NGC 4321, NGC 5921). Furthermore, an additional 30 galaxies have been identified as having some indication of a possible BH. However, without useful estimates of their BH masses, we can only include a fraction of such systems.
NGC 4395: An inspection of Filippenko & Ho’s (2003) Figure 3 suggests that the unaccounted for excess flux seen from 1 to 2 arcseconds, peaking at 0.6 mag arcsec-2 above their fitted model, may be the (expectedly small) bulge of this Sd spiral galaxy. Starting with the total apparent -band galaxy magnitude of 10.64 mag (RC3), we have applied a Galactic dust correction mag (Schlegel et al. 1998) and, assuming an inclination of 34 degrees, a (disc) inclination-attenuation correction of 0.25 mag (Driver et al. 2007). We have then used the typical -band flux ratio for Sd galaxies (, Graham & Worley 2008) to obtain a dust-corrected bulge magnitude of 14.24 -mag. At a distance of 4.3 Mpc, the absolute -band bulge magnitude is mag. To derive the bulge mass, we first derived a metallicity [Fe/H] = +0.2, using the 2MASS colour H-K = 0.25 and the RC3 colour B-V = 0.45. Assuming an age of 1-5 Gyr for the bulge, the associated B-band mass-to-light ratio ranges from 0.3 to 1.2. We have adopted the midpoint of 0.6, and acknowledge a factor of two uncertainty in this value.
The NC mass has been obtained assuming an -band mass-to-light ratio of 1.0, following NGC 4041, which has then been applied to the -band magnitude (Filippenko & Ho 2003). Using an array of methods, the BH mass for NGC 4395 is estimated to be (Filippenko & Ho 2003). We have adopted the value dex. We do however note that subsequent reverberation mapping estimates (Peterson et al. 2005) predicts a greater mass of .
NGC 1042: The Scd galaxy NGC 1042 has a NC (Böker et al. 2003), a bulge (Knapen et al. 2003) with a dust corrected magnitude of -mag (Graham & Worley 2008), and a BH (Seth et al. 2008, see also Shields et al. 2008). From the -band - relation in Graham (2007), the expected BH mass is , equal to the NC’s stellar mass (Walcher et al. 2005). However, a direct measurement of the BH mass is not known and so we do not include this system.
7.5 Additional galaxies
We have included 13 “core” galaxies to help illustrate/define the high-mass end of the various diagrams/relations. In particular, as already noted, we have used NGC 1399: the brightest cluster galaxy from Fornax. From a cursory inspection of the many HST-resolved surface brightness profiles available in the literature, one will discover several core galaxies that appear to be nucleated. However, one must distinguish between excess central flux from star clusters and the non-thermal emission from AGN. For example, Ravindranath et al. (2001) reveal a point source in NGC 4374, but this is a LINER Sy2 AGN. It is however noted here that, like NGC 1399, NGC 4649 displays a central -drop (Pinkey et al. 2003) which might be associated with a nuclear stellar cluster, but in any event the BH will dominate the central mass budget.
NGC 4552: While Faber et al. (1997) report neither severe nor moderate nucleation in the core galaxy NGC 4552, a small amount of excess flux within 0.1 may be apparent in the light profiles shown by Byun et al. (1996) and Carollo et al. (1997). Renzini et al. (1995) has however reported that the point source in this LINER Seyfert 2 galaxy is variable at UV wavelengths, and is therefore likely to be due to an AGN. We have however elected not to include this S0 galaxy (Caon et al. 1993) because an accurate spheroid mass is not availble.
IC 1459: Although Lauer et al. (2005) provide a -magnitude for the nucleus of IC 1459, the blue point source (Forbes et al. 1995; Tomita et al. 2000; Verdoes Kleijn et al. 2002) is a LINER associated with an AGN that has been detected in X-rays (Fabbiano et al. 2003). We have excluded this object, due to the the order of magnitude uncertainty on its BH mass (Cappellari et al. 2002).
NGC 2748: The apparent nuclear star cluster is due to dust (Hughes et al. 2005; Seigar et al. 2002).
M31 NGC 224, better known as Andromeda, has not been included because the nucleus is not a pressure supported star cluster in which the stars have random motions but is a rotationally supported nuclear disc.
| Object | Dist. | Magspheroid | Massspheroid | MagNC | MassNC | |||
|---|---|---|---|---|---|---|---|---|
| [Mpc] | [] | [mag] | [] | [mag] | [] | |||
| 1 | 2 | 3 | 4 | 5 | 6 | 7 | 8 | 9 |
| Systems with but no detectable NC | ||||||||
| NGC 3379 | 10.6 | [10] | -mag [35] | 1.0 | … | … | … | |
| NGC 3608 | 22.9 | [11] | -mag [35] | 1.0 | … | … | … | |
| NGC 4261 | 31.6 | [12] | -mag [35] | 1.0 | … | … | … | |
| NGC 4291 | 26.2 | [11] | -mag [35] | 1.0 | … | … | … | |
| NGC 4374 | 18.4 | [13] | -mag [35] | 1.0 | … | … | … | |
| NGC 4473 | 15.7 | [11] | -mag [35] | 1.0 | … | … | … | |
| NGC 4486 | 16.1 | [14] | -mag [35] | 1.0 | … | … | … | |
| NGC 4649 | 16.8 | [11] | -mag [35] | 1.0 | … | … | … | |
| NGC 5077 | 41.2 [1] | [15] | -mag [36] | 2.5 | … | … | … | |
| NGC 5813 | 32.2 | [16] | -mag [36] | 2.5 | … | … | … | |
| NGC 6251 | 105 [1] | [17] | -mag [35] | 1.0 | … | … | … | |
| NGC 7052 | 66.4 [1] | [18] | -mag [37] | 2.5 | … | … | … | |
| Systems with and a NC | ||||||||
| Milky Way | 0.008 | [19] | … | … | [46] | … | … | [49] |
| M32 | 0.8 | [20] | -mag [38] | 0.9 | -mag [38] | 0.75 | ||
| NGC 1023 | 11.4 | [21] | -mag [35] | 0.6 | -mag [21,41] | 2.5 | ||
| NGC 1399 | 20.0 | [22] | -mag [39] | 2.5 | -mag [47] | 2.5 | ||
| NGC 2778 | 22.9 | [11] | -mag [40] | 0.6 | -mag [38] | 1.5 | ||
| NGC 3115 | 9.7 | [23] | -mag [35] | 0.6 | -mag [41] | 2.5 | ||
| NGC 3384 | 11.6 | [11] | -mag [35] | 0.6 | -mag [48] | 0.6 | ||
| NGC 4026 | 13.6 | [24] | -mag [41] | 4.5 | -mag [41] | 2.0 | ||
| NGC 4395 | 4.3 [2] | [25] | -mag [37] | 0.6 | -mag [25] | 1.0 | ||
| NGC 4564 | 15.0 | [11] | -mag [40] | 0.6 | ? | ? | ? | |
| NGC 4697 | 11.7 | [11] | -mag [35] | 1.0 | -mag [38] | 2.5 | ||
| NGC 7457 | 13.2 | [11] | -mag [42] | 0.6 | -mag [42] | 0.4 | ||
| Systems with only an upper limit on but with a NC | ||||||||
| M33 | 0.8 [3] | [26] | -mag [37,38] | 1.1 | … | … | [50] | |
| NGC 205 | 0.82 [4] | [27] | -mag [43] | 2.7 [45] | … | … | [45] | |
| NGC 3621 | 6.6 | [28] | -mag [28] | 0.6 | … | … | [28] | |
| NGC 4041 | 23.3 [1] | [29] | -mag [37,38] | 0.6 | -mag [29] | 1.0 | ||
| VCC 1254 | 17.0 [5] | [30] | -mag [44] | 6.0 [30] | -mag [44] | 0.93 | ||
| Systems with less secure but with a NC | ||||||||
| G1 | 0.8 [6] | [31] | … | … | … | … | … | [51] |
| M15 | 0.01 [7] | [32] | … | … | … | … | … | [52] |
| MGG-11 | 3.6 [8] | [33] | … | … | … | … | … | [8] |
| Cen | 0.0048 [9] | [34] | … | … | … | … | … | [53] |
Column 1: In addition to galaxies, three globular clusters (G1, M15 and Cen) and one star cluster (MGG-11) are listed. Column 2: Distances have been taken from Tonry et al. (2001) unless otherwise noted. Column 3: BH masses have been adjusted to the distances shown in column 2. Column 4: Absolute magnitude of the host spheroid using the distances in column 2. Column 5: Stellar mass-to-light ratio (associated with the filter specified in column 4) used to obtain the stellar mass of the spheroid (Column 6). Column 7: Absolute magnitude of the nuclear star cluster (or globular cluster) using the distances in column 2. Column 8: Stellar mass-to-light ratio (associated with the filter specified in column 7) used to obtain the stellar mass of the cluster (Column 9).
References: 1 = NED (Virgo + GA + Shapley)-corrected Hubble Flow distance); 2 = Thim et al. (2004); 3 = Argon et al. (2004); 4 = McConnachie et al. (2005); 5 = Jerjen et al. (2004); 6 = the Tonry et al. (2001) distance to NGC 224 (M31) is used; 7 = Harris (1996); 8 = McCrady et al. (2003); 9 = van de Ven et al. (2006); 10 = Shapiro et al. (2006); 11 = Gebhardt et al. (2003); 12 = Ferrarese et al. (1996); 13 = Maciejewski & Binney (2001); 14 = Macchetto et al. (1997); 15 = De Francesco et al. (2008); 16 = Preliminary values determined by Hu (2008) from Conf. Proc. figures of Cappellari et al. (2008); 17 = Ferrarese & Ford (1999); 18 = van der Marel & van den Bosch (1998); 19 = Ghez et al. (2005); 20 = Verolme et al. (2002); 21 = Bower et al. (2001); 22 = Houghton et al. (2006), Gebhardt et al. (2007); 23 = Emsellem et al. (1999); 24 = Gültekin et al. (2009); 25 = Filippenko & Ho (2003); 26 = Merritt et al. (2001), Gebhardt et al. (2001); 27 = Jones et al. (1996), Valluri et al. (2005); 28 = Barth et al. (2008); 29 = Marconi et al. (2003): 30 = Geha et al. (2002); 31 = Gebhardt et al. (2005) but see Baumgardt et al. (2003b); 32 = Gerssen et al. (2003), van den Bosch et al. (2006) but see Baumgardt et al. (2003a) and Dull et al. (2003); 33 = Patruno et al. (2006); 34 = Noyola et al. (2008); 35 = Marconi & Hunt (2003); 36 = Rest et al. (2001); 37 = de Vaucouleurs et al. (1991, RC3); 38 = This paper; 39 = D’Onofrio et al. (1994); 40 = Graham & Driver’s (2007, their Section 4.2.1) bulge magnitude; 41 = Lauer et al. (2005, their table 8); 42 = Balcells et al. (2007); 43 = Mateo (1998); 44 = Geha et al. (2003); 45 = De Rijcke et al. (2006a); 46 = Cardone & Sereno (2005), Dwek et al. (1995); 47 = Lyubenova et al. (2008); 48 = Ravindranath et al. (2001); 49 = Launhardt et al. (2002); Schödel et al. (2007); 50 = Kormendy & McLure (1993); 51 = Baumgardt et al. (2003b); Ma et al. (2009); 52 = Dull et al. (1997); 53 = Meylan et al. (1995).