Magnetic properties of substitutional Mn in (110) GaAs surface and subsurface layers.
Abstract
Motivated by recent STM experiments, we present a theoretical study of the electronic and magnetic properties of the Mn-induced acceptor level obtained by substituting a single Ga atom in the (110) surface layer of GaAs or in one of the atoms layers below the surface. We employ a kinetic-exchange tight-binding model in which the relaxation of the (110) surface is taken into account. The acceptor wave function is strongly anisotropic in space and its detailed features depend on the depth of the sublayer in which the Mn atom is located. The local-density-of-states (LDOS) on the (110) surface associated with the acceptor level is more sensitive to the direction of the Mn magnetic moment when the Mn atom is located further below the surface. We show that the total magnetic anisotropy energy of the system is due almost entirely to the dependence of the acceptor level energy on Mn spin orientation, and that this quantity is strongly dependent on the depth of the Mn atom.
pacs:
PACS number2009 number number identifier Date text]date
LABEL:FirstPage101 LABEL:LastPage#1102
I Introduction
Cross sectional scanning tunneling microscopy (STM) is a sophisticated and extremely valuable nanoscience experimental tool. It enables, in particular, the manipulation and characterization of individual impurities in semiconductors and metals with unprecedented spatial resolution and electronic sensitivity. In the last few years this technique has been used to study the electronic and magnetic properties of individualYakunin et al. (2004) Mn atoms and Mn atom pairsYakunin et al. (2005a) in GaAs. Interest in these studies stems in part from the notion that investigating Mn dopants in GaAs at the atomic scale could lead to a better understanding of and better control over magnetism in diluted magnetic semiconductors (DMSs). Recently STM methods were used to substitute individual Ga atoms with Mn atoms in the first layer of a GaAs(110) surface.Kitchen et al. (2005, 2006) STM allowed experimentalists to visualize the electronic properties of the acceptor wavefunction bound to the Mn position, and to probe the valence-band-hole mediated exchange interactions between two Mn atoms.Kitchen et al. (2006) Apart from its possible relevance in probing the basic physics of DMSs, this experiment is a remarkable example of how STM techniques can now be employed to engineer novel nanomagnets with specifically designed quantum mechanical properties.
In Refs. [Kitchen et al., 2005, 2006] it was shown that both the Mn-induced (acceptor) in-gap state and the exchange interaction between Mn pairs are strongly anisotropic with respect to crystallographic orientation. A theoretical analysisKitchen et al. (2006) based on a tight-binding model of Mn atoms in bulk GaAsTang and Flatté (2004, 2005) reproduces some of these features qualitatively. Nevertheless, it seems clear that the proximity of the Mn atoms to the surface must have a significant impact on their properties. In fact, a more recent studyGarleff et al. (2008), in which individual Mn atoms were carefully positioned on the GaAs(110) surface and layer-by-layer on the first few layers below, showed that the reduced symmetry at the surface strongly modifies the wave function of the impurity. The acceptor wavefunction properties depend on the precise substitutional depth at which the impurity is located. This experimental conclusion is supported by a recent theoretical study.Jancu et al. (2008)
In this paper we present a theoretical study of individual Mn dopants substituting for Ga atoms in a GaAs(110) surface, or in one of atomic layers below the surface. Our aim is to provide a systematic analysis of how the electronic and magnetic properties of the acceptor wavefunction are modified by the presence of the surface as the Mn impurity is inserted into successively deeper layers, and compare with the limiting case of a Mn in bulk GaAs. In contrast to previous studiesJancu et al. (2008), we focus on the spin-orbit induced dependence of the acceptor wave function on the direction of the Mn magnetic moment orientation. We compare our surface-influenced results with the results of Ref. Tang and Flatté, 2005, in which the dependence of the acceptor wavefunction on the magnetic moment direction was studied for a Mn atom in bulk GaAs.
Our analysis is based on a microscopic tight-binding model, which accounts for the crucial relaxation of the GaAs(110) surface layer and for spin-orbit interactions in the valence band which play an essentialJunwirth et al. (2006) role in (Ga,Mn)As magnetism. We do not account explicitly for the Mn -orbitals, but account for hybridization instead by adding an effective exchange interaction between the Mn moment and valence band orbitals on nearest-neighbor As sites. We also include other interaction terms to account for the Coulomb repulsion of electrons by the Mn ion.
Our calculations show that the acceptor wavefunction is in general strongly anisotropic in space; the detailed anisotropy features depend very strongly on the sublayer in which the impurity is located, in agreement with experimentGarleff et al. (2008) and with previous calculations.Jancu et al. (2008) For a reasonable choice of the parameters of our model, we find that for a Mn located in the topmost layer or in the first subsurface layer, the acceptor state has a large binding energy and a strongly localized wavefunction with a very weak dependence on the Mn magnetic moment direction. As the impurity is inserted deeper beneath the surface, the acceptor wavefunction becomes progressively more delocalized and its dependence on the Mn moment orientation increases significantly. In particular, we find that the LDOS feature on the GaAs(110) surface due to the acceptor level, the quantity which is probed most directly by STM, is noticeably different between the cases of a magnetic moment pointing along the easy and hard magnetic directions when the impurity is located a few monolayers below the surface. This prediction could be tested in STM experiments in which the direction of the magnetic moment is manipulated with an external magnetic field. We also show that total magnetic anisotropy is related in a simple way to the magnetic anisotropy of the acceptor state and that the magnetic anisotropy landscape depends in a non trivial way on the sublayer in which the impurity is located.
Our paper is organized as follows. In Sec. II we give an explicit description of the model we use, explaining its tight-binding Hamiltonian and elaborating on other details necessary to understand our findings. In Sec. III we present the results of the model, starting in Sec. III.1 with the case of a single Mn substituted for Ga in bulk GaAs. We then proceed in Sec. III.2 to discuss a substitutional Mn in a surface layer, highlighting emerging features and relating these to experiment. Sec. III.3 is devoted to the study of the transition from surface to bulk, in which the Mn is placed in successively deeper sublayers below the surface. Finally, we present our conclusions and discuss the implications of our results in Sec. IV. The main text of this paper provides a detailed description of the Mn impurity at different depths below the surface layer of the host semi-conductor. Some readers may wish to begin by reading the summary and conclusion section, which gives a brief description of our main results, before exploring the main body of the paper.
II Theory
In a As III-V dilute magnetic semiconductor (DMS), the most energetically stable position for the Mn is a Ga atom site. This property can be understood as following from the atomic electronic structure of Mn, , with the electrons allowing for the formation of crystal bonds similar to those between the Ga () and the As () atoms of the host crystal. Because the Mn is missing the 4 valence electron of Ga, it acts as an acceptor. The Mn ion repels electrons and attracts a weakly bound hole, forming a neutral state.Kitchen et al. (2005); Yakunin et al. (2005b) Mn both generates the local magnetic moments (via the half-filled d-shell) and acts as a supplier of potentially itinerant holes that can mediate their coupling. Zener’s kinetic-exchange Zener (1951); Dietl et al. (2000); Junwirth et al. (2006) or indirect-exchange interaction applies to systems like (Ga,Mn)As in which local moments formed by the magnetic impurities are coupled via itinerant - or -band carriers.
Our study is based on tight-binding model with a Hamiltonian
| (1) |
that includes a kinetic exchange interaction between the local-moment and the band electrons. The kinetic-exchange model is appropriateJunwirth et al. (2006) when the Mn- to As- hopping amplitudes (see below) are smaller than the energetic separation between the -orbitals and the top of the valence band. The band term in Eq. 1 is given in terms of the Slater-Koster parametersSlater and Koster (1954); Papaconstatopoulos and Mehl (2003) for bulk GaAs.Chadi (1977)
| (2) |
Here, and are atomic indices, and and are orbital and spin indices, respectively. The are the Slater-Koster parameters that do not depend on spin. The only non-zero parameters are the on-site energies ( ) and the nearest neighbor hopping matrix elements for the , and orbitals.
Our model contains and electrons only, the -electrons of the Mn enter the model in the form of a Mn local moment with spin spin which we treat classically in this paper. This local magnetic moment is formed by the five -electrons of Mn that in the tetrahedral host results in bonding and antibonding - states in the formVogl and Baranowski (1985) of a triplet of -symmetry (-- and 3-like) and an occupied doublet of -symmetry (- and -like). The doublet couples only weakly to the host, and is split from the triplet by the tetrahedral crystal field. The triplet hybridizes with the connecting -orbitals and the weakly bound hole occupies one of the three - antibonding states at the top of the valence band, predominantly of As 4-character.Junwirth et al. (2006) The hybridization of the occupied Mn 3-electrons with the nearest neighbor As 4-electrons, cause the -states at the top of the valence band with spin parallel to the Mn spin to move up in energy relative those that are antiparallel, which hybridize with high-energy unoccupied -orbitals. The direct exchange interaction between holes at the top of the valence band and the Mn -electrons is weak, such that - hybridization dominates which results in an antiferromagnetic coupling.Bhattacharjee et al. (1983); Okabayashi et al. (1998) This physics is captured in the term of (1), which induces an exchange field on the nearest-neighbor As -electrons,
| (3) |
where eV is the approximate value of the exchange coupling constant inferred from Refs. [Timm and MacDonald, 2005] and [Ohno, 1998], and
| (4) |
where is the Pauli matrix vector. The first sum over in (3) runs over all Mn, and the second sum runs over all As that are nearest neighbors to Mn atom denoted by . Because the exchange field in this model influences only -electrons, the sum in (4) only runs over the three -orbitals. The valence band electronic structure depends on the classical Mn spin orientation (which we parametrized by polar and azimuthal angles) through the scalar product .
We approximate the spin-orbit coupling Hamiltonian by a local atomic one-body operator, in which the spin quantization axis is defined by :
| (5) |
where is an atomic index and denotes the renormalized spin-orbit splittingChadi (1977) for which we use the values meV, meV, and . The spin-orbit term causes the total energy of the system, as obtained by summing the energies of all occupied eigenstates, to depend on the magnetization direction parametrized by . Our procedure allows us to calculate the magnetic anisotropy landscape on the unit sphere and extract the magnetic anisotropy energy as . The polar coordinate system is defined such that corresponds to the [001] direction, and with and correspond to the [100] and the [010] directions respectively.
The presence of a negatively charged Mn ion attracts holes and repels electrons. We represent the spin-independent part of the effective potential due to Mn substitution by a long-range repulsive Coulomb part and a Mn central cell correction term,
| (6) |
The first term in (6) represents the long-range part, which is reduced by the host material dielectric constant To account crudely for weaker dielectric screening at the surface, the dielectric constant for a Mn on the surface is reduced to for the affected surface atoms. The correction term consists of on- and off-site parts, which influence the Mn ion and its nearest neighbors respectively. The on-site Coulomb correction is estimated to eV from the ionization energy of Mn. The off-site Coulomb correction affects all the nearest-neighbor As surrounding the Mn ion and together with (3) reflects primarily - hybridization physics. It is one of the most important parameters of the model and its value is set by tuning the position of the Mn-induced acceptor level in the bulk to the experimentally observed positionSchairer and Schmidt (1974); Lee and Anderson (1964); Chapman and Hutchinson (1967); Linnarsson et al. (1997) at 113 meV above the first valence band level. The value thus obtained is eV. In this picture, long-range Coulomb, exchange and correction interactions all play an important role in determining the character of Mn acceptor levels.
We model the electronic structure of GaAs with a single substitutional Mn by performing a super-cell type calculation with a cubic cluster of 3200 atoms and periodic boundary conditions in either 2 or 3 dimensions, depending on whether we are studying the surface or a bulk-like system. The surface of GaAs is simplified from both theoretical and experimental points of view, by the absence of large surface reconstruction. Relaxation of surface layer positions must nevertheless be included since it removes dangling-bond states that would otherwise obscure the band-gap. We follow the procedure outlined in Refs. [Chadi, 1978, 1979], in which atomic shifts as deep as the 2nd sublayer are taken into account.
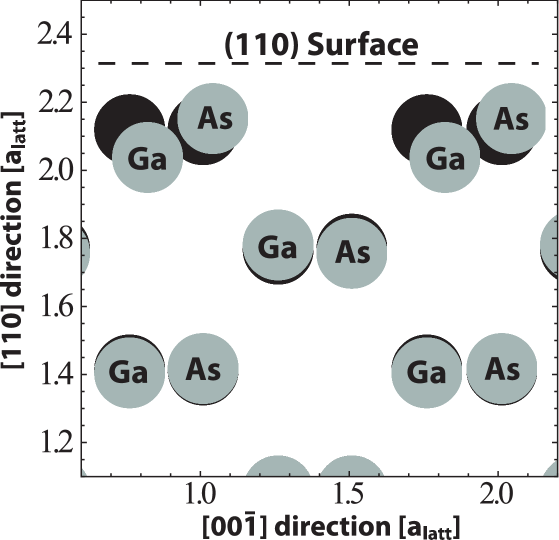
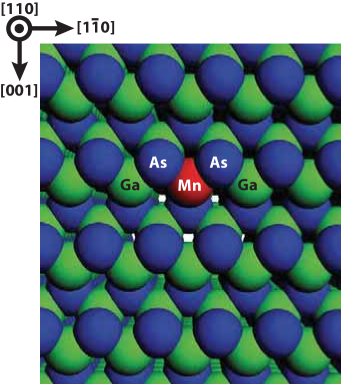
The resulting surface is summarized in Fig. 1 and the top layer and first subsurface layer are depicted in Fig. 2. The most salient feature is an up-shift of the surface As, accompanied by a down-shift of the surface Ga. Both species are shifted along the surface, such that the effective bond-angles change, which affects the direction cosines entering the Slater-Koster parametrization.Slater and Koster (1954) The tight-binding parameters scale like , where is the original distance and is the distance after the relaxation. The rescaling parameter is small and is at most
By projecting the eigenvector of the acceptor level onto surface sites obtained after diagonalizing the Hamiltonian , we can study the surface LDOS, which is intimately related to the topographic STM images.Garleff et al. (2008); Kitchen et al. (2006) In our cluster approach we sum the absolute square of the coefficients in the eigenvector corresponding to the LDOS on a given atom ,
| (7) | ||||
| (8) |
where is an eigenvalue index, and are atomic indices, and and denote orbital and spin respectively. In (7) projects out the LDOS of atom Similarly, we can define operators that project out the orbital and spin character for a given eigenlevel :
| (9) | ||||
| (10) |
The procedure we follow in generating LDOS plots is similar to the approach used by Tang et al. in Ref. Tang and Flatté, 2004. We place Gaussians on the atomic positions with a magnitude equal to the LDOS of that atom, and a full-width at half-maximum equal to half the nearest neighbor spacing. (This procedure mimics the finite spatial resolution of an STM tip). In all the LDOS plots the normalization is such that the sum of LDOS over all atoms in the cluster is unity for a single eigenlevel. When the STM is operating in constant current mode (see for example Ref. Wiesendanger, 1994), the tunneling current is maintained at a fixed value by varying the tip-surface distance. The exponential decay of the surface wavefunction causes the distance recorded to depend approximately logarithmically on the LDOS at the surface. We therefore employ a logarithmic color-scale in our images of the LDOS.
When imaging states in a semi-conductor band gap at a low bias, it is necessary to move the tip very close to the substrate surface. This means that interactions between the tip and the sample can cause a change in the surface wavefunction. In addition, many-body effects beyond those captured by the mean-field description of electronic states outlined above can be important in some cases. In particular, as detailed below, we find that acceptor levels for Mn very close to the surface lie deep in the gap. STM experiments provide a partial profile of the spatial distribution of added or removed electrons. When the acceptor is deep in the gap, addition or removal will cause a big change in the potential seen by other electrons. These various many-body effects are partly captured by our phenomenological model, but we cannot expect to find exact correspondence with the experimental images.
III Results
III.1 Single Mn in bulk GaAs
Our starting point is a single Mn in bulk, as represented in our model by placing it at the center of a cubic GaAs cluster of 3200 atoms and enforcing periodic boundary conditions. The dimensions of the cluster (in the crystalline directions ) used in all calculations are Å or in terms of atomic layers . Creating the supercell in the form of a cubic cluster defined by the limiting planes , and , enables us to apply periodic boundary conditions in two directions and study the (110) surface. The generated cluster can also be given periodic boundary conditions in all three directions to create a ’bulk’ system, which should simply be regarded as the fully periodic counterpart of the surface system.
The magnetic anisotropy energy for the fully periodic system as a function of the magnetization direction , is shown in Fig. 3. We find bistable minima and an easy axis parallel to the 001 direction, separated by a single barrier equal to meV. The anisotropy is very sensitive to the cubic symmetry and the particular easy direction 001 can be seen as a consequence of the supercell symmetry. The closest distance between Mn in adjacent supercells is 38 Å along the [110] and [11̄0] directions, along which the most prominent hopping path occurs via closely spaced As and Ga. The distance along the 4 other equivalent symmetry directions is much longer, resulting in the observed anisotropy. Scaling down the size of the supercell (and thereby increasing the effective Mn doping) to 1200 atoms yields an anisotropy of 8.8 meV, and the value increases further as the supercell size is decreased. We conclude from this calculation that the magnetic anisotropy of a single Mn in the bulk of an infinite crystal is much smaller than meV, and that, as far as magnetic anisotropy is concerned, the dilute isolated impurity limit is achieved only at Mn atom fractions much smaller than , and much smaller than what can be represented in this or any other supercell calculation.
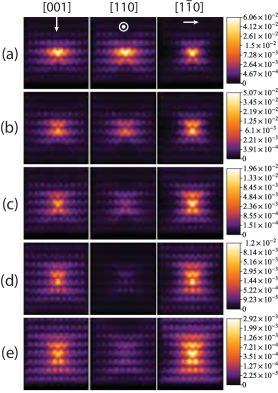
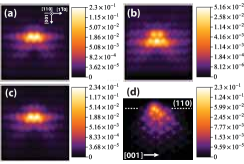
Fig. 4 shows plots of the LDOS of the acceptor level in the easy and hard directions. Similar results have been obtained previously by Tang et al. Garleff et al. (2008); Kitchen et al. (2006); Tang and Flatté (2004, 2005) using a similar tight-binding model. When the Mn spin is pointing in the easy direction [001], the wavefunction spreads out symmetrically along 110 and 11̄0. The spread along 110 is shown is shown in Fig. 4 (a)-(e) in the left column, in which cuts of successive (110) planes up to 4 layers away from the Mn plane are displayed. These images agree qualitatively with the results presented in Ref. Garleff et al., 2008, in which statistical methods and comparison with theory enabled the identification of the location of a particular single Mn down to the fourth sublayer. The center and the right column in Fig. 4 show the LDOS in successive (110) planes when the Mn spin is oriented in the 110 and 11̄0 hard directions respectively. The images show that the acceptor wavefunction exhibits a definite preference to spread out along the symmetry direction perpendicular to the Mn spin. In the center column of Fig. 4 it can be seen that the spread along the Mn spin direction [110] is very weak. By contrast, when the Mn spin is pointing in the 11̄0 direction, perpendicular to the (110) plane normal, the rightmost column of Fig. 4 reveals much higher values of the LDOS.
The cut of the Mn plane in the easy direction (Fig. 4 (a)) has 6% of the spectral weight of the acceptor wavefunction on the Mn atom, a total of 15.4% on the 4 nearest neighbors As and the rest is spread out in the lattice. These values correspond to a more spread out LDOS than the one obtained by Tang et al. in Ref. Tang and Flatté, 2004, who find 10% on the Mn and 20% on the 4 surrounding As. In both cases model parameters were adjusted to give the correct energetic position for the bulk Mn acceptor level. The difference in wavefunctions demonstrates that satisfying this criterion does not guarantee that the character of the acceptor level is correctly captured. In particular, accounting for the contribution to binding from longer ranged Coulomb interactions lead to more extended wavefunctions at a given acceptor energy. The observed correlation between spatial anisotropy and Mn spin direction agrees qualitatively with previous calculationsTang and Flatté (2005), in which a decrease of 90% in maximum spectral weight at the center of the (110) plane images is seen four layers away from the Mn (corresponding to Fig. 4 (e)), when the Mn spin changes from 11̄0 to [110], and a decrease of 15% when the Mn spin changes from 11̄0 to [001]. Comparing this with our results we find similar anisotropies. To begin with consider the anisotropy of the wavefunction at three layers away from the Mn (Fig. 4 (d)). Here the maximum LDOS in the (110) plane drops by 86% as the spin changes from 11̄0 to [110], and by 21% when the spin changes from 11̄0 to [001]. Looking at the next layer (Fig. 4 (e)), we note that this anisotropic effect decreases slightly, and we find that the maximum LDOS decreases by 74% when the spin direction is changed from 11̄0 to [110], and by 25% when it is changed from 11̄0 to [001]. The source of this difference in the behavior of the LDOS between odd and even layers away from the Mn, is that the odd layer maximum is on the As and the even layer maximum is on the Ga in the nearest neighbor hoping path along the [110]. This effect becomes pronounced three layers away from the Mn and higher. Although the actual percentages differ somewhat, the same strong anisotropic behavior of the acceptor wavefunction as in Ref. [Tang and Flatté, 2005] is observed. The strong dependence of the LDOS on Mn spin-orientation, combined with the weak magnetic anisotropy, implies that the observed LDOS should be strongly sensitive to external magnetic fields.
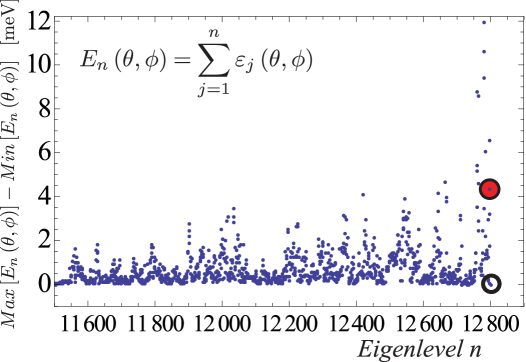
The anisotropy energy is formed by summing up the energies of all occupied levels, counting 4 electrons per Ga and As and 3 electrons per Mn. The spin-orbit induced level shifts vary with magnetization direction on the unit sphere and give rise to an anisotropic dependence of the total energy on the magnetization direction. Fig. 5 shows the anisotropy energy as obtained by successively summing eigenlevel anisotropy landscapes on the unit sphere, starting from the lowest level. It reveals fluctuations that persist far into the valence band. Fig. 5 illustrates the advantage of using a hole rather an electron picture in analyzing the anisotropy; the anisotropy built up by the shifts of many occupied levels, is retrieved by the single unoccupied acceptor level. This picture remains valid as long as the coupling to the conduction band is not sensitive to magnetization orientation. Quite generally we find that the anisotropy of the acceptor level and the systems total energy are accurately related by
| (11) |
This relation holds for several Mn in the system, subject to the same conditions. The single level should then be replaced with a sum over all acceptor levels. Because the number of occupied levels that contribute to the total anisotropy varies from case to case, the hole picture is invariably more useful in trying to understand trends.
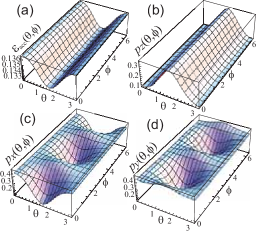
Fig. 5 shows that the anisotropy energy built up by all occupied levels (filled circle), is canceled by adding the anisotropy of the single acceptor level (empty circle). In Fig. 6 (a) the acceptor level variation as a function of magnetization direction is shown, and it can be seen that taking the negative of this reproduces the total energy variation shown in Fig. 3. The property observed in the LDOS images (see Fig. 4) that the acceptor wavefunction tends to spread out in a plane perpendicular to the Mn spin direction is reflected in the orbital character variation of the acceptor level. Fig. 6 (b)-(c) shows the orbital -character of the acceptor level, as obtained by using the projector (9). To illustrate this point, consider the Mn spin in the direction [001], defined by . Here, the -character of the acceptor wavefunction is lowest and the and characters are high, consistent with an acceptor wavefunction that is spreading out in the (001) plane. In the [100] direction, defined by and , the character is low and the and characters are high, as the wavefunction is spreading mainly in the (100) plane. A similar dip in the -character is found in the [010] direction. The sum of the and characters vary in an opposite manner to , such that which means that is constant along the line In the [110] hard direction where and , the wavefunction should extend mainly in the (110) plane, which can then be seen by approximately equal characters of and .
Because of the spin-orbit interaction, the levels do not have definite spin. The highest occupied level acquires a minority-spin component that varies between 6-8% while the acceptor has a much smaller minority spin component between 0.2-0.3%. The shallower the impurity level, the more minority-spin character is acquired; the second highest occupied level has larger minority spin character in the range 12-16%.
III.2 Single Mn in the (110) GaAs surface layer
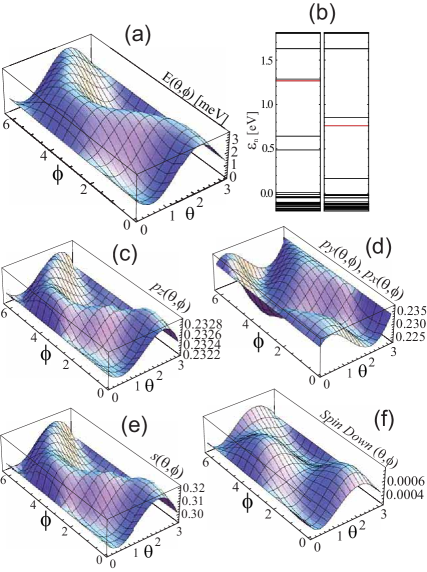
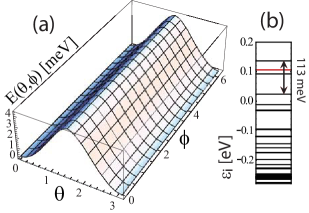
We now turn to the case of a single Mn in the surface layer which has three As nearest neighbors, two located on the surface – see Fig. 2. In the calculations we use the parameters in the Hamiltonian that were obtained by fixing the correct acceptor binding energy in bulk. The magnetic anisotropy landscape on the unit sphere is shown in Fig. 7 (a). At the surface, the anisotropy energy range is meV and the landscape has bistable minima and an easy axis at an approximate 45 angle to the surface, corresponding to the [111] direction. Fig. 7 (b) shows a portion of the eigenlevel spectrum. We find that the acceptor level of a surface Mn is very deep in the gap. The surface Mn acceptor level is not at all similar to its bulk counterpart, in sharp contrast with what has previously been assumed. The highest occupied level is also deep in the gap 12-19 meV below the acceptor level. The loss of coordination at the surface is primarily responsible for the much deeper state. A deep acceptor is also observed in experimentKitchen et al. (2006), where the curve reveals a broad resonance at 850 meV above the valence band edge. Our results imply that the acceptor at the surface can be categorized as an intrinsically deep state, although the exact position depends on the degree of - hybridization at the surface.
On the basis of generic considerations which recognize the reduced symmetry at the surface, one might have expected that the anisotropy would be highest at the surface. Due to the nature of the Mn interaction with neighboring As, we find that this is not the case. A high anisotropy requires a hole wavefunction that is more spread out in the lattice causing high variations in the orbital and spin character of the hole state. Fig. 7 (c)-(d) reveals variations in and orbital character of 1% and just a fraction of a percent in character. This is in turn connected with the LDOS of the hole that is more localized than bulk. Fig. 8 (a) shows the acceptor LDOS of the surface layer. The maximum spectral weight of 23.0% is not located on the Mn (which has 12.0% spectral weight), but rather on its 2 surface As nearest neighbors. The third As nearest neighbor in the sublayer has a much smaller spectral weight of 5.2%, which means that the core region of the Mn and its 3 neighbors contains a total of 63% spectral weight. The Ga atoms have a smaller maximum spectral weight of 6.1% for the top layer and 2.0% in the sublayer (see Fig. 8 (b)). Although the LDOS is highly localized, a similarity with the star-shaped symmetric images observed in the STM topographsGarleff et al. (2008); Kitchen et al. (2006) can be seen. The presence of Zn dopants in experimental samples might increase the coupling to conduction states, causing a more extended surface wavefunction. The surface and subsurface LDOS is similar in easy and hard magnetization directions; the changes in energy with magnetization direction are due to the changes in , and spin character on the same atoms.
The position of the acceptor state is sensitive to the off-site Coulomb correction. Setting this parameter to reproduce the experimental position gives an offsite Coulomb correction eV. The qualitative properties of the state does not change but the magnitude of the anisotropy drops to 0.87 meV as we move away from the conduction band and the gap between the highest occupied and the acceptor level increases. Fig. 8 (c) reveals that this state has a very similar acceptor surface LDOS. Our calculations indicate that the acceptor state for a single Mn on the (110) surface is a deep, highly localized state with a relatively low anisotropy. Precisely how deep and how localized this acceptor level is, is dependent on model parameters that we must choose phenomenologically. It is possible that the experimental surface Mn acceptor level binding energy quoted above could be inaccurate because of band-bending effects which could be present when performing STM on a semiconducting surface. Experimental studies of surface Mn in more heavily doped (Ga,Mn)As samples, in which band-bending effects are weaker could help settle this question.
We can understand the occurrence of the bistable minima approximately along [111] from Fig. 8 (d), which shows a maximal intensity projection from a side view of the Mn, along the [1̄10] direction. The presence of the surface, causes the wavefunction to spread out in the (111) plane down into the lattice. The star-like protrusions across rows observed in experiment are weak surface echoes of this spread. The maximal intensity projections are generated as follows. Instead of placing two dimensional Gaussians at the atomic sites (like in Fig. 8 (a)-(c)), we place a Gaussian sphere at each atomic site : . Here, the magnitude of the Gaussian is equal to the LDOS value of atom (as obtained from Eq. 7), and we choose the Gaussian smearing such that the full width at half maximum is equal to half the nearest neighbor distance. This generates a three dimensional LDOS view of the entire supercell cluster, with one color value corresponding to the LDOS for each point in space. The maximal intensity projection takes the maximum LDOS value along the viewers line of sight (in this case the [1̄10]) and projects it onto the viewing plane, i.e. the plane which is perpendicular to the viewers line of sight. In this way, we obtain an image which is not directly related to the STM images, but provides useful information on the LDOS below the surface.
III.3 Single Mn in subsurfaces layers of GaAs(110)
This subsection is devoted to the study of what happens when the Mn is successively moved down from the surface layer, toward the cluster center layer which best approximates the bulk.
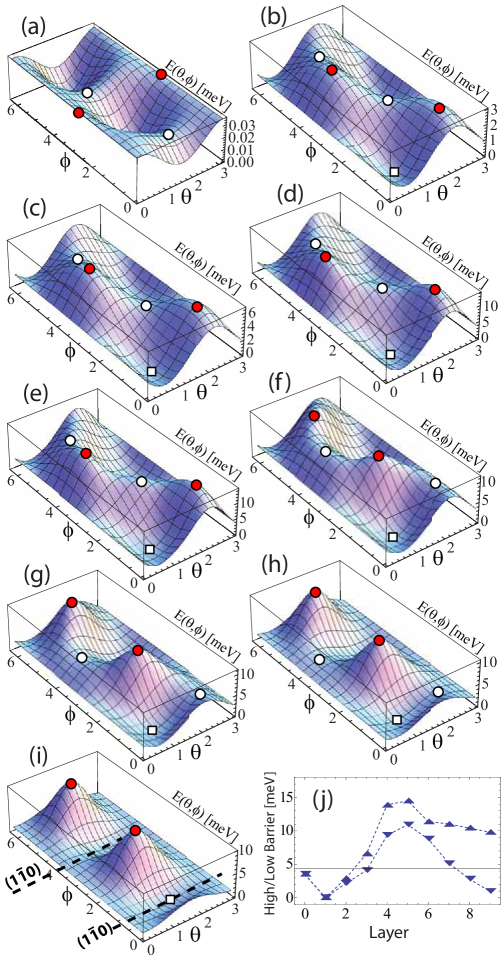
Fig. 9 shows how the anisotropy energy varies over the unit sphere with increasing depth, with panels (a)-(i) corresponding to sublayers 1-9. The subsurface Mn landscape in Fig. 9 (a) reveals an extremely low anisotropy energy of 30eV. As in the surface layer case, the small anisotropy can be traced to a very low variation in orbital character associated with a highly localized hole wavefunction. In the second sublayer (Fig. 9 (b)), the Mn produces an anisotropy landscape similar to that of the surface, but with high and low blocking barriers of 2.2-2.9 meV. In the successive layers, the high and the low barriers both increase and become larger than bulk, reaching a maximum of 14.5-10.9 meV in sublayer 5 (Fig. 9 (e)). In sublayer 6 (Fig. 9 (f)) the high and the low barrier have interchanged positions. The easy axis remains approximately along the [111] all the way down to sublayer 6 where it begins to shift towards the surface normal. The low barrier decreases towards the center and at the deepest layer of the slab the low barrier becomes so low that an approximate easy (11̄0) plane forms (see Fig. 9 (i) at ), opening up reversal paths connecting the two bistable minima. In the deepest sublayers the Mn spin can explore the plane with and any with a very low energy cost. This plane corresponds to (11̄0), which can then be classified as a quasi-easy plane. At the deepest levels, we still see traces of the now very shallow surface minima.
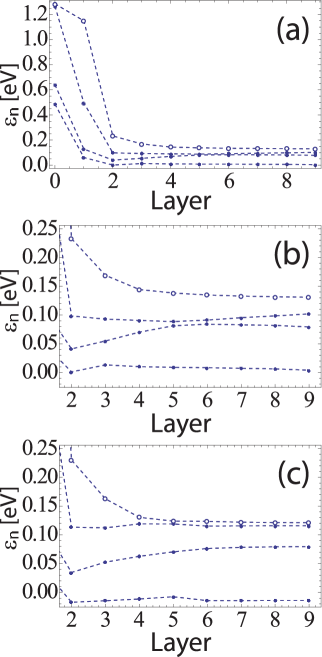
Fig. 10 (a) shows the evolution of the three highest occupied levels and the acceptor level as a function of Mn depth, when the Mn spin is pointing in the magnetic easy direction (marked by squares in Fig. 9). The acceptor abruptly drops down towards the valence band in sublayer 2 and then flattens out, converging at 125 meV above the first valence band level, corresponding to a slightly deeper acceptor than in bulk. In Fig. 10 close-ups of the same energy levels is shown in the easy (b) and hard (c) direction, respectively. The hard direction is given by the magnetization direction corresponding to the high barriers marked by a filled circle in Fig. 9.
The difference between the acceptor levels in the hard and easy direction is the spin-orbit induced total anisotropy energy. The maximal anisotropy in sublayer 5 corresponds to a very large variation in the gap between the highest occupied level and the acceptor of 5-50 meV between the hard and the easy direction. The two quasi-degenerate states are split by the spin-orbit shift. The easy direction is the direction in the which the gap caused by this shift, is maximized, leading to a decrease of the total energy of the system. A plot of the high and the low barrier as a function of sublayer depth is shown in Fig. 9 (j). From this figure we see the magnetic anisotropy energy is maximally enhanced in sublayer 5. This is due to the presence of the surface and has to do with the way the acceptor wavefunction extends around the Mn, as we move down through the layers.
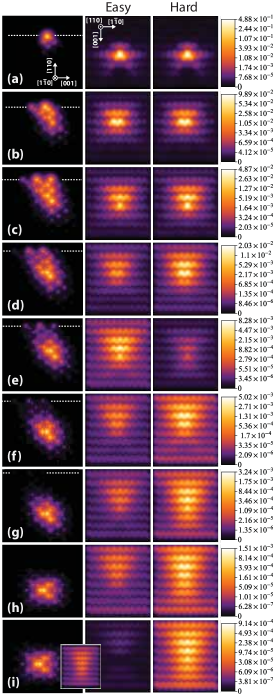
Fig. 11 shows how the LDOS in the (110) surface plane evolves as a function of the sublayer depth in the hard and easy direction respectively. This figure therefore relates directly to the window on acceptor level properties opened by STM experiments. The left column of Fig. 11 shows maximal intensity projections (see definition above) for the easy direction solution. This series of images gives a qualitative idea of where the main spectral weight of the acceptor wavefunction is located in relation to the surface (indicated by dashed line). We see that when the Mn impurity is close to the surface, the buckling has a large effect on its spatial extension. As the acceptor wavefunction detaches from the surface with increasing depth, the extension towards the surface becomes reduced and it begins to extend along [11̄0] (not shown in this sequence of images as the extension along [11̄0] is parallel to the line of sight).
The center and the right column of Fig. 11 shows the (110) surface LDOS when the Mn spin is pointing in the easy and hard direction, as depicted in Fig. 9. To begin with, we examine these images from a qualitative point of view. Starting from the case in which the Mn is inserted in the second sublayer or deeper (Fig. 11 (b)-(e)), the LDOS on the (110) surface displays a characteristic triangular shape with one vertex pointing down in the [001] direction. As the Mn is inserted into yet deeper layers, the triangular shape evolves into shape resembling a butterfly or bow-tie, with stronger upper wing. These features have been observed experimentallyGarleff et al. (2008); Jancu et al. (2008) and found in agreement with TB calculationsJancu et al. (2008) similar to ours. It is interesting to notice that for a Mn in bulk, calculated cross-section LDOS on (110) plane located atomic layers from the Mn shows a similar butterfly shape, but with a stronger lower wing.Jancu et al. (2008) Our calculations for bulk Mn shown in Fig. 4 displays a similar tendency – see in particular Fig. 4 (d)-(e). This symmetry reversal of the bow-tie shape with respect to the [001] direction for a Mn close to the surface has been ascribed to the intrinsic strain associated with the buckling relaxation.Jancu et al. (2008) The change of the Mn-induced LDOS from a triangular to a bow-tie shape as the impurity is inserted into deeper layers below the (110) surface occurs after sublayer 5, where the magnetic anisotropy landscape starts to develop a quasi-easy plane. The Mn spin is now free to explore the easy-plane (11̄0), with in more spectral weight in the [11̄0] direction in the Mn layer below the surface. We now proceed with a more quantitative evaluation of Fig. 11. The LDOS of the first sublayer (Fig. 11 (a)) is highly localized with a maximum spectral weight on the surface As of 50%. The Mn, one layer below, has only 8% spectral weight. The change in the LDOS with the Mn spin direction is minute and the resulting very low variations in orbital and spin character yield a low anisotropy energy. It is clear that the rising anisotropy in sublayer 2 and below is associated with a generally more spread out acceptor wavefunction. In sublayer 2 (Fig. 11 (b)), the hole is now much more spread out than at the surface and subsurface, and it shows that a large part of the extended spectral weight lodges at the surface. In sublayer 1 and 2 there is little change between the hard and easy direction, and in sublayer 3 and 4 the maximum spectral weight going from the hard to the easy direction, decreases by 14% and 33%. In sublayer 5 (Fig. 11 (e)), where the maximum anisotropy energy is reached, the easy direction surface LDOS instead becomes more pronounced and the maximum LDOS decreases by 60% from the easy to the hard direction. There is clearly something special about sublayer 5, where the surface has a high impact on the anisotropic extensions of the acceptor wavefunction. In addition to the large change in magnitude between the hard and easy directions when the Mn is in this particular layer, the surface LDOS begins to show a qualitative change. In sublayer 6 (Fig. 11 (f)), at which the high and low barriers are first interchanged, the wavefunction again shows a stronger surface LDOS in the hard direction. As we move further below the surface, the LDOS maximum decreases by around 40% as the Mn spin reorients from the hard to the easy direction. At the deepest level in sublayer 9 (Fig. 11 (i)) the quasi-easy (11̄0) plane has formed, and the surface LDOS maximum abruptly drops 82% between the hard and easy direction. The general trend in acceptor wavefunction character as layer depth is increased is that the surface LDOS is decreases and extends more along the [11̄0] direction, running below the surface.
Although the surface LDOS is biased on the [001̄] side of the Mn, the patterns are consistent with the fact that the wavefunction tends to extend along directions perpendicular to the Mn spin. In the hard directions (where the Mn spin is in the [111̄] or the [11̄0]), we therefore consistently see more spectral weight on the [001] side of the Mn relative the easy direction LDOS, and a more pronounced bow-tie like pattern. For the deeper levels where the low barrier has dropped significantly, thermal and quantum fluctuations, as well as Mn-Mn interactions in the sample can cause the Mn spin to fluctuate in the (11̄0) plane, such that the bow-tie shape becomes more pronounced. The small inset in Fig. 11 (i) shows the LDOS at the surface when the Mn spin is in the [001] direction, which has the familiar slightly asymmetric bow-tie shape. This solution is very close in energy to the easy direction, only 1 meV higher. For deep impurities, the wavefunction is essentially dominated by the subsurface extension along the [11̄0], such that the Mn spin can move across the low barrier in the (11̄0) plane. Comparing with the fully periodic system, where the wavefunction extends equally along the [11̄0] and the [110] in the ground state, we see that the effect of the surface on the deep impurities is to reduce the extension along the surface normal, such that reversal paths open up in the single barrier for bulk (see Fig. 3). It is also noteworthy that in sublayer 5, the low and the high barrier has not yet interchanged, but are comparable in energy. The LDOS at the surface when the Mn spin is pointing in the direction of the lower barrier is larger than the LDOS in the easy direction, then following the same qualitative pattern as all the other depths. This indicates that the wavefunction is very sensitive to the level dynamics as the gap between the highest occupied and the acceptor level closes in. The odd behavior of sublayer 5 is associated with a quasi-degeneracy between the highest occupied and the acceptor level, as indicated by the large variations 5-50 meV of the gap between them (see Fig. 10). This sensitive situation, causes a large total amount of spectral weight to be shifted on and off the surface between the hard and easy direction, such that large variations in orbital and spin character occur, yielding the high anisotropy.
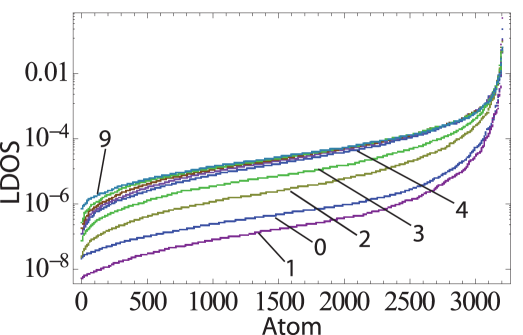
In Fig. 12 the acceptor level LDOS values on all 3200 atoms are sorted in size and then plotted on a logarithmic scale. Note that what is shown is not a continuous curve illustrating a parameter dependence but 3200 closely spaced points, one for each atom. The reason that the values have been sorted in size is that we are only interested in the possible magnitudes of the atomic LDOS here. There is no spatial information in this plot, but it shows how the LDOS magnitides are spread over the population of atoms. The sum of the LDOS values is normalized to unity. This plot demonstrates that an increased depth of the Mn is associated with a delocalization of the acceptor wavefunction, which manifests itself as a large population of atoms with increased spectral weight. As the Mn depth increases a large population of atoms emerges with approximately 2-3 orders of magnitude larger LDOS relative the highly localized surface set. The surface (marked 0) and the first sublayer (marked 1) exhibit similar distributions, with a localized signature and a larger spectral weight in the very narrow high end limit on the far right. For the surface and subsurface, the bulk of the spectral weight is located in close vicinity to the Mn, which results in a large population of atoms with a much lower LDOS in the range . For sublayer 3 and deeper, the majority of atoms show increased weight in the approximate range . This large population represents atoms farther away from the Mn core region, which means that the acceptor wavefunction is becoming much more extended away from the surface.
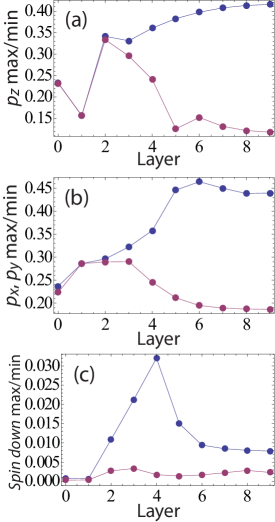
The spatial spread of the acceptor wavefunction is connected with the variations in orbital and spin character. Fig. 13 shows the maximum and minimum orbital and spin down character on the unit sphere of the Mn magnetic moment directions as a function of Mn depth for the acceptor level. Layer 0 (the surface) and layer 1 (the subsurface) show little variation. The difference between maximum and minimum orbital character rapidly increases from sublayer 3 and reach high values in sublayer 5 and 6, where the anisotropy energy is also large. As we move further down, the orbital -characters level out towards a 25% maximum and minimum difference. As can be seen in Fig. 10 the acceptor level comes very close to the highest occupied level in sublayer 5, leading to a quasi-degeneracy between these two levels in the hard direction. This leads to a large anisotropy energy, as the quasi-degeneracy is lifted and the total energy lowered, when the Mn spin is pointing in the easy direction. Associated with this quasi-degeneracy, is a mixing of the two levels and a change in the nature of the acceptor wavefunction. This change manifests itself as large fluctuations in orbital and spin character of the wavefunction in sublayer 5, as can be seen in Fig. 13. The quasi-degeneracy between the acceptor and highest occupied level in sublayer 6, is also related to the change in orbital and spin character responsible for the interchange of the high and low barriers as we go from sublayer 5 to 6 (see Fig. 9 (e-f)). The spin-down character variation (Fig. 13 (c)) increases steeply in sublayer 2 and reaches a maximum in sublayer 4, after which the difference drops quickly towards 5%. The anisotropy is also quite high in sublayer 4, but the orbital character variations are not as large as in sublayers 5 and 6. However, looking at the variations in spin-down character, we see that there is a sharp maximum on sublayer 4. This points to the crucial impact of small spin character fluctuations of the acceptor level on the magnetic anisotropy energy.
Fig. 12 and 13 show that the acceptor wavefunction delocalizes with depth, leading to larger variations in orbital and spin character as the spread increases. Because of the surface, the variations in spin and orbital character are related to the geometry of the system that is responsible for redistribution of the LDOS between the hard and easy directions. The total redistribution is very large for the maximal anisotropy layer, essentially depleting the surface LDOS in the hard direction to the advantage of the LDOS in the easy direction.
IV Summary and Conclusions
We have undertaken a study of the properties of a single Mn embedded in a large 3200 atom GaAs matrix. Our model is based on a kinetic-exchange tight-binding Hamiltonian that accounts for the polarization of the As -electrons nearest neighbors of a Mn spin via an off-site exchange term, and includes the local atomic spin-orbit interaction as well as the Coulomb field from the Mn ion. The relaxation of the (110) surface was taken into account since it plays an essential roleKitchen et al. (2006); Garleff et al. (2008) in the (110) surface electronic structure.
In agreement with previous calculationsTang and Flatté (2005) we find that the acceptor wavefunction is generally highly dependent on the Mn spin direction. An exception occurs for the cases of surface and subsurface layer Mn spin locations, for which we find a highly localized acceptor wavefunction that does not spatially redistribute as the Mn spin changes direction. We find, in particular, that a single Mn in the (110) surface produces a highly localized acceptor-level wavefunction and that the level lodges deep in the gap due to the loss of coordination at the surface. A deep acceptor level at the surface is also found in experimentKitchen et al. (2006), although uncertainly about band-bending effects has been responsible for some confusion as to its energetic position. The anisotropy of the surface state is relatively low, as expected for a deep-gap state. The actual depth of this state in our model depends sensitively on a purely phenomenological parameter in our calculation, the off-site Coulomb correction, which needs to be reduced relative to its bulk value in order to reproduce the experimentally observed position in the gap.
The acceptor level spatial structure is probed experimentally via the LDOS contributions to the surface layer. As the Mn is placed in deeper subsurface layers, the surface LDOS first displays a triangular pattern, which then evolves into an asymmetric butterfly or bow-tie shape when the Mn is located still further from the surface. This finding is in qualitative agreement with experiment.Garleff et al. (2008); Jancu et al. (2008) We find in addition that the anisotropy energy grows with depth, as the acceptor wavefunction becomes more extended. The magnetic anisotropy easy direction is strongly affected by the surface, and we find that its presence tends to favor [111] as an approximate easy direction. The observed easy axis is associated with a tilt of the wavefunction due to the up and down shift of the surface As and Ga atoms. This symmetry is responsible for the triangular pattern on one side of the Mn and persists to deep layers, after which the Mn spin becomes more free to move across the surface normal. By comparing a three-dimensionally periodic calculation with the corresponding wide surface slab calculations, we see that for the deeper Mn, the effect of the surface is to open up additional reversal paths in the bulk Mn impurity’s single-barrier magnetic anisotropy landscape. This is because at the deepest layers, the ground state solution yields an acceptor wavefunction that is suppressed along the surface normal [110], relative to the fully periodic system. The deep layer wavefunction extends instead most strongly along the [11̄0] direction, such that a quasi-easy [11̄0] plane is formed. A strong magnetically and spatially anisotropic state is found in sublayer 5, where a quasi-degeneracy between the acceptor and highest occupied level leads to a large anisotropy energy and a large shift of the LDOS at the surface between hard and easy directions.
Our predictions can in principle be checked experimentally by manipulating the Mn magnetic moment direction with an external magnetic field. As a function of the Mn depth, effects could be visible as early as the third sublayer, where our calculations indicate that the surface-layer LDOS for magnetization along the [111̄] hard direction should be larger than the surface layer LDOS when the magnetization is along the easy direction [111]. In sublayer 3 and 4 the maximum LDOS decreases by 14% and 33% from the hard to the easy direction. The acceptor level becomes increasingly shallow with increasing Mn layer depth and approaches the valence band in sublayer 5. We observe a strong signature in sublayer 5. At this point the surface-layer LDOS is instead larger for magnetization along the easy direction, with a 60% decrease in maximum LDOS from the easy to the hard direction. It should be noted however, that this situation depends very sensitively on the local environment since this signature is associated with a quasi-degeneracy between the highest occupied level and the acceptor level. For instance, increased Mn doping can affect the layer index at which this change occurs. In sublayer 6, the high and the low barriers have interchanged, with the high barrier now in the [11̄0] direction parallel to the surface. At this point the easy direction is still approximately the [111], but it then moves towards [110] with further increased depth. In addition to a large 40% decrease in the maximum LDOS from the hard to the easy direction, our calculations indicate that a more symmetric bow-tie shape appears in the hard direction for layer 6 and deeper.
The Mn spin-orientation can be influenced by thermal and quantum fluctuations as well as by external magnetic fields. We will address the influence of quantum fluctuations in a subsequent publication, and comment here only on the interplay between external fields and thermal fluctuations. At temperatures higher than the anisotropy energy the Mn spin orientation will be randomized by interactions with its thermal bath. The measured surface-layer LDOS should then correspond to an average of the results obtained here for particular orientations. At low-temperatures thermal fluctuations become unimportant and the magnetization orientation will depend on a competition between Zeeman coupling and magnetic anisotropy. As we have explained, the surface-layer LDOS pattern provides an indirect fingerprint of the magnetization orientation. Our experimental predictions for the depth dependence of magnetic anisotropy can be tested by identifying the Zeeman-coupling strength required to change the surface-layer LDOS. For example we predict that for Mn in deeper layers there are high magnetic barriers of the order 10 meV, which implies that large magnetic fields are required to reorient the Mn spin to the hard directions. These high barriers for a single Mn suggests that it might be possible to engineer few-atom substitutional Mn impurity clusters near the GaAs surface which act like nanomagnets with attractively large magnetic blocking temperatures.
V Acknowledgments
This work was supported by the National Science Foundation under grant DMR-0606489, the Faculty of Natural Sciences at Kalmar University, the Swedish Research Council under Grant No: 621-2004-4439, and by the Office of Naval Research under grant N00014-02-1-0813. We would like to thank A. Yazdani, P. M. Koenraad, J. K. Garleff, A. P. Wijnheijmer and C. F. Hirjibehedin for useful discussions.
References
- Yakunin et al. (2004) A. M. Yakunin, A. Y. Silov, P. M. Koenraad, W. V. Roy, J. D. Boeck, J.-M. Tang, and M. E. Flatté, Phys. Rev. Lett 92, 216806 (2004).
- Yakunin et al. (2005a) A. M. Yakunin, A. Y. Silov, P. M. Koenraad, J.-M. Tang, M. E. Flatté, W. V. Roy, J. D. Boeck, and J. H. Wolter, Phys. Rev. Lett 95, 256402 (2005a).
- Kitchen et al. (2005) D. Kitchen, A. Richardella, and A. Yazdani, J. Supercond. 18, 23 (2005).
- Kitchen et al. (2006) D. Kitchen, A. Richardella, J.-M. Tang, M. E. Flatté, and A. Yazdani, Nature 442, 436 (2006).
- Tang and Flatté (2004) J.-M. Tang and M. E. Flatté, Phys. Rev. Lett. 92, 047201 (2004).
- Tang and Flatté (2005) J.-M. Tang and M. E. Flatté, Phys. Rev. B 72, 161315 (2005).
- Garleff et al. (2008) J. K. Garleff, C. Çelebi, W. van Roy, J.-M. Tang, M. E. Flatté, and P. M. Koenraad, Phys. Rev. B 78, 075313 (2008).
- Jancu et al. (2008) J. M. Jancu, J. C. Girard, M. O. Nestoklon, A. Lemaitre, F. Gilas, Z. Z. Wang, and P. Voisin, Phys. Rev. Lett. 101, 196801 (2008).
- Junwirth et al. (2006) T. Junwirth, J. Sinova, J. Masek, J. Kucera, and A. H. MacDonald, Rev. Mod. Phys. 78, 809 (2006).
- Yakunin et al. (2005b) A. M. Yakunin, A. Y. Silov, P. M. Koenraad, W. V. Roy, J. D. Boeck, and J. H. Wolter, Physica E 21, 947 (2005b).
- Zener (1951) C. Zener, Phys. Rev. 81, 440 (1951).
- Dietl et al. (2000) T. Dietl, H. Ohno, F. Matsukura, J. Cibert, and D. Ferrand, Science 287, 1019 (2000).
- Slater and Koster (1954) J. C. Slater and G. F. Koster, Phys. Rev. 94, 1498 (1954).
- Papaconstatopoulos and Mehl (2003) D. A. Papaconstatopoulos and M. J. Mehl, J. Phys.: Cond. Mat. 15, 413 (2003).
- Chadi (1977) D. J. Chadi, Phys. Rev. B 16, 790 (1977).
- Vogl and Baranowski (1985) P. Vogl and J. M. Baranowski, Acta Phys. Pol. A 67, 133 (1985).
- Bhattacharjee et al. (1983) A. Bhattacharjee, G. Fishman, and B. Coqblin, Physica B+C 117, 449 (1983).
- Okabayashi et al. (1998) J. Okabayashi, A. Kimura, O. Rader, T. Mizokawa, A. Fujimoro, T. Hayashi, and M. Tanaka, Phys. Rev. B 58, 4211 (1998).
- Timm and MacDonald (2005) C. Timm and A. H. MacDonald, Phys. Rev. B 71, 155206 (2005).
- Ohno (1998) H. Ohno, Science 291, 951 (1998).
- Schairer and Schmidt (1974) W. Schairer and M. Schmidt, Phys. Rev. B 10, 2501 (1974).
- Lee and Anderson (1964) T. Lee and W. W. Anderson, Solid State Commun. 2, 265 (1964).
- Chapman and Hutchinson (1967) R. A. Chapman and W. G. Hutchinson, Phys. Rev. Lett. 18, 443 (1967).
- Linnarsson et al. (1997) M. Linnarsson, E. Janzen, B. Monemar, M. Kleverman, and A. Thilderkvist, Phys. Rev. B 55, 6938 (1997).
- Chadi (1978) D. J. Chadi, Phys. Rev. Lett. 41, 1062 (1978).
- Chadi (1979) D. J. Chadi, Phys. Rev. B 19, 2074 (1979).
- Wiesendanger (1994) R. Wiesendanger, Scanning probe microscopy and spectroscopy (Cambridge university press, 1994).