photometry and proper motion analysis of NGC~6253 and the surrounding field. ††thanks: Based on observation made at the European Southern Observatory, La Silla, Chile and at the Anglo-Australian Observatory, Siding Spring, Australia. The catalog presented in this paper is only available in electronic form at the CDS via anonymous ftp to cdsarc.u-strasbg.fr (130.79.128.5) or via http://cdsweb.u-strasbg.fr/cgi-bin/qcat?J/A+A/ .
Abstract
Context. We present a photometric and astrometric catalog of stars located in the field around the old super-metal-rich Galactic open cluster NGC~6253. The total field-of-view covered by the catalog is . In this field, we provide CCD photometry. For a smaller region close to the cluster’s center, we also provide near-infrared photometry.
Aims. We analyze the properties of NGC~6253 by using our new photometric data and astrometric membership.
Methods. In June 2004, we targeted the cluster during a day multi-site campaign, which involved the MPG/ESO m telescope with its wide-field imager and the Anglo-Australian m telescope, equipped with the IRIS2 near-infrared imager. Archival CCD images of NGC~6253 were used to derive relative proper motions and to calculate the cluster membership probabilities.
Results. We have refined the cluster’s fundamental parameters, deriving , , , , and . The color excess ratios obtained using both the optical and near infrared colors indicate a normal reddening law in the direction of NGC~6253. The age of NGC~6253 at 3.5 Gyr, determined from our best-fitting isochrone appears to be slightly older than the previous estimates. Finally, we estimated the binary fraction among the cluster members to be and identified blue straggler candidates.
Key Words.:
open cluster: NGC 6253 – CMD – Techniques: photometry, astrometry, proper motions1 Introduction
Studies of old Galactic open clusters at a range of different ages, metallicities, and spatial location in the disk are fundamental for understanding the formation and chemical/dynamical evolution of the Galactic disk since its early assembly (Janes et al. 1994, Friel et al. 2002, Bragaglia & Tosi 2006). As groups of stars sharing common metal abundance, age, and distance, the star clusters are ideal tracers because some of their fundamental parameters can be derived on statistical basis.
Over the years most attention has been dedicated to the solar neighborhood, where the properties of open clusters can be considered relatively complete for up to 1 kpc from the Sun (Piskunov et al. 2006). The open clusters in the direction of Galactic center and anticenter are, however, poorly studied. Recent attempts by Yong et al. (2005) and Carraro et al. (2007) seem to indicate that the age-metallicity relationship and the radial abundance gradient toward the Galactic anticenter do not deviate substantially from that in the solar neighborhood. The Galactic region inside the solar ring is more difficult to study because the interstellar absorption is stronger and the higher-density stellar environments shorten the cluster survival time. Nevertheless, a few open clusters of unexpectedly old age have been detected toward the Galactic center (Carraro et al. 2005a, 2005b), which allows to extend the baseline for the Galactic radial abundance gradient studies by up to 2-3 kpc in the bulge direction, once the metal abundances are measured.
The two old and extremely metal-rich open clusters, NGC~6791 and NGC~6253, also located in the inner Galaxy, have been studied relatively extensively. Such metal rich clusters are more likely to harbor extrasolar planets, following the well-established correlation between the frequency of giant planets and the metallicity of a host star (e.g., Valenti & Fischer 2008). Searching for extrasolar planets in metal-rich open clusters should thus increase the probability of planetary detection, allowing us to study the planetary formation and evolution processes among the stars that share well-defined common properties. Although photometric monitoring using the transit techniques has yet to produced bona fide extrasolar planets in open clusters, these observations have provided constraints on the expected frequency of extrasolar planets (e.g., Hartman, et al. 2008, Aigrain et al. 2007, Weldrake et al. 2005, Street et al. 2003, Burke et al. 2006, Mochejska et al. 2006).
In 2002 we started a project to search for transiting planets in metal-rich open clusters. First, we focused our attention on NGC~6791, the most populous, metal-rich open cluster known in our Galaxy (Montalto et al. 2007, De Marchi et al. 2007). This ten consecutive night monitoring of NGC~6791 produced the null-detection of transits (Montalto et al. 2007). Then, we chose the other metal-rich open cluster, NGC~6253 (, , ), for planetary transit searches. We obtained photometric data in seven photometric bandpasses, ranging from optical to near-infrared filters, during a days multi-site campaign at the MPG/ESO m telescope (La Silla, Chile) and at the Anglo-Australian m telescope (Siding Spring) in June 2004. This represents the largest photometric dataset obtained for this cluster as shown in Table1. We compare our results with those obtained from past photometric and spectroscopic studies of this cluster.
To date, NGC~6253 has already been studied photometrically by five groups: Bragaglia et al. (bragaglia97 (1997)), Piatti et al. (piatti98 (1998)), Sagar, Munari, & de Boer (sagar01 (2001)), Twarog, Anthony-Twarog & De Lee (twarog03 (2003)), Anthony-Twarog, Twarog, & Mayer (2007), hereafter referred to as BR, PI, SA, TW, and AT, respectively. Another three studies by Carretta et al. (2000), Carretta, Bragaglia & Gratton (2007), and Sestito et al. (2007), (hereafter referred to as CA1, CA2, and SE) have primarily established the super-high metallicity of NGC~6253 from high-resolution spectroscopy. A summary of the derived fundamental parameters from these studies is given in Table 1. The basic parameters of NGC~6253 show a rather wide spread from study to study, suggesting the following mean parameters: reddening =0.2, true distance modulus =10.9, metallicity [Fe/H]= dex, age 3 Gyr. In addition, from CA1, CA2, and SE papers we estimate the mean heliocentric radial velocity of NGC~6253 to be at km s-1, with the large 4 km s-1 rms scatter.
Being projected against the Galactic Bulge area, this cluster is highly contaminated by field stars. This limits substantially the accuracy of derived cluster parameters, therefore one of our tasks was to obtain proper motions and calculate reliable cluster membership probabilities. The kinematic data then allow to isolate the cluster members in color-magnitude diagrams and improve the analysis of cluster parameters. Our primary motivation of this study was to assist the search for transiting planets and its subsequent analysis. We plan to report on the results of our transit search campaign and variability studies in the forthcoming papers.
This paper is organized as follows: in Sec. 2 we describe the observational material; in Sec. 3 we give a detailed description of reductions and calibrations. Comparison of our new photometry with the previous photometric studies is discussed in Sec. 4. The astrometric calibration is presented in Sec. 5. Proper motions and cluster membership analysis are discussed in Sec. 6, while the resulting color-magnitude diagrams are presented in Sec. 7.
| Source | Age (Gyr) | [Fe/H] | Aperture (m) | ||
|---|---|---|---|---|---|
| BR | – | ||||
| PI | |||||
| SA | |||||
| TW | – | – | 111uno | ||
| AT | |||||
| CA1 | |||||
| CA2 | |||||
| SE | |||||
| 1 The low estimate is based on isochrone fit, the high estimate is from the analysis of photometric indices. | |||||
2 Observations
2.1 La Silla
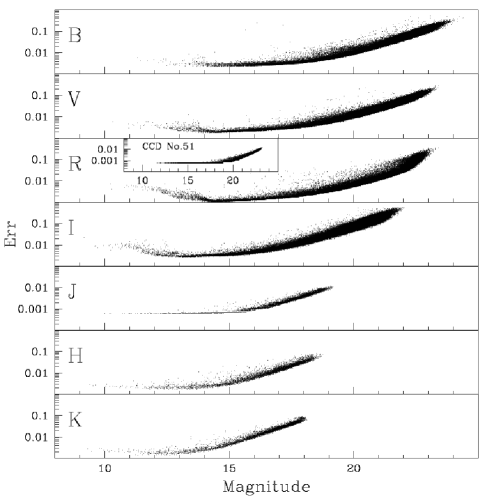
A total of ten consecutive nights, from June to June 23, 2005 at the MPG/ESO 2.2m telescope, were dedicated completely to the observations of NGC 6253. We used the wide field imager (WFI) which consists of a mosaic of eight CCDs , providing a field-of-view of . The pixel scale of WFI is arcsec pixel-1. The cluster was centered on CCD No. 51, according to WFI nomenclature. In total, we used 45.3 observational hours for NGC~6253, mainly in the filter. We also acquired the CCD images of NGC~6253 in filters along with the photometric standards (Landolt 1992). The total number of CCD images with the cluster 918.
During the 10-day observing run the seeing (as measured directly from our images) ranged between to with the mean seeing at (Table 2). On average, there was a trend of the worsening seeing with time over the entire observing run. To maintain the same S/N ratio, the exposure time was adjusted accordingly, if the seeing deteriorated. Bearing in mind the goal of obtaining high precision photometry for searches of extrasolar planetary transits and stellar variability, we always kept the stars at the fixed pixel positions, in order to minimize the flat-fielding errors. More details about our La Silla observing runs are given in Table 2, Table 3. In Table 2, we present the observations in band. Each night is indicated by a Roman numeral in the first column. The following columns indicate: the starting and ending UT times of observation, the number of observing hours calculated as a sum of all exposure times, the mean seeing measured from the images and its standard deviation in parenthesis, the range of exposure times and the total number of collected images (N.imm.). In Table 3, we present the observations acquired in , and bands. The night of observation is indicated in the first column and in the following we show the number of images obtained and their exposure times for each filter.
2.2 Siding Spring
A total of 10 observing nights for this program were also allocated at the Anglo-Australian 3.9m Telescope (AAT), essentially concurrent with La Silla observations. Originally, the observations were scheduled with the wide field imager but because of a detector failure we decided to use the IRIS2 infrared detector instead. This is a detector with a micron pixels, a field-of-view of and a arcsec pixel-1 scale. Due to the inclement weather and scheduling problems, only three nights were used to obtain the cluster images in filter (Table 4). A total of 60 images in and filters were obtained during the last night (number IX). The seeing varied from 1.7 to 1.1 arcsec in the band, as measured directly from our images.
The image acquisition strategy was different for Siding Spring. Because of variable background for the IRIS2 detector, following each 10 cluster images it was necessary to acquire a field image, in order to correct for this effect. Also, the exposure time for NGC~6253 was always fixed at s (apart for a few short exposure images). In addition, frequent shifts between the field and the cluster deteriorated the precision of the telescope’s pointing and guiding, which affected the quality of images. Additional details about our near-infrared observations are provided in Tables 4,5.
| Night | UT(start) | UT(end) | Hours | Seeing (arcsec) | Exp (s) | N.imm. |
|---|---|---|---|---|---|---|
| I | 1:40 | 9:47 | 4.16 | 0.9(0.2) | 70-600 | 86 |
| II | 23:46 | 9:50 | 5.28 | 0.7(0.2) | 3-400 | 143 |
| III | 23:06 | 9:31 | 5.79 | 0.8(0.1) | 70-900 | 126 |
| IV | 4:26 | 8:54 | 3.92 | 1.7(0.2) | 300-900 | 24 |
| V | 23:29 | 9:26 | 4.06 | 0.8(0.1) | 3-185 | 142 |
| VI | 23:20 | 9:35 | 5.83 | 1.0(0.2) | 90-400 | 154 |
| VII | 22:58 | 5:08 | 4.01 | 1.7(0.2) | 100-900 | 40 |
| VIII | 7:58 | 9:05 | 1.75 | 1.9(0.2) | 100-900 | 6 |
| IX | 22:32 | 6:29 | 4.67 | 1.4(0.2) | 100-900 | 61 |
| X | 23:03 | 9:35 | 5.81 | 1.2(0.2) | 100-650 | 124 |
| Nights | |||||
|---|---|---|---|---|---|
| I, V | x, x | x, x, x | x, x |
| Night | UT(start) | UT(end) | Hours | Seeing (arcsec) | Exp (s) | N.imm. |
|---|---|---|---|---|---|---|
| II | 12:30 | 18:30 | 3.52 | 1.7(0.3) | 5-60 | 218 |
| IV | 7:52 | 16:25 | 5.80 | 1.5(0.4) | 60 | 348 |
| IX | 8:48 | 18:39 | 6.72 | 1.1(0.3) | 10-60 | 348 |
| Night | ||
|---|---|---|
| IX | x | x |
3 Reduction of the data
3.1 Pre-reduction
The pre-reduction steps were performed using the common IRAF 222IRAF is distributed by the National Optical Astronomy Observatory, which is operated by the Association of Universities for Research in Astronomy, Inc., under cooperative agreement with the NSF. software system. For the Siding Spring images, we used a different approach to obtain the flat-field corrections.
For each night, we built a master sky frame from the dithered field images taken around the cluster as described in Section 2. For each image we estimated the mean sky level in manually-selected window free of stars, and scaled the images to the same mean count level. Then we used the IRAF task to create a master frame, using a 3- clipping algorithm. We also imposed an upper cut-off limit to the pixel values to be considered in calculating the mean at above the mean sky value, in order to effectively remove the sources from the sky frame. Then the resulting image was normalized and all other images taken during the same night were divided by it. We obtained 43, 41 and 35 field images in the filter for the three observing nights shown in Table 4. During the last night we also acquired 5 field images in and filters.
3.2 Profile fitting photometry
We reduced the two datasets from La Silla and Siding Spring separately, although we followed the same procedure for both of them. First, we generated a PSF for each image in each dataset with DAOPHOT II (Stetson 1987). The analysis of La Silla dataset was performed separately for each chip of the MPG/ESO WFI imager. We chose the second-order, spatially variable PSF for La Silla images, while after some tests for the Siding Spring ones we decided to apply a constant PSF. The PSF was calculated via an iterative process, which progressively eliminates the stars which highest residuals. We verified that after 3-4 iterations the PSF does not change significantly, hence we chose to apply 4 iterations for each image.
Once the PSFs were obtained, we applied ALLSTAR to refine the stellar positions and magnitudes and then DAOMATCH and DAOMASTER to calculate the coordinate transformations between the frames. To do this, we chose the best image in each dataset as a reference. By stacking 50 best-seeing images with MONTAGE2, we calculated the reference master frame from which we derived a master list of stars. We note that the center of NGC~6253 is located on CCD chip No. 51. For the reductions of this particular CCD, we considered all images acquired in filter and also those acquired in the other filters. Then, we applied ALLFRAME (Stetson 1994) to the whole dataset. In the case of remaining WFI CCD chips we considered only the best-seing images in filter. For the Siding Spring images, ALLFRAME was applied to the whole dataset.
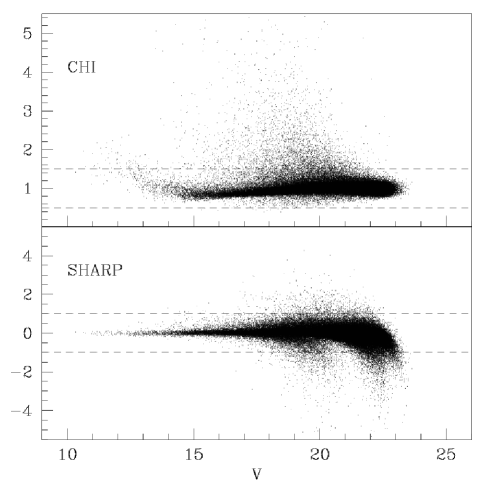
We averaged the magnitudes in the same filter, if a star was present at least in half of the images. Figure 1 shows the standard error of the mean magnitudes in our photometry, measured in different filters. These errors are smaller in and filters because the majority of images were taken through these filters. A preliminary selection of stars in the catalog was performed using the goodness parameters of the fit, and , provided by ALLFRAME task and shown in Fig. 2. We considered only those stars with the absolute value of sharpness less than , and the values comprised between and . The vast majority of eliminated sources are spurious detections, faint objects close to bright images, or bright stars for which reliable photometry is not possible due to the saturation. The final catalog contains 187963 stars down to 23.5 mag.
3.3 Calibration
3.3.1 La Silla
The calibration of La Silla dataset was performed separately for each CCD. The photometric standard field Mark A was observed in different filters on night V (Table 3). In order to check the photometric stability of the night, we used our photometric sequence obtained in filter. A bright and isolated star close to the cluster center was selected. Its measured instrumental magnitude was scaled to a s of exposure time and plotted against the airmass (Fig. 3). By definition, a weighted least squares linear fit to the observed magnitudes as a function of airmass is the mean extinction coefficient (slope) in this filter. For night V, the derived extinction cofficient is mag per unit of airmass, consistent with the value reported on the WFI instrument webpage for this filter 333http://www.ls.eso.org/lasilla/sciops/2p2/E2p2M/WFI/zeropoints/ (). We checked for the consistency of extinction across the entire field-of-view by measuring the other isolated bright stars. The lack of measurements around the airmass of (Fig.3) is due to the fact that we then switched to the observations of the standard field.

A total of standard stars were used to derive the calibration coefficients. The exposures were taken in all filters shown in Tables 2,3. The photometry of the standard stars was taken from the database of Stetson Photometric Standard fields 444http://cadcwww.dao.nrc.ca/standards/. The range of standard star colors spans , and , accordingly, and thus is fully adequate to calibrate our photometry.
For the standard field, the instrumental magnitudes were derived using aperture photometry. These magnitudes were then adjusted to s of exposure time and corrected for atmospheric extinction. The aperture corrections were applied out up to arcsec from the stellar centroids. Here, we report the calibration equations obtained for CCD No. 51:
| (1) |
| (2) |
| (3) |
| (4) |
| (5) |
| (6) |
| (7) |
| (8) |
| (9) |
| (10) |
| (11) |
| (12) |
3.3.2 Siding Spring
The calibrations of the Siding Spring near-infrared observations were obtained using the 2MASS photometry (Skrutskie et al., 2006). We calculated the weighted mean differences between our own photometry and the , using as weights the quadratic sum of our own photometric errors and those of the , and considering only the brightest sources (). In total we used 270, 244 and 246 stars for , and band respectively. The result is reported in the following equations:
| (13) |
| (14) |
| (15) |
Our photometry is equivalent to the in the and band, but appears slightly poorer in the band, as indicated also by the larger offset and the reported above. This is probably due to the small number of scientific images acquired and too few background images used for the sky removal. For this reason the band is not further used in this work. Moreover, in our final catalog we report both our own infrared photometry and the photometry, for the stars in the cluster region in common to our catalog which have at least one measurement in , or band.
4 Comparison with previous photometry
In previous photometric studies of NGC~6253, the broadband CCD data were obtained in filters (studies by BR and SA) and in for PI, while TW presented CCD photometry on the intermediate-band H system. Systematic differences in the broadband data have been already pointed out by PI and TW. In order to compare our data with those in the other surveys, we calculated the differences “our minus other photometry”. These residuals were fit with a linear function in the form , where is the chosen color index. The coefficients and along with their errors (, ),the dispersion of the residuals (), the number of stars used in the fit (), and the number of rejected stars () are reported in Table 6. The differences with the other broadband data from BR, SA and PI, imply zero point offsets in filter ranging between 0.01-0.1 mag and color terms ranging between mag. On average, our photometry is closer to that by SA, although it varies and depends on the bandpass considered. In the following discussion we decided to use only our own photometry, because of the data homogeneity and the high photometric quality of a calibration night, as indicated by Fig. 3.
| Survey | Color | |||||||
|---|---|---|---|---|---|---|---|---|
| BR() | 0.05 | 0.01 | -0.13 | 0.01 | 0.02 | 296 | 4 | |
| BR() | 0.07 | 0.01 | -0.11 | 0.01 | 0.02 | 295 | 5 | |
| BR() | 0.003 | 0.010 | 0.02 | 0.01 | 0.02 | 296 | 4 | |
| BR() | -0.02 | 0.01 | 0.06 | 0.01 | 0.02 | 295 | 5 | |
| SA() | -0.08 | 0.03 | 0.07 | 0.02 | 0.05 | 95 | 1 | |
| SA() | 0.03 | 0.02 | 0.02 | 0.02 | 0.03 | 93 | 3 | |
| SA() | -0.04 | 0.04 | 0.15 | 0.02 | 0.04 | 94 | 2 | |
| SA() | 0.007 | 0.020 | 0.05 | 0.02 | 0.04 | 93 | 3 | |
| PI() | -0.17 | 0.04 | 0.06 | 0.03 | 0.07 | 134 | 1 | |
| PI() | 0.03 | 0.01 | -0.05 | 0.01 | 0.03 | 131 | 4 | |
| PI() | 0.01 | 0.02 | -0.003 | 0.020 | 0.04 | 131 | 4 |
5 Astrometric calibration
The astrometric calibration of pixel coordinates was performed by means of the IRAF subroutines, using the UCAC2 (Zacharias et al. 2004) as a reference catalog. A trial solution for each frame was obtained from a manually selected sample of UCAC2 stars in the field. The so-called equatorial solution was found by means of the IRAF tasks of . An iterative procedure was then applied to refine the coordinates by including all available reference stars from UCAC2. This procedure was applied separately to each one of the CCDs in the MPG/ESO WFI imager. The Siding Spring positional data were calculated using the equatorial coordinates from the La Silla final catalog of positions in NGC 6253. The accuracy of astrometric calibration in our catalog is in both coordinates.
6 Proper motions
NGC~6253 is projected towards a very rich stellar field at a low galactic latitude, making the identification of cluster members from photometry alone highly uncertain. Proper motions is a powerful and reliable tool to determine cluster membership. We obtained the first ever proper motions for NGC~6253 thanks to the availability of 4 -band images (Table 7), acquired with the MPG/ESO WFI on March 30, 2000 as part of the PRE-FLAMES survey (Momany et al. 2001). Thus, we have a 4.22 yr temporal baseline considering that our MPG/ESO WFI data were collected in June of 2004. For the second epoch, we used our six images acquired in filter and listed in Table 3.
| Date | Filter | Exp (s) | N.imm |
|---|---|---|---|
| 30/3/2000 | 30 | 2 | |
| 30/3/2000 | 240 | 2 |
We used the technique described in Anderson et al. (anderson06 (2006)), which allows us to quantify the WFI geometric distortions. One of the key features of this technique is the so-called local transformation approach for calculating proper motions. A representative set of local reference stars can be selected around each target. It is highly desirable that the cluster members themselves form this set, because the expected internal velocity dispersion for clusters stars is negligible with respect to the measurement errors. Assuming that the internal velocity dispersion is about 1 km s-1, at the distance of NGC~6253, kpc, it translates into mas yr-1, which is by a factor of 10 less than the accuracy of our proper motions. Once the pixel coordinates of stars have been corrected for geometric distortions, we selected 50 probable cluster members (with isolated and unsaturated images) around each target. These stars were used a reference frame to calculate a linear transformation of coordinates between the two CCD frames taken at different epochs, which constitute a pair of “plates”. The local transformation effectively takes out a possible small local residual distortion pattern. In general, this transformation is performed iteratively, starting with photometrically selected cluster members. In each following step the likely proper-motion nonmembers are deleted and the calculations are repeated using a cleaner list of cluster members.
The proper motion errors have been estimated from the scatter of calculated proper motions calculated by considering all pairs of first and second epoch images. Because of the limited number of images used in proper motion calculations, the resulting errors generally underestimate the true scatter. As demonstatrated by Anderson et al. (2006), for well-exposed images taken with MPG/ESO WFI imager the positional accuracy of a single image is about 7 mas in each coordinate. Formally, this translates into the proper motion error of 1.1 mas yr-1 over the 4.22 yr span. In order to provide a more realistic estimate of proper motion errors, we added this 1.1 mas yr-1 to the error estimate provided by the pipeline. As expected, the adjusted proper motions uncertainties tend to increase with magnitude and reach mas yr-1 at . We note that the final errors shown in Fig. 4 have an upper limit cut-off at 4 mas yr-1. The proper motions with accuracies lower than this limit are not considered in this study.
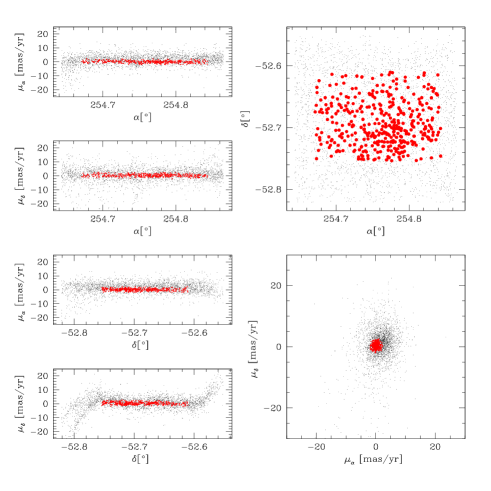
We note that in the highlighted range of spatial distribution (Fig. 5) our proper motions are free of potential spatial correlations. Outside this range, we were unable to adequately correct for the geometric distortion effects. This is likely due to the fact that the cluster is essentially contained by the inner CCD No. 51 of the MPG/ESO WFI imager. The local transformation method relies heavily on cluster members which are rare in the outer parts of a cluster. As the result, the calculated proper motions may get biased as we move outwards from the cluster center. In order to isolate reliable cluster’s members, we consider only the stars whose coordinates are comprised between 200x1800 pixels and 1000y3000 pixels on the system of CCD No. 51 which contains most of the NGC~6253 members.Nevertheless, in the final catalog we retain all proper motions we have calculated.

6.1 Cluster membership
As illustrated in Fig. 6, the proper motion distribution shows the presence of two distinct populations of stars: one has a narrow peak at mas yr-1 and represents the cluster’s stars, the other one represents the broader distribution of field stars. Following the approach proposed by Vasilevskis (1958) the proper-motion membership probability can be expressed as:
| (16) |
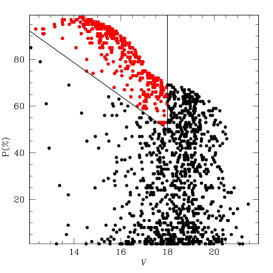
where is the distribution of cluster stars, and the distribution of field stars in the proper motion diagram, which are generally represented by Gaussian functions. As in Yadav et al. (2008), the calculation of the membership probabilities was done following the local sample method, where for each target star a surrounding sample of stars is selected to closely represent the properties of the target. The local sample stars were selected inside a 2.5 mag range centered on the target which allowed us to compensate for the effect of a magnitude-dependent cluster-to-field star ratio. We parameterized the proper motion dispersion for both, the cluster and field stars, and the center of field star distribution as a function of the magnitude. The center of cluster star distribution was always kept fixed at mas yr-1. Figure 4 (lower panel) shows the magnitude dependence of the membership probabilities, which reflects the degree of reliability of our proper motions. Towards fainter magnitudes, the increasing level of field star contamination is resulting in a steadily decreasing maximum membership probability. The separation between cluster and field is convincing for , for which the cluster main sequence can easily be distinguished. We thus adopted a magnitude dependent threshold to distinguish between the cluster and field stars. We require the probable cluster members to have their membership probabilities 90% at , and 50% at , assuming a linear dependence of the threshold between these two extremes. We found a total of stars that satisfy the criteria reported above. Nevertheless as discussed in Sec. 7.1 and in Sec. 7.3 some residual contaminants are certainly present in this sample, in particular field stars that share the proper motion of cluster stars.

6.2 Membership of spectroscopic stars
There are two spectroscopic studies of NGC~6253 that list individual stars belonging to the upper main sequence or the red giant branch: Sestito et al. (2007, SE) and Carretta, Bragaglia & Gratton (2007, CA2). Thus, SE derived radial velocities for seven stars stretching from the main sequence turnoff to the red clump of NGC~6253, using high-resolution spectroscopy at VLT/UVES. Among these stars, they isolated four probable members with the mean radial velocity of km s-1. The other two stars, 069360 and 022182 enumerated by Momany at al. (2001), appear to be nonmembers according to their radial velocities Finally, star 023501 is classified by SE as a doubtful member. In Table 8, we show our membership probabilities for this sample of SE stars. First column reports for each star the number IDEIS taken from the EIS survey (Momany et al. 2001). Second column shows our identifier IDMO. The following RA, DEC, and are all from our catalog, while radial velocities along with their errors are from SE. The next column lists proper-motion membership probability (P). Metallicity [Fe/H] and its error is from Table 4 in SE. The last column shows the status of a star – TO: turn-off star; RGB: red giant branch star; SGB: sub-giant branch star; clump: red clump star; M: probable cluster’s member; NM: probable non member; bin?: probable binary star. We confirm that star 022182 is a field star, which also explains its lower metallicity ([Fe/H]=0.12). For all other stars we obtained membership probabilities larger than P=%. A deviant radial velocity for star 069360 is more suggestive of its binarity and cluster membership than the likelihood of being a field star. The same conclusion can be drawn for star 023501.
The study by CA2 (Table 9) analyzed high resolution spectra of five red clump stars in NGC~6253 obtained with the UVES and FEROS spectrographs. According to our proper motions, all five stars have high membership probabilities and are considered to be the cluster members. Star 2508 (in BR enumeration) is very likely to be a cluster member and a spectroscopic binary as indicated by its deviant radial velocity listed by CA2.
| IDEIS | IDMO | RA | DEC | RVrms | P | [Fe/H]err | Status | ||
|---|---|---|---|---|---|---|---|---|---|
| (J2000) | (J2000) | (km s-1) | % | ||||||
| 069885 | 45485 | 254.717971 | -52.694686 | 14.341 | 0.786 | -28.811.30 | 98 | +0.45 | TO, M |
| 023501 | 45474 | 254.721883 | -52.712070 | 14.275 | 0.819 | -33.492.87 | 96 | +0.29 | TO, M, bin? |
| 069360 | 45421 | 254.779357 | -52.706134 | 13.175 | 1.269 | -21.070.59 | 94 | +0.48 | RGB, M, bin? |
| 022182 | 45398 | 254.814677 | -52.725906 | 13.840 | 1.199 | -35.510.77 | 0 | +0.12 | SGB/RGB, NM |
| 023498 | 45455 | 254.839016 | -52.712035 | 13.912 | 0.855 | -30.131.01 | 96 | +0.32 | SGB, M |
| 024707 | 45404 | 254.803860 | -52.693301 | 13.501 | 1.144 | -30.580.65 | 97 | +0.39 | SGB/RGB, M |
| 105495 | 45415 | 254.713319 | -52.616005 | 12.700 | 1.289 | -29.330.84 | 93 | +0.49 | clump, M |
| IDBR | IDMO | RA | DEC | RV | P | [Fe/H]err | Status | ||
|---|---|---|---|---|---|---|---|---|---|
| (J2000) | (J2000) | (km s-1) | % | ||||||
| 2509 | 45412 | 254.816479 | -52.707251 | 12.664 | 1.259 | -28.71 | 93 | +0.450.11 | clump, M |
| 2885 | 45410 | 254.722210 | -52.698323 | 12.629 | 1.289 | -28.13 | 91 | +0.470.14 | clump, M |
| 4510 | 45414 | 254.775449 | -52.665473 | 12.713 | 1.268 | -27.44 | 91 | +0.420.12 | clump, M |
| 2508 | 45413 | 254.766037 | -52.707004 | 12.666 | 1.241 | -20.60 | 91 | - | clump, M, bin? |
| 3595 | 45407 | 254.774389 | -52.684524 | 12.360 | 1.252 | -28.76 | 93 | +0.480.09 | clump, M |
7 Analysis of the color-magnitude diagrams
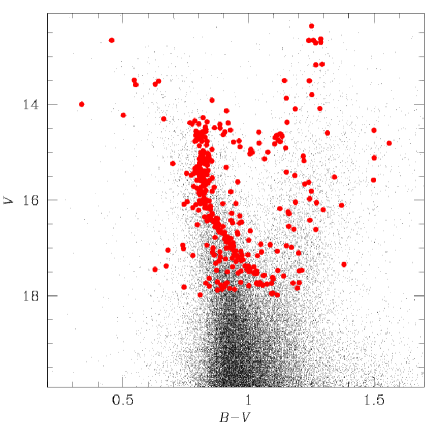
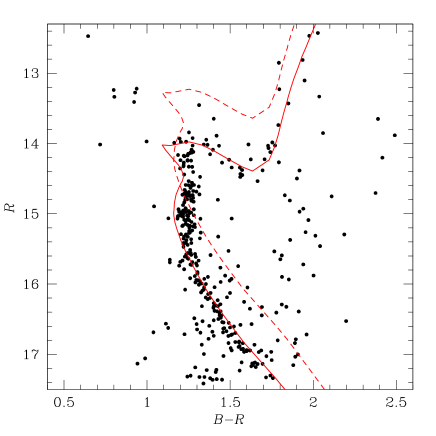
The observed color-magnitude diagrams of NGC~6253 in various optical/near-infrared bandpasses are presented in Fig. 8. Only those stars meeting our cluster member selection criteria, defined in Sect. 6, are plotted in these CMDs. Among various features of CMDs, one of them is the hook at the turnoff of main sequence already noted by BR. In addition, sub-giants, red giant branch stars, red clump, and blue stragglers are all present. We note that due to the relatively high uncertainties of our near infrared photometry the appearance of cluster sequences and populations is less prominent.

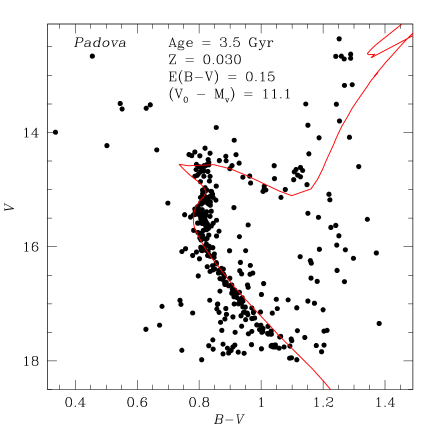
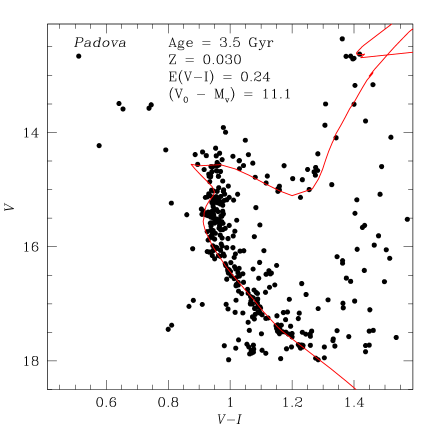
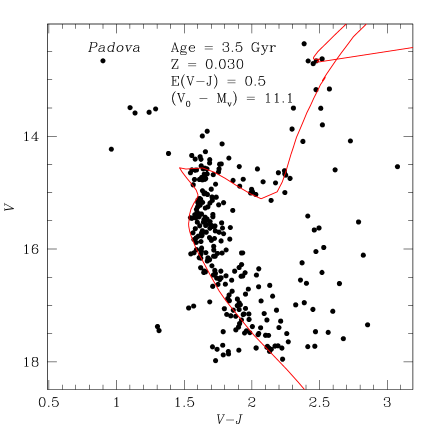
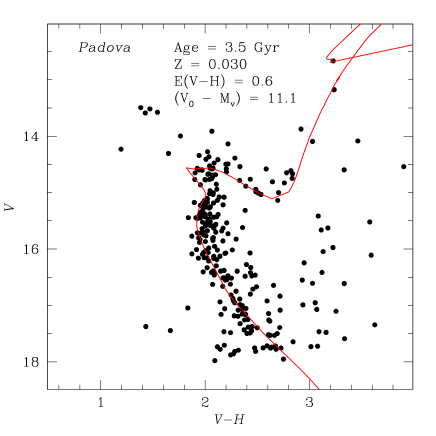
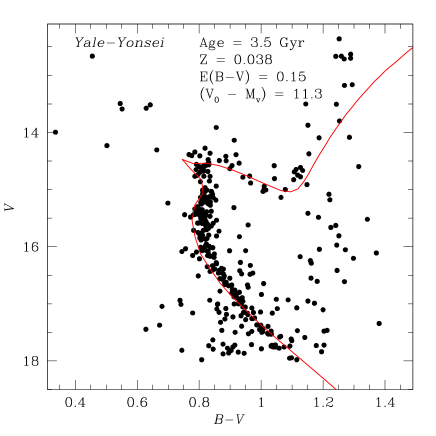
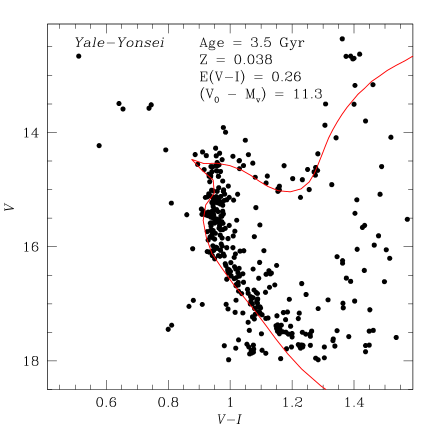
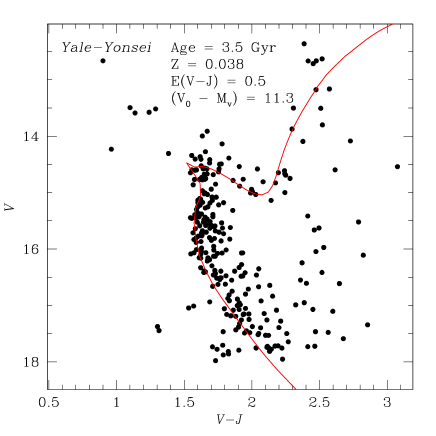
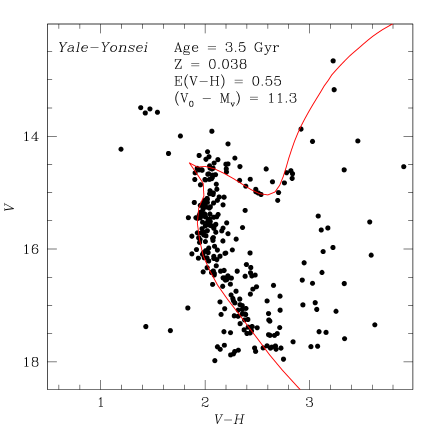
We used the Padova and Yale-Yonsei set of isochrones to fit the NGC~6253 CMDs using both optical and near infrared bandpasses. As noted in previous spectroscopic studies of NGC~6253, the solar-scaled models are the most appropriate for this open cluster. From the Padova database 555http://stev.oapd.inaf.it/cgi-bin/cmd (Girardi et al. 2002, Marigo et al. 2008), we obtained a set of solar-scaled isochrones with metallicity Z=0.03, which is the highest heavy metal content for this set of isochrones. As shown in Fig.9, the best fit is obtained for the age 3.5 Gyr. We fixed the true distance modulus in the bandpass at , adopting , , and from the simultaneous best fit to the , , and CMDs. In the same manner, from the Yale database 666http://www.astro.yale.edu/demarque/yyiso.html (Demarque et al. 2004), we obtained a set of solar-scaled isochrones with Z=0.038 (equivalent to [Fe/H]=+0.36). Again, the best fit (Fig. 10) is obtained for the age 3.5 Gyr. Similarly to the fit with Padova isochrones, here we obtain , , , and . We note that the values of ratios and obtained from the fit with the Padova and Yale isochrones, respectively, to the appropriate CMDs is consistent with the values reported by Mathis (1990) for the standard reddening law (). Thus, we confirm the result of SA that the color excess ratios are in agreement with the assumption of a normal reddening law in the direction of NGC~6253. The fundamental parameters we have obtained are consistent with those derived by PI, SA, AT within the quoted uncertainties. As indicated in Table 1, BR have derived a higher reddening in and, reciprocally, a smaller distance modulus. Also, TW indicated a higher amount of reddening, but this estimate was subsequently revised in the study of AT, resulting in . Despite the small discrepancies between the various photometries noted in Table 6, our study confirms a lower value for the reddening in and a higher value for the distance modulus with respect to the values of BR. The best isochrone-fit implies the age of Gyr, which is somewhat older than generally believed in previous studies such as by BR, SA, and TW.
Regarding the overall isochrone fit to the CMDs shown in Figs. 9, 10, we observe that the turn-off morphology is well-reproduced by both sets of isochrones, while the Padova isochrone provides less accurate fit to the main sequence around as opposed to the Yale isochrone. The red giant branch is not very well fit by both sets of isochrones, especially in the CMD, where the theoretical isochrone it is clearly red-shifted with respect to the observational RGB. The red clump location around is well-reproduced by the Padova isochrone, whereas the Yale isochrones fail to extend to this feature because the Yale models do not consider the phase of helium burning core in stars.
7.1 The color-color diagram
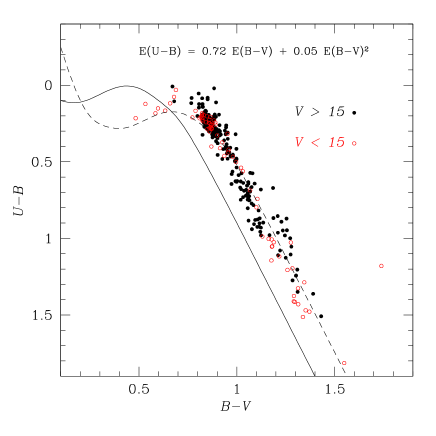
Field stars with similar proper motions to those of cluster stars clearly contaminate the sample of likely cluster members presented in Sec. 6. This is evident from the color magnitude diagrams of Fig. 8. In Fig. 11 (upper panel), we show the color-color diagram, obtained using BR photometry and considering all stars that meet the cluster membership criteria presented in Sec. 6. The solid line represents the Schmidt-Kaler (1982) empirical ZAMS, and the dashed line the same ZAMS shifted by (to be consistent with the BR estimate, see Tab. 1) along the reddening vector considering a normal standard reddening law. We cross-correlate our catalog with that one of BR and found stars in common satisfying our proper motion membership criteria. We use the BR photometry as our catalog does not include the band. In Fig. 11 (bottom panel), the stars with and are clear contaminants as also shown in the two color diagram where these stars tend to deviate from the ZAMS. On the red side, the distinction is less effective as binary cluster stars and field stars both have redder colors with respect to the main sequence, although stars with are certainly contaminants (Fig. 8). Further information (e.g., radial velocities, abundance analysis) is necessary to clearly disentangle the field contaminants and cluster members in the other regions of CMD. In Sec. 7.3, we further restricted our sample of cluster members by selecting stars close to the main-sequence fiducial line and to the equal mass binary sequence.

7.2 Blue Stragglers
Although NGC~6253 is projected against a rich Galactic disk
stellar field, Fig. 7 clearly shows a conspicuous extension of the
cluster’s main sequence brighter than the turnoff point, apparently
not related to Galactic disk.
As emphasized by Carraro et al. (2008),
generally the Galactic disk main sequences occupy the same region where
the blue straggler stars are routinely searched for.
If the kinematic membership information is not known, this bears the
consequences on the true number of blue straggler among the candidates
and on the interpretation of their statistics and formation scenario (De Marchi et al. 2006).
Ahumada & Lapasset (2007) suggested that NGC~6253 harbors
27 blue stragglers and it is one of the richer star clusters in terms of
blue stragglers. To estimate the number of cluster’s blue stragglers,
we followed the same method as applied by Ahumada & Lapasset (2007).
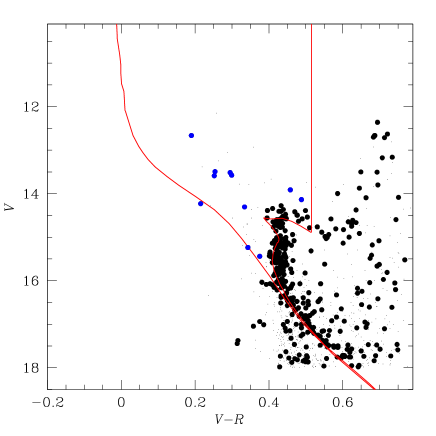
Thus, in Fig. 12 the best fitting Padova isochrone
for the CMD is plotted along with the Zero Age Main Sequence,
adjusted to the same metallicity as the cluster. The triangular area
between the ZAMS and a certain portion of theoretical isochrone
defines the area containing blue stragglers.
As to the red limit of this area, we applied a
cut-off at , denoted by the vertical line in Fig. 12.
The stars that passed our cluster member selection criteria
are shown as large black dots. The stars considered to be the blue stragglers
candidates are indicated by large blue dots. The likely Galactic disk
contaminants in the same region and magnitude range are
plotted as small dots. Summarizing, the total number of
blue straggler candidates is 11 (Tab. 10). All these stars
have proper-motion membership probability P91%.
In this sample we also considered two stars
which are slightly on the blue side of our selection region, in accordance
with the Ahumada & Lapasset (2007) selection criteria.
In the same region of the CMD we can find another 27 stars that do not
meat our stringent selection criteria. This confirms the Carraro et al. (2008)
main conclusion that the statistics of Ahumada & Lapasset (2007)
is significantly biased due to the field star contamination.
7.3 Binary fraction
A preliminary estimate of cluster’s binary fraction can be obtained using the radial velocity distribution from previous spectroscopic studies combined with our proper-motion membership probabilities. Thus, from the sample of 11 probable cluster members analyzed by Sestito et al. (2007) and Carretta et al. (2007), 3 stars are probable binary stars, as indicated by their deviant radial velocities and high membership probability (Sect. 6.2). This yields a binary fraction of . Given the small number of cluster members, this independent estimate has a high uncertainty and is applicable only to the population of evolved stars in NGC~6253.
Our proper-motion-selected sample of cluster members can be used to give an estimate of the cluster’s binary fraction. In Fig. 13 (upper panel), we show the CMD with the best-fit Padova isochrone overplotted (solid line) and the same isochrone shifted by 0.75 mag (dashed line), which denotes the locus of equal mass binaries. As evident from this figure, in the magnitude range some stars appear to fall close to the predicted binary sequence, or in between the main sequence and the binary sequence. The stars with color in the same magnitude range are clearly field contaminants with proper motions similar to those of cluster stars. At the main sequence and the equal-mass binary sequence overlap, but at the binary sequence and the field contaminants are not anymore discernible. Moreover, for some clear contaminants are also present on the blue side of the main sequence. Finally, the stars with similar proper motions to cluster members which are just located on the main sequence or on the binary sequence cannot be isolated with the present data. Similarly, the color-color diagram turned out to be inappropriate for this purpose (Sec. 7.1), although one can argue that these field contaminants affect equally both the single cluster members and cluster binary stars and thus, have a minor impact on the fraction of binaries relative to the total number of cluster members. It should be noted that the binaries stars with mass ratio should appear on the main sequence as their color and magnitude differences are smaller than the photometric errors (e.g., Fan et al. 1996, BR). Then, the binary fraction calculated below can be considered as a crude lower limit of its true value.
Using the diagram in Fig. 13 (upper panel) we isolated stars in the magnitude range and with colors . We then considered the manually-selected main-sequence fiducial line in that magnitude range and derived the histogram of the color differences of all stars with respect to the colors of fiducial line (Fig. 13, bottom panel). A secondary peak located approximately at the mean color predicted for equal mass binaries (, vertical dashed line) is visible. In this histogram the number of stars with color is whereas the total number stars is , indicating that the fraction of binary stars should be – in good agreement with BR which found a similar binary fraction () but without the benefit of proper motions.

| IDMO | RA | DEC | P (%) | ||
|---|---|---|---|---|---|
| (J2000) | (J2000) | ||||
| 45497 | 254.784714 | -52.709400 | 14.230 | 0.502 | 94 |
| 45387 | 254.777725 | -52.723915 | 13.588 | 0.551 | 97 |
| 45367 | 254.826706 | -52.718845 | 13.493 | 0.545 | 96 |
| 45444 | 254.753860 | -52.714283 | 13.516 | 0.642 | 95 |
| 45447 | 254.786285 | -52.702099 | 13.575 | 0.629 | 97 |
| 45377 | 254.776123 | -52.753593 | 14.305 | 0.663 | 91 |
| 45422 | 254.771103 | -52.710304 | 12.663 | 0.455 | 93 |
| 45455 | 254.839020 | -52.712032 | 13.912 | 0.855 | 96 |
| 45465 | 254.756470 | -52.723072 | 14.136 | 0.913 | 97 |
| 40942 | 254.772125 | -52.645889 | 15.237 | 0.699 | 94 |
| 33095 | 254.745377 | -52.644726 | 15.440 | 0.753 | 93 |
8 The Catalog
The catalog containing all stars is only available in electronic form at the CDS via anonymous ftp to cdsarc.u-strasbg.fr (130.79.128.5) or via http://cdsweb.u-strasbg.fr/cgi-bin/qcat?J/A+A/ . In Table 11, we list only the content of the catalog. If a particular parameter is not measured or determined, we use a default meaningless value of 10000.
9 Conclusions
We present a photometric and astrometric catalog of stars in the bands in the field of the old and metal-rich Galactic open cluster NGC 6253. The catalog was constructed using the images taken with the La Silla 2.2m telescope and the Siding Spring 3.9m telescope during a joint days observing campaign in June 2004.
We derived proper motions for stars out to from the cluster center, and used these data to improve our knowledge of fundamental properties of NGC~6253. We compared our new photometry with previous photometric data and concluded that overall our photometry is more consistent superior over the existing studies.
Relative proper motions derived in this study combined with the broadband optical and near-infrared photometry allowed us a more detailed analysis of the cluster’s fundamental properties. By the means of isochrone fitting we derived the true distance modulus and the corresponding reddening estimates to be , , and . The age of the cluster we obtained is older than what previously suggested being Gyr. The color excess ratios obtained using both optical and near-infrared photometry are in agreement with a normal reddening law. Finally, we estimated the cluster’s binary fraction to be and identified blue straggler candidates. More extensive spectroscopic survey of NGC~6253 is clearly warranted in order to improve the cluster membership and identify binaries in this astrophysically important open cluster.
Acknowledgements.
We thank L. R. Bedin for sharing the near-infrared data and J. Anderson for having made available his routines for calculating proper motions. I. Platais gratefully acknowledges support from the National Science Foundation through grant AST 09-08114 to Johns Hopkins University. We thank the anonymous referee for careful reading and useful suggestions. This research was supported by the DFG cluster of excellence ’Origin and Structure of the Universe’ (www.universe-cluster.de).| Col. 1 | Sequential identification number |
|---|---|
| Col. 2 | x coordinate in the CCD reference system (column 28) |
| Col. 3 | y coordinate in the CCD reference system (column 28) |
| Col. 4 | Right Ascension (J2000) |
| Col. 5 | Declination (J2000) |
| Col. 6 | Calibrated B magnitude |
| Col. 7 | Error in B magnitude |
| Col. 8 | Calibrated V magnitude |
| Col. 9 | Error in V magnitude |
| Col. 10 | Calibrated R magnitude |
| Col. 11 | Error in R magnitude |
| Col. 12 | Calibrated I magnitude |
| Col. 13 | Error in I magnitude |
| Col. 14 | Calibrated J magnitude |
| Col. 15 | Error in J magnitude |
| Col. 16 | Calibrated H magnitude |
| Col. 17 | Error in H magnitude |
| Col. 18 | Calibrated K magnitude |
| Col. 19 | Error in K magnitude |
| Col. 20 | J magnitude from |
| Col. 21 | H magnitude from |
| Col. 22 | K magnitude from |
| Col. 23 | Relative proper motion in Right Ascension (mas/year) |
| Col. 24 | Error in RA proper motion |
| Col. 25 | Relative proper motion in Declination (mas/year) |
| Col. 26 | Error in Dec proper motion |
| Col. 27 | Membership probability |
| Col. 28 | CCD number in the system of MPG/ESO WFI |
References
- (1) Ahumada, J. A. & Lapasset E. 2007, A&A, 463, 789
- (2) Aigrain, S. et al. 2007, MNRAS, 375, 29
- (3) Anderson, J. et al. 2006, A&A, 454, 1029
- (4) Anthony-Twarog, B. J., Twarog, B. A. & Mayer L. 2007, AJ, 133, 1585 (AT)
- (5) Burke et al. 2006, AJ, 132, 210
- (6) Bragaglia, A. et al. 1997, MNRAS, 284, 477 (BR)
- (7) Bragaglia, A., Tosi, M., 2006, AJ 131, 1544
- (8) Carraro, G., Mendez, R.A., Costa, E., 2005a, MNRAS 356, 647
- (9) Carraro, G., Janes, K.A., Eastman, J.D, 2005b, MNRAS 364, 179
- (10) Carraro, G. et al. 2007, A&A 476, 217
- (11) Carraro, G., Vázquez, R.A., Moitinho, A., 2008, A&A 482, 777
- (12) Carretta, E. et al. 2000, ASPC, 198, 273 (CA1)
- (13) Carretta, E., Bragaglia, A. & Gratton, R. G. 2007, A&A, 473, 129 (CA2)
- (14) Demarque, P., Woo, J. H., Kim, Y. C., Yi S. K. 2004, ApJS, 155, 667
- (15) De Marchi et al. 2006, A&A, 459, 489
- (16) De Marchi, F. et al. 2007, A&A, 471, 515
- (17) Fan, X. et al. 1996, AJ, 112, 628
- (18) Fisher, D. A., & Valenti, J. 2005, ApJ, 622, 1102
- (19) Friel, E. D. et al. 2002, AJ, 124, 2693
- (20) Girardi et al. 2002, A&A, 391, 195
- (21) Hartman, J. D. et al. 2008, ApJ, 675, 1233
- (22) Janes, K.A, Phelps, R.L., 1994, AJ 108, 1773
- (23) Mathis, J. S. 1990, ARA&A, 28, 37
- (24) Marigo P. et al. 2008, A&A, 482, 883
- (25) Mochejska, B. J. et al. 2006, AJ, 131, 1090
- (26) Momany, Y. et al. 2001, A&A, 379, 436
- (27) Montalto, M. et al. 2007, A&A, 470, 1137
- (28) Piatti et al. 1998, AJ, 116, 801 (PI)
- (29) Piskunov, A. E. et al. 2006, A&A, 445, 545
- (30) Sagar, R., Munari, U., & de Boer, K. S. 2001, MNRAS, 327, 23 (SA)
- (31) Schmidt-Kaler, Th., 1982, in Schaifers K., Voigt, H.H., eds., Numerical Data and Functional Relationships in Science and Technology, Landolt-Börbstein, New Series, Group VI, Vol 2(b), Springer, Berlin, p.14
- (32) Santos, N. C. et al. 2003, A&A, 398, 363
- (33) Sestito, P., Randich, S. & Bragaglia, A. 2007, A&A, 465, 185 (SE)
- (34) Skrutskie, M. F. et al. 2006, AJ, 131, 1163
- (35) Stetson, P. B. 1987, PASP, 99, 191
- (36) Stetson, P. B. 1994, PASP, 106, 250
- (37) Street, R. A. et al. 2003, MNRAS, 340, 1287
- (38) Twarog, B. R., Anthony-Twarog, B. J., & De Lee, N. 2003, AJ, 125, 1383 (TW)
- (39) Vasilevskis, S., Klemola, A. & Preston, G., 1958, AJ, 63, 387
- (40) Weldrake, D. T. F. et al. 2005, ApJ, 620, 1043
- (41) Yadav, R. K. S. et al. 2008, A&A, 484, 609
- (42) Yong, D., Carney, B.W., Teixera de Almeida, M. M., 2005, AJ, 130, 597