First direct measurement of optical phonons in 2D plasma crystals
Abstract
Spectra of phonons with out-of-plane polarization were studied experimentally in a 2D plasma crystal. The dispersion relation was directly measured for the first time using a novel method of particle imaging. The out-of-plane mode was proven to have negative optical dispersion, comparison with theory showed good agreement. The effect of the plasma wakes on the dispersion relation is briefly discussed.
pacs:
52.27.Lw, 52.27.Gr, 52.35.Fp, 82.70.DdComplex plasmas consist of particles immersed in a weakly ionized gas-discharge plasmas Fortov et al. (2005, 2004); Couëdel et al. (2008). Due to the absorption of ambient electrons and ions, microparticles acquire significant (negative) charges and can form strongly coupled systems analogous to conventional soft matter (complex fluids). Two-dimensional (2D) complex plasmas are particularly convenient systems for the detailed experimental studies of strongly coupled phenomena at the atomistic level. The essential advantage of such systems is that one can gain complete information about the state of the entire particle ensemble in the phase space, which is an invaluable advantage for the investigation of collective processes occurring in strongly coupled media, such as transport, phase transitions, structural quenching, etc Fortov et al. (2005, 2004).
2D complex plasmas are usually studied in ground-based experiments with RF discharges. Microparticles injected in such discharges levitate in the sheath region near the bottom electrode, where the electric field can balance gravity. Under certain conditions the particles can form a monolayer, and if the electrostatic coupling between them is strong enough, particles arrange themselves into ordered structures – 2D plasma crystals Thomas et al. (1994). In such crystals, numerous collective phenomena like melting and recrystallization, mass and heat diffusion, solitons and shocks Popel et al. (2003); Nunomura et al. (2002, 2000, 2005); Wang et al. (2001); Nosenko et al. (2009a), etc. have been reported. Propagation of dust-lattice (DL) waves in 2D lattices is often used as a diagnostic tool to determine parameters of the plasma crystal Wang et al. (2001); Nosenko et al. (2002).
In 2D complex plasmas, like in any (strongly coupled) 2D system, two in-plane wave modes can be sustained (here we naturally leave aside polydisperse mixtures). In crystals, both modes have an acoustic dispersion, one of them is longitudinal, another is transverse. Since the strength of the vertical confinement in such systems is finite, there is a third fundamental wave mode associated with the out-of-plane oscillations Ivlev and Morfill (2000); Samsonov et al. (2005); Vladimirov et al. (1997, 2006); Dubin (1993); Qiao and Hyde (2003); Zhdanov et al. (2009). Theory predicts that this mode has a negative (or inverse) optical dispersion and depends critically on the parameters of the plasma wakes (that are formed downstream from each particle levitating in the sheath Ivlev and Morfill (2000); Zhdanov et al. (2009)). So far, the systematic experimental studies of the DL waves were limited by the in-plane modes, whereas direct measurements of the out-of-plane dispersion relation have never been carried out (see, however, Refs. Ivlev et al. (2003); Samsonov et al. (2005)). To a large extent, this is due to the lack of reliable diagnostics of the vertical dynamics of individual particles.
In this Letter, we report on the first direct measurements of the out-of-plane DL wave mode in a 2D plasma crystal. The dispersion relation is recovered in a broad range of wave vectors, revealing remarkably good agreement with the existing theory. The measurements were performed by employing a new detection technique of the vertical (out-of-plane) particle displacement. The obtained results provide us with new insights into the mechanisms governing the individual particle dynamics in 2D complex plasmas (in particular, highlight the important role of the plasma wakes) and allow us to specify the conditions when such systems can be used to investigate generic properties of (classical) 2D solids and liquids.
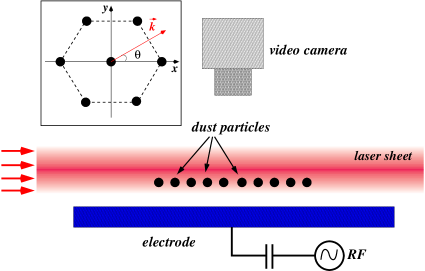
A sketch of the experimental setup is shown in Fig. 1. We used a capacitively coupled RF glow discharge at 13.56 MHz. The argon pressure was between 0.5 Pa and 1 Pa and the RF peak-to-peak voltage was between 175 V and 310 V (which corresponds to a forward RF power between 5 W and 20 W). The plasma parameters in the bulk discharge were deduced from Langmuir probe measurements, yielding the electron temperature eV and the electron density cm-3 at 0.66 Pa and =20 W Nosenko et al. (2009b). A 2D particle suspension was formed by levitating melamine formaldehyde microspheres in the sheath above the RF electrode. The particles had a diameter of m and a mass kg. The diameter of the obtained crystalline structure was about 50–60 mm, depending on the number of injected particles. The microparticles were illuminated by a horizontal laser sheet which had a Gaussian profile in the vertical direction with a standard deviation m (corresponding to a full width at half maximum of 175 m). The sheet thickness was approximatively constant across the whole crystal. The particles were imaged through a window at the top of the chamber by a Photron FASTCAM 1024 PCI camera at a speed of 250 frames per second. The horizontal coordinates and as well as velocity components and of individual particles were then extracted with sub-pixel resolution in each frame by using a standard particle tracking technique Rogers et al. (2007). An additional side-view camera was used to verify that our experiments were carried out with a single layer of particles.
In order to extract the vertical position and velocity of individual particles, we needed to employ a very different technique. Unlike relatively compact Coulomb clusters, where these values can be directly measured by using the side view, the particles forming large monolayers cannot be individually resolved from the side. Therefore, the out-of-plane particle tracking can only be performed by using the top view, and then the vertical displacement should be deduced from the relative variation of the scattered light intensity.
The “conventional” method of particle visualization, when the peak of the Gaussian intensity in the illuminating laser sheet practically coincides with the particle monolayer (this facilitates the in-plane tracking, especially at higher frame rates), is not appropriate to obtain and . The reason is twofold: The first problem of such configuration is that the variation in the (particle image) intensity between consecutive frames gives us only the magnitude of the vertical displacement (and hence velocity), whereas the direction remains undefined. Indeed, the intensity of the individual particle image at each frame is proportional to the local illumination intensity, which scales as
| (1) |
where is the position of the intensity maximum. Therefore, if the mean levitation height is very close to , then the magnitude of the particle displacement can be substantially larger than . Obviously, a given variation of the image intensity in this case may equally imply either positive or negative displacement Samsonov et al. (2005). The second problem of the “conventional” method is associated with the sensitivity. Since , the resulting intensity variations scale as . The magnitude of vertical displacement (induced by thermal fluctuations) can be estimated as m (here is the kinetic temperature of particles and is the resonance frequency in their vertical confinement). This value is much smaller than the standard deviation m. Thus, we conclude that the relative intensity variations are at the level of , which makes them very difficult to detect.
In our experiments we employed an alternative method of particle visualization. The position of the intensity maximum was set about m above the levitation height, so that . This allowed us to overcome both drawbacks mentioned above: (i) particles moved in the region where the vertical gradient of the illumination intensity remained positive (which allowed us to avoid ambiguity in determining the direction of the displacement), and (ii) the relative intensity variations scaled almost linearly with the displacement, , so that the resulting magnitude of was about 15 times larger than that in the “conventional” tracking configuration. It is worth noting that this alternative visualization method does not critically affect the quality of the tracking in the horizontal plane compared to the “conventional” tracking configuration. A separate test has indeed shown that the pixel locking effect is roughly at the same level and that the in-plane fluctuation spectra are similar.
By performing the Fourier transform in time and space of the determined particle velocities, the dispersion relations (both in-plane and out-of-plane) can then be obtained for a 2D crystal.
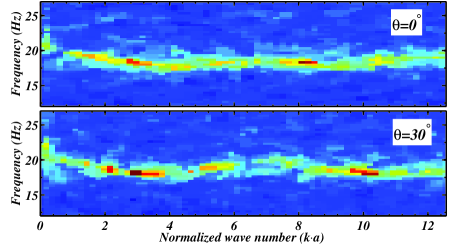
The resulting fluctuation spectra of the out-of-plane waves are shown in Fig. 2 for two principal orientations of the wave vector, at and . The spectra represent the wave energy distribution in the space, so that the “ridge” of this distribution yields the wave dispersion relation. The most conspicuous feature of the measurements is the optical character of the dispersion relation – the frequency of the long-wavelength waves is finite. Moreover, the dispersion at long wavelengths is negative, i.e., the wave frequency falls off as the wave number increases. At larger , the wave dispersion is different for and .
Experimental observation of the out-of-plane wave dispersion is the main result of our paper. Figure 2 shows that the wave frequency as the function of the wave vector changes in a narrow interval of Hz Hz, which makes resolving the wave dispersion a challenging task. Our method, however, allowed us to clearly identify the wave dispersion. Indeed, the frequency resolution of Hz (defined as the standard deviation of a Gaussian fit) is smaller than the measured wave frequency range .
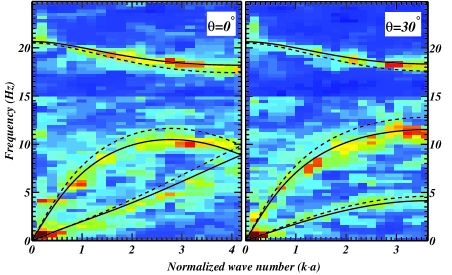
Our method allowed us to measure all three wave modes of a 2D plasma crystal in a single experimental run. In Fig. 3 we show the fluctuation spectra of out-of-plane and in-plane wave modes obtained from the same experiment as in Fig. 2, for two principal lattice orientations, and . Only the first Brillouin zone is shown here. Lines represent theoretical dispersion relations which depend on two lattice parameters – particle charge number and the lattice screening parameter , where is the interparticle distance (lattice constant) and the effective screening length. The theoretical dispersion relations were calculated using the following procedure. First, the lattice parameters were deduced from the low- part of in-plane fluctuation spectra using the method of Ref. Nunomura et al. (2002). The obtained values of and are shown in Table 1 for four different experiments. Second, these values were used in the theory of Ref. Zhdanov et al. (2009) to calculate the whole dispersion curves (the difference between the dashed and solid curves will be discussed later).
| (W) | (Pa) | (m) | (e) | (Hz) | (Hz) | (Hz) | ||
|---|---|---|---|---|---|---|---|---|
| I | 20 | 0.8 | 525 | 14000 | 1.3 | 23.3 | 2.7 | 1.9 |
| II | 15 | 0.8 | 514 | 14200 | 1.0 | 20.5 | 2.9 | 3.1 |
| III | 5 | 0.8 | 1060 | 14600 | 1.3 | 18.3 | 0.6 | 0.4 |
| IV | 5 | 0.9 | 600 | 18000 | 1.0 | 16.3 | 3.7 | 3.9 |
As can be seen in Fig. 3, all three branches of the experimental wave spectra can be simultaneously fitted by theoretical curves calculated with the same set of parameters. This provides a useful consistency check for our experimental method and also for theory. Good overall agreement of our measurements and the theory of Ref. Zhdanov et al. (2009) serves as a verification that our method correctly measures the out-of-plane motion of particles and also as an indication that the theory of Ref. Zhdanov et al. (2009) correctly captures the essential physics of 2D plasma crystals.
The out-of-plane wave mode can also be useful for diagnostic purpose. The lattice parameters and are usually determined by fitting in-plane dispersion relations Nunomura et al. (2002). Another approach is to measure the propagation speed of externally excited pulses Nosenko et al. (2002). But under certain conditions (e.g., near the melting line) it is not practical and one must rely on natural waves and, in this case, in-plane fluctuation spectra can be very noisy. Therefore, the additional fitting of the out-of-plane dispersion relation provides an important complementary tool to check consistency of the measurements. As an example, in Table 1 we compare the experimental frequency range for the out-of-plane mode to the theoretically calculated one Zhdanov et al. (2009). One can see that experimental and theoretical values agree well in most cases (except of experiment III that we discuss later), which is a strong indication that the crystal parameters were measured properly.
Next, we discuss how the out-of-plane waves are affected by the size of the plasma crystal. Theory Ivlev and Morfill (2000); Vladimirov et al. (1997); Zhdanov et al. (2009); Ivlev et al. (2003) suggests that the frequency of the out-of-plane mode varies between and , in a narrow frequency range . It scales with the lattice constant as , where is the (squared) frequency scale of DL waves (it is assumed that ). The exact factor that determines the magnitude of has a relatively weak dependence on (which, in turn, only varies within 30 % in our experiments) and can be obtained from the rigorous theory for a 2D crystal Zhdanov et al. (2009). Thus, for bigger crystals where the lattice constant is smaller (experiments I, II, and IV in Table 1), the phonon frequency range is larger, which makes it easier to resolve in an experiment. In addition, in big crystals the central part that is used for data analysis is fairly homogeneous. In contrast, for small crystals (experiment III in Table 1) the situation is the opposite. The frequency range is small and the fluctuation spectrum is broadened due to the significant variation of within the analysis area. This clearly results in greater discrepancy between experiment III and theory, up to %. Thus, the out-of-plane wave mode can be better studied using bigger crystals.
It is worth mentioning that theory Ivlev and Morfill (2000); Zhdanov et al. (2009); Ivlev et al. (2003) predicts that both the out-of-plane and in-plane modes are affected by the presence of plasma wakes. If we introduce the effective positive charge accumulated in the wake (normalized by the absolute value of particle charge), then the frequency of the in-plane modes is diminished by a factor , whereas the frequency range of the out-of-plane mode, , is proportional to . Figure 3 illustrates this effect: The dashed curves are calculated for a crystal with a pure Yukawa interaction between particles, whereas the solid curves are for the case when the additional particle-wake interactions are taken into account (with ) Ivlev and Morfill (2000); Zhdanov et al. (2009); Ivlev et al. (2003). This “wake correction” apparently improves agreement with the experiments.
Direct observations of the atomistic dynamics in “regular” 2D or quasi-2D systems (such as carbon nanotubes Popov and Lambin (2006) and graphite Saito et al. (2001)) are inhibited, and therefore experimental measurements of phonon spectra in such systems rely on indirect methods, e.g., Raman scattering technique Kawashima and Katagiri (1999); Saito et al. (2001). Natural model systems, such as crystalline complex plasmas, provide us with a unique opportunity to study generic properties of wave modes sustained in classical strongly coupled ensembles, explore limits of small “nano”-clusters, investigate peculiarities of the atomistic dynamics upon nonlinear mode coupling, etc. As compared to previously reported investigations of wave modes in 2D plasma crystals, the results presented in this Letter show a substantial improvement of the particle imaging technique. It allowed us for the fist time to directly observe the optical phonon spectrum which has been predicted a long time ago. This development gives us strong grounds to believe that the direct observation of optical modes will allow much better discrimination of various subtle mechanisms affecting wave modes in 2D crystalline systems.
The authors thank U. Konopka, B. Klumov, and D. Samsonov for valuable discussions.
References
- Fortov et al. (2005) V. E. Fortov et al., Phys. Rep. 421, 1 (2005)
- Fortov et al. (2004) V. E. Fortov, et al., Phys.-Usp. 47, 447 (2004).
- Couëdel et al. (2008) L. Couëdel et al., EPL 84, 35002 (2008)
- Thomas et al. (1994) H. Thomas et al., Phys. Rev. Lett. 73, 652 (1994).
- Popel et al. (2003) S. I. Popel et al., Phys. Rev. E 67, 056402 (2003).
- Nunomura et al. (2002) S. Nunomura et al., Phys. Rev. Lett. 89, 035001 (2002).
- Nunomura et al. (2000) S. Nunomura, D. Samsonov, and J. Goree, Phys. Rev. Lett. 84, 5141 (2000).
- Nunomura et al. (2005) S. Nunomura et al., Phys. Rev. Lett. 94, 045001 (2005).
- Wang et al. (2001) X. Wang, A. Bhattacharjee, and S. Hu, Phys. Rev. Lett. 86, 2569 (2001).
- Nosenko et al. (2009a) V. Nosenko et al., Phys. Rev. Lett. 103, 015001 (2009a).
- Nosenko et al. (2002) V. Nosenko, S. Nunomura, and J. Goree, Phys. Rev. Lett. 88, 215002 (2002).
- Vladimirov et al. (2006) S. V. Vladimirov, V. V. Yaroshenko, and G. E. Morfill, Phys. Plasmas 13, 030703 (2006).
- Samsonov et al. (2005) D. Samsonov, S. Zhdanov, and G. Morfill, Phys. Rev. E 71, 026410 (2005).
- Ivlev and Morfill (2000) A. V. Ivlev and G. Morfill, Phys. Rev. E 63, 016409 (2000).
- Vladimirov et al. (1997) S. V. Vladimirov, P. V. Shevchenko, and N. F. Cramer, Phys. Rev. E 56, R74 (1997).
- Dubin (1993) D. H. E. Dubin, Phys. Rev. Lett. 71, 2753 (1993).
- Qiao and Hyde (2003) K. Qiao and T. W. Hyde, Phys. Rev. E 68, 046403 (2003).
- Zhdanov et al. (2009) S. K. Zhdanov, A. V. Ivlev, and G. E. Morfill, Mode-coupling instability of 2D plasma crystals, Phys. Plasmas, accepted (2009).
- Ivlev et al. (2003) A. V. Ivlev et al., Phys. Rev. E 68, 026405 (2003).
- Nosenko et al. (2009b) V. Nosenko et al., Rotating electric fields in complex (dusty) plasmas, Phys. Plasmas, submitted (2009b).
- Rogers et al. (2007) S. S. Rogers et al., Physical Biology 4, 220 (2007).
- Popov and Lambin (2006) V. N. Popov and P. Lambin, Phys. Rev. B 73, 085407 (2006).
- Saito et al. (2001) R. Saito et al., Phys. Rev. Lett. 88, 027401 (2001).
- Kawashima and Katagiri (1999) Y. Kawashima and G. Katagiri, Phys. Rev. B 59, 62 (1999).