11email: aalonso@damir.iem.csic.es 22institutetext: I. Physikalisches Institut, Universität zu Köln, Zülpicher Strasse 77, 50937 Köln, Germany 33institutetext: European Organisation for Astronomical Research in the Southern Hemisphere, Karl-Schwarzschild-Strasse 2 D-85748 Garching bei München, Germany 44institutetext: Centro de Astrobiología (CSIC-INTA), P.O. Box 78, E-28691 Villanueva de la Cañada, Madrid, Spain
PMAS optical integral field spectroscopy of luminous infrared galaxies.
Abstract
Context. Luminous and ultraluminous infrared galaxies (LIRGs and ULIRGs) are key cosmological classes since they account for most of the co-moving star formation rate density at . It is then important to have detailed studies of local samples of their counterparts for understanding the internal and dynamical processes taking place at high-.
Aims. To characterize the two-dimensional morphological, excitation and kinematic properties of LIRGs and ULIRGs we are carrying out an optical integral field spectroscopy (IFS) survey of local () samples.
Methods. In this paper we present optical (3800-7200Å) IFS with the Potsdam multi-aperture spectrophotometer (PMAS) of the northern hemisphere portion of a volume-limited () sample of 11 LIRGs. The PMAS IFS observations typically cover the central kpc and are complemented with our own existing HST/NICMOS images.
Results. For most LIRGs in our sample, the peaks of the continuum and gas (e.g., H, [N ii]6584) emissions coincide, unlike what is observed in local, strongly interacting ULIRGs. The only exceptions are galaxies with circumnuclear rings of star formation where the most luminous H emitting regions are found in the rings rather than in the nuclei of the galaxies, and the displacements are well understood in terms of differences in the stellar populations. A large fraction of the nuclei of these LIRGs are classified as LINER and intermediate LINER/HII, or composite objects, which is a combination of starformation and AGN activity. The excitation conditions of the integrated emission depend on the relative contributions of H ii regions and the diffuse emission to the line emission over the PMAS FoV. Galaxies dominated by high surface-brightness H ii regions show integrated H ii-like excitation. A few galaxies show slightly larger integrated [N ii]6584/H and [S ii]6717,6731/H line ratios than the nuclear ones, probably because of more contribution from the diffuse emission. The H velocity fields over the central few kpc are generally consistent, at least to first order, with rotational motions. The velocity fields of most LIRGs are similar to those of disk galaxies, in contrast to the highly perturbed fields of most local, strongly interacting ULIRGs. The peak of the H velocity dispersion coincides with the position of the nucleus and is likely to be tracing mass. All these results are similar to the properties of LIRGs, and they highlight the importance of detailed studies of flux-limited samples of local LIRGs.
Key Words.:
Galaxies: evolution — Galaxies: nuclei — Galaxies: Seyfert — Galaxies: active — Galaxies: structure — Infrared: galaxies1 Introduction
In recent years deep cosmological surveys have been extremely successful in identifying large samples of high- galaxies using specific wavelengths (e.g., UV, optical, infrared, submillimeter) or combinations of them. Luminous infrared galaxies (LIRGs, with infrared m luminosities , see Sanders & Mirabel 1996) and ultraluminous infrared galaxies (ULIRGs, with IR luminosities , see Lonsdale, Farrah, & Smith 2006) are significant cosmological classes. These IR-selected galaxies are the main contributors to the co-moving star formation rate density of the universe at (Elbaz et al. 2002; Le Floc’h et al. 2005; Pérez-González et al. 2005; Caputi et al. 2007).
Because these high- samples are so numerous, most efforts concentrate on characterizing their integrated properties, such as stellar masses, star formation rates, average ages, and metallicities. However, to understand fully how galaxies formed and evolved, one needs spatially resolved information to study their kinematics, stellar populations, the star, gas, and dust distributions, as well as the gas excitation conditions. At high- this has been done for optically/UV selected galaxies using integral field spectroscopy (IFS). These works find clumpy H morphologies with relatively well-ordered velocity fields that are consistent with the presence of large disks at , while other systems are better explained as merger candidates (see e.g., Förster-Schreiber et al. 2006; Genzel et al. 2006, 2008; Wright et al. 2009). A similar result is found at intermediate redshifts (Puech et al. 2008; Yan et al. 2008).
In the local universe LIRGs and ULIRGs are much less numerous than at high-, and a large amount of work has already been done to characterize their properties using optical long-slit spectroscopy (e.g., Heckman, Armus, & Miley 1987; Armus, Heckman, & Miley 1989; Kim et al. 1995, 1999; Veilleux et al. 1995, 1999; Wu et al. 1998; Heckman et al. 2000; Rupke, Veilleux & Sanders 2005; Chen et al. 2009). The majority of optical and near-IR IFS works have so far focused on small samples of (U)LIRGs or individual galaxies (e.g., Arribas, Colina, & Clements 2001; Murphy et al. 2001; Lípari et al. 2004a,b; Colina, Arribas, & Monreal-Ibero 2005; Monreal-Ibero, Arribas, & Colina 2006; García-Marín et al. 2006; Reunanen, Tacconi-Garman, & Ivanov 2007). The work of Shapiro et al. (2008) has recently highlighted the importance of having local templates for understanding the internal and dynamical processes taking place at high-. We note, however, that care is needed when comparing local IR luminosity matched galaxies with high- systems. For instance, at the mid-IR spectra of star-forming ULIRGs are more similar to those of local starbursts and LIRGs than to those of local ULIRGs (Farrah et al. 2008; Rigby et al. 2008; Alonso-Herrero et al. 2009). One possible explanation is that in high- ULIRGs star formation is taking place over larger scales, a few kpc, than in local ULIRGs where most of the infrared emission arises from sub-kpc scale regions (e.g., Soifer et al. 2000). In contrast intermediate redshift () LIRGs appear to be experiencing similar starburst phases to those of local LIRGs (Marcillac et al. 2006). We thus need to understand the spatially-resolved physical processes and properties of local (U)LIRGs and compare them with those of distant IR-selected galaxies.
| Galaxy | Dist | Date | Galaxy | Sky | Airmass | Seeing | Conditions | |
|---|---|---|---|---|---|---|---|---|
| (1) | (2) | (3) | (4) | (5) | (6) | (7) | (8) | (9) |
| NGC 23 | 59.6 | 11.05 | 7 Nov 2005 | 1000 | 1.06 | P | ||
| MCG +12-02-001 | 64.3 | 11.44 | 18 Dec 2006 | 1000 | 1.47 | 1.7 | NP | |
| UGC 1845 | 62.0 | 11.07 | 8 Nov 2005 | 900 | 1.05 | NP | ||
| NGC 2388 | 57.8 | 11.23: | 7 Nov 2005 | 1000 | 1.04 | P | ||
| MCG +02-20-003 | 67.6 | 11.08: | 17 Dec 2006 | 1.60 | 1.2 | NP | ||
| IC 860 | 59.1 | 11.17: | 29 May 2006 | 1000 | 1.03 | 1.7 | NP | |
| NGC 5936 | 60.8 | 11.07 | 30 May 2006 | 1000 | 1.17 | 1.5 | NP | |
| NGC 6701 | 56.6 | 11.05 | 30 May 2006 | 800 | 1.09 | 1.3 | NP | |
| NGC 7469 | 65.2 | 11.59 | 8 Nov 2005 | 900 | 1.15 | 1.2 | NP | |
| NGC 7591 | 65.5 | 11.05 | 8 Nov 2005 | 1000 | 1.32 | NP | ||
| NGC 7771-E | 57.1 | 11.34 | 7 Nov 2005 | 1000 | 1.15 | 0.8 | P | |
| NGC 7771-W | 7 Nov 2005 | 1000 | 1.06 | 0.8 | P |
Notes.— Column (1): Galaxy. For NGC 7771 we took two different pointings to cover the approximate central region of the galaxy, as explained in the text. Columns (2) and (3): Distance (in Mpc) and IR luminosity (in L⊙) taken from Sanders et al. (2003) for the IRAS RBGS. Column (4): Date of the observations. Column (5): Integration time (in seconds) of the galaxy observations after discarding bad data sets. Column (6): Integration time (in seconds) of the sky observations. Column (7): Airmass at the beginning of the observation. Column (8): Typical seeing conditions (in arcseconds) of the observations. If two values of the seeing are given they correspond to the beginning and the end of the observations. Column (9): Observing conditions. P: Photometric. NP: Non-photometric.
We recently started an optical IFS survey of a representative sample of approximately 70 nearby () LIRGs and ULIRGs (see Arribas et al. 2008). The general goal of this survey is to provide a two-dimensional, as opposed to integrated or nuclear, characterization of the physical and dynamical processes taking place in local LIRGs and ULIRGs. As discussed in detail by Arribas et al. (2008), we are conducting this survey using three different optical IFS instruments in both the northern and the southern hemispheres. These are: VIMOS (Le Févre et al. 2003) on the VLT, the INTEGRAL+WYFFOS system (Arribas et al. 1998; Bingham et al. 1994) on the William Herschel Telescope, and the Potsdam multi-aperture spectrophotometer (PMAS, Roth et al. 2005) instrument on the 3.5 m telescope at Calar Alto (Spain). In this paper we present an atlas of the IFS observations obtained with PMAS for the northern hemisphere portion of the volume-limited sample of LIRGs of Alonso-Herrero et al. (2006), which is part of the larger survey of Arribas et al. (2008). Additionally, we are observing a representative sample with near-infrared IFS (Bedregal et al. 2009) using SINFONI (Eisenhauer et al. 2003) on the VLT.
The paper is organized as follows. Sect. 2 gives details on the sample, the observations and the data reduction. Sect. 3 presents the analysis of the PMAS IFS data. Sects. 4, 5, and 6, discuss the general results on the morphologies of the emission lines and continuum, the nuclear and integrated 1D spectra, and the kinematics of the ionized gas, respectively. The discussion and summary of this work are given in Sect. 7. Throughout this paper we used .
2 Observations
2.1 The Sample
We observed the majority of the northern hemisphere galaxies (see Table 1) from the volume-limited representative sample of local LIRGs of Alonso-Herrero et al. (2006). This sample was drawn from the IRAS Revised Bright Galaxy Sample (RBGS, Sanders et al. 2003). The Alonso-Herrero et al. (2006) sample is limited in distance (velocities of or distances of Mpc for the assumed cosmology) so that the Pa emission line at rest-frame wavelength m could be observed with the NICMOS F190N narrow band filter (see Sect. 2.3 and Alonso-Herrero et al. 2000a, 2006 for full details). Arp 299, the most luminous system in this LIRG sample, was observed with the IFS INTEGRAL instrument and analyzed in detail by García-Marín et al. (2006). For the sake of completeness we will include Arp 299 () in the discussions presented in Sects. 4, 5, and 6. Our sample of LIRGs covers a range in infrared luminosities of . The average infrared luminosity of the full sample (northern and southern hemispheres) is or . Except for Arp 299, which is a strongly interacting system, the rest of the northern hemisphere LIRGs in this sample are apparently isolated galaxies, weakly interacting systems (e.g., NGC 7469, NGC 7771) and galaxies with small companions but no clear morphological signs of interaction (e.g., NGC 6701, see Márquez et al. 1996).
2.2 PMAS Optical Integral Field Spectroscopy Observations
We obtained optical IFS of 11 LIRGs using PMAS on the 3.5 m telescope at the German-Spanish Observatory of Calar Alto (Spain) during three observing runs: November 2005, May 2006, and December 2006. The PMAS observations were taken with the Lens Array Mode configuration which is made of a array of microlenses coupled with fibers called hereafter spaxels. We used the 1″ magnification which provides a field of view (FoV) of . We used the V300 grating with a dispersion of Å pixel-1 and an approximate spectral range of 3400 Å. The wavelength range covered by the observations was approximately Å. The approximate spectral resolution of the spectra in the binned mode is 6.8 Å full width half maximum (FWHM, see also Sect. 3.1).
2.2.1 Observing procedure
The total integration time for each galaxy was split into three or four individual galaxy exposures (see Table 1), each of which having between 400 and 1000 s. Given the relatively small FoV of PMAS in the Lens Array configuration and the large extent of the galaxies, we obtained a separate sky integration for each galaxy, interleaved with the galaxy observations and with a comparable single exposure time of 900 or 1000 s. For all the galaxies we obtained one pointing, except for NGC 7771 for which we took two pointings to cover the approximate central region.
Table 1 gives for each target the observing campaign, integration times for the individual galaxy exposures and number of exposures, integration time, seeing conditions for each data set, as well as the airmasses of the observations. The typical seeing conditions of the observations varied between 0.8″ and 1.7″, depending on the observing campaign.
During each night we obtained calibration arcs and lamps, and flat-fields. Since PMAS is located at the Cassegrain focus, it is affected by the changing flexures of the telescope when tracking the targets. Therefore, we obtained individual arc and internal lamps exposures for each different pointing, when applicable before and after culmination of the target. The lamps used were a ThAr lamp for the Nov 2005 and May 2006 campaigns, and a HgNe lamp for the Dec 2006 campaign. Additionally throughout the nights we observed spectrophotometric standard stars to correct for the instrument response, and to flux calibrate the data. We note, however that conditions were non-photometric for several nights in all the campaigns (see Table 1).
2.2.2 Data reduction
The PMAS data were reduced using a set of customized scripts under the IRAF111IRAF software is distributed by the National Optical Astronomy Observatory (NOAO), which is operated by the Association of Universities for Research in Astronomy (AURA), Inc., in cooperation with the National Science Foundation. environment. The first step of the data reduction was to determine and subtract the bias level. Next, using reference internal continuum lamp exposures, we identified and traced the location of each of the 256 spectra along the dispersion direction of the CCD. Once we extracted the individual spectra, the third reduction step was the wavelength calibration, which we carried out using a model obtained from arc lamp exposures. We checked the wavelength calibration against known sky emission lines and measured a median standard deviation of 1.8, 2.0, and 1.8Å for the Nov 2005, May 2006, and Dec 2006 observing runs, respectively. The fourth step was to correct for the sensitivity variations by creating a response image using internal calibration lamp images and a sky flat exposure. After that, a relative flux calibration was performed using standard star observations. The next step was to combine the different galaxy exposures (a minimum of three) for each individual pointing to improve the signal-to-noise ratio and to remove cosmic rays. The sky subtraction was done on a spaxel-by-spaxel basis using for each galaxy its own sky observation. The final step was to build the data cubes and rotate them to the north up, east to the left orientation.
| Galaxy | Type | Size | [OIII]/H | [OI]/H | [NII]/H | [SII]/H |
|---|---|---|---|---|---|---|
| (1) | (2) | (3) | (4) | (5) | (6) | (7) |
| NGC 23 | Nuclear | 0.28 | 1.52 | 0.091 | 0.87 | 0.48 |
| Integrated | 4.5 | 0.58 | 0.044 | 0.57 | 0.33 | |
| MCG +12-02-001 | Nuclear | 0.31 | 0.67 | 0.029 | 0.44 | 0.30 |
| Integrated | 5.8 | 0.61 | 0.030 | 0.42 | 0.35 | |
| UGC 1845 | Nuclear | 0.30 | 2.07 | 0.090 | 1.09 | 0.33 |
| Integrated | 3.2 | 1.33 | 0.065 | 0.72 | 0.28 | |
| NGC 2388 | Nuclear | 0.28 | 0.32 | 0.029 | 0.63 | 0.22 |
| Integrated | 5.1 | 0.60 | 0.066 | 0.56 | 0.30 | |
| MCG +02-20-003 | Nuclear | 0.33 | 0.67 | 0.054 | 0.63 | 0.37 |
| Integrated | 6.5 | 0.65 | 0.046 | 0.45 | 0.43 | |
| IC 860 | Nuclear | 0.29 | 7.81 | 3.85 | ||
| NGC 5936 | Nuclear | 0.30 | 0.32 | 0.031 | 0.63 | 0.22 |
| Integrated | 4.7 | 0.24 | 0.034 | 0.48 | 0.25 | |
| NGC 6701 | Nuclear | 0.27 | 0.68 | 0.065 | 0.72 | 0.35 |
| Integrated | 5.2 | 0.62 | 0.054 | 0.67 | 0.35 | |
| NGC 7469∗ | Nuclear | 0.32 | 9.96 | 0.13 | 4.10 | 0.39 |
| Integrated | 6.1 | 3.53 | 0.048 | 0.55 | 0.30 | |
| NGC 7591 | Nuclear | 0.32 | 0.98 | 0.11 | 0.96 | 0.41 |
| Integrated | 5.1 | 0.85 | 0.85 | 0.59 | ||
| NGC 7771 | Nuclear | 0.28 | 0.22 | 0.032 | 0.40 | 0.21 |
| Integrated | 8.0 | 0.42 | 0.55 | 0.43 |
Notes.— Column (2): PMAS type of 1D spectra. Column (3): Linear physical size in kpc covered by the PMAS extraction apertures for the nuclear and integrated spectra using the distances given by Sanders et al. (2003) for the IRAS RBGS. Columns (4), (5), (6), and (7): Observed (not corrected for extinction and/or stellar absorption) line ratios. ∗For NGC 7469 the line ratios correspond to the narrow components of the hydrogen recombination lines.
2.3 HST/NICMOS Observations
The HST/NICMOS observations were obtained with the NICMOS NIC2 camera, which has a pixel size of 0.076″ and a FoV of . Details on the observations and data reduction procedures can be found in Alonso-Herrero et al. (2006). For this paper we make use of the m continuum observations and the continuum-subtracted Pa images for comparison with the PMAS data. The only additional step needed for the NICMOS images was to rotate and trim them to match the orientation and FoV, respectively, of the PMAS images. The angular resolution of the NICMOS data is approximately and (FWHM) for the m continuum and Pa images, respectively.
3 IFS Data Analysis
3.1 Spectral maps
We constructed spectral maps of the brightest emission lines by fitting the lines to Gaussian functions and the adjacent continuum to straight lines, on a spaxel-by-spaxel basis. To do so we developed our own routines which make use of the IDL-based MPFITEXPR algorithm222http://www.purl.com/net/mpfit developed by Markwardt (2008) to measure in an automated fashion the central wavelength, the width of the Gaussian (), and integrated flux for each emission line. Using this algorithm we were also able to fix the relative wavelengths and line ratios according to atomic parameters when fitting multiple emission lines ([N ii]6548, H, [N ii]6584, and [S ii]6717,6731). Additionally for each of the two sets of lines we imposed that the lines had the same width. We did not attempt to correct the maps of the H emission line for the presence of H in absorption, which is observed in most of the spectra of the sample of LIRGs (see also Sect. 3.2).
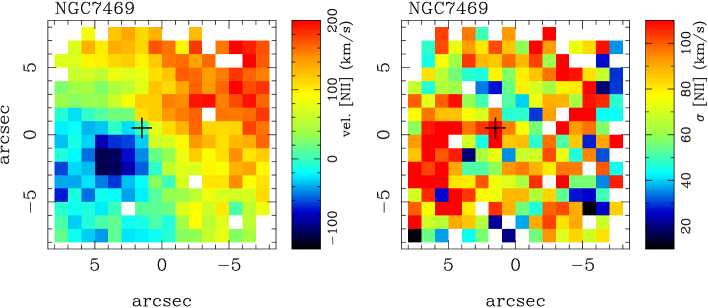
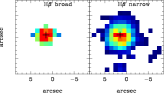
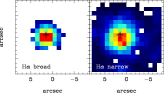
The spectral maps of the emission line fluxes, as well as the maps of the central wavelength (or velocity field), and (or velocity dispersion) were only constructed for those spaxels whose integrated line flux was above the local continuum, where was the standard deviation of the fitted local continuum. We found that the emission lines of all galaxies were adequately fitted with one component (Fig. 1), except for NGC 7469, a well-known Seyfert 1 galaxy, for which we fitted the hydrogen recombination lines using a broad and a narrow component. The maps of both components are shown in Fig. 2.
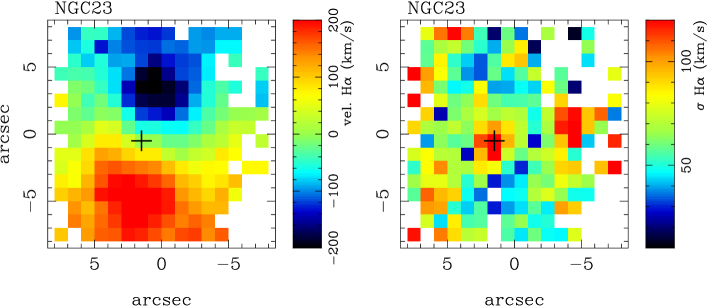
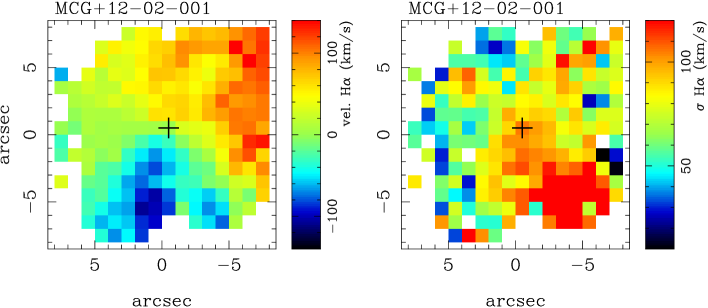
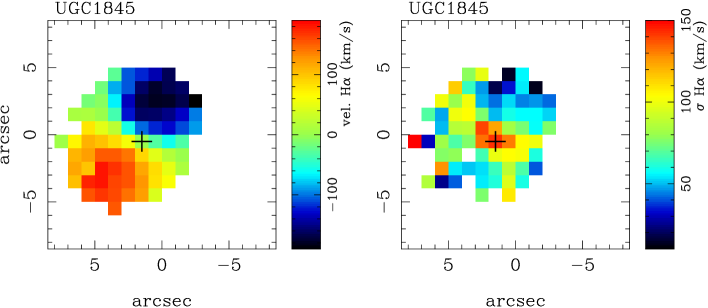
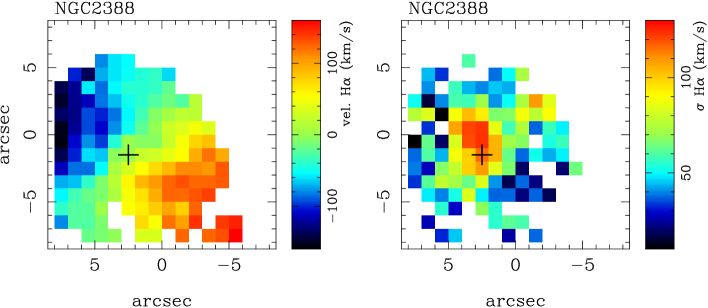
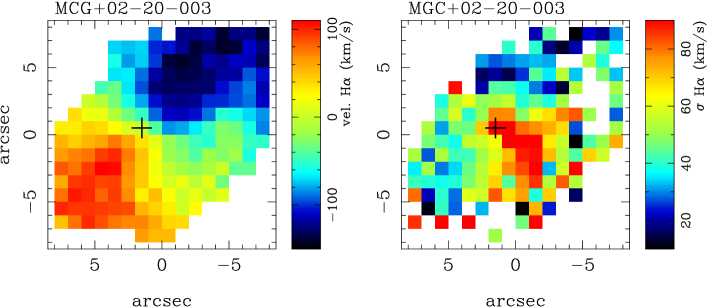
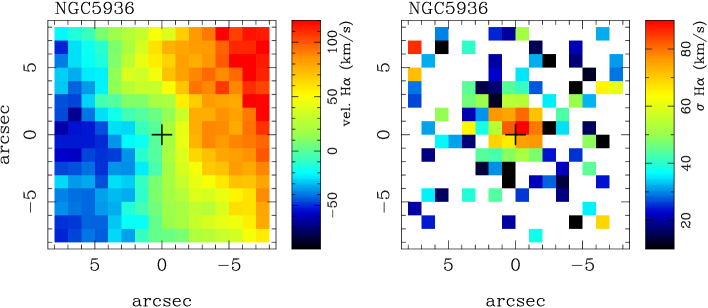
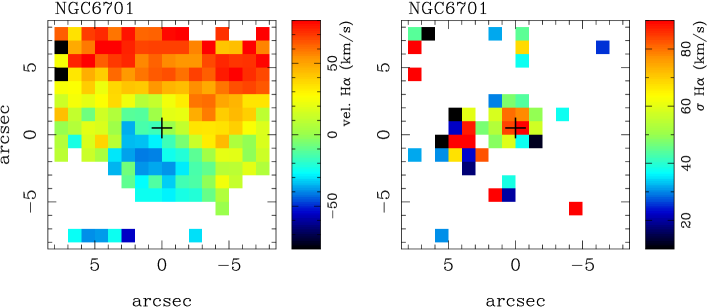
The uncertainties of the measured velocities and velocity dispersions depend on the errors in measuring the centroid and width of the emission line, which in turn depend on the signal-to-noise of the spaxel, and the systematic errors (e.g., the wavelength calibration, see Sect. 2.2). The typical errors in measuring the widths of the Gaussians when fitting the H+[N ii] lines were 10%. The maps of the observed H velocity dispersion () were corrected for the instrumental resolution () using . For each observing campaign we measured the instrumental resolution on a spaxel-by-spaxel basis using the observations of the arc emission lines at a wavelength close to that of H. The median instrumental resolution across the detector near H is Å for all three observing runs. The H velocity fields and the maps of the H velocity dispersion are shown in the left and right panels, respectively, of Fig. 3.
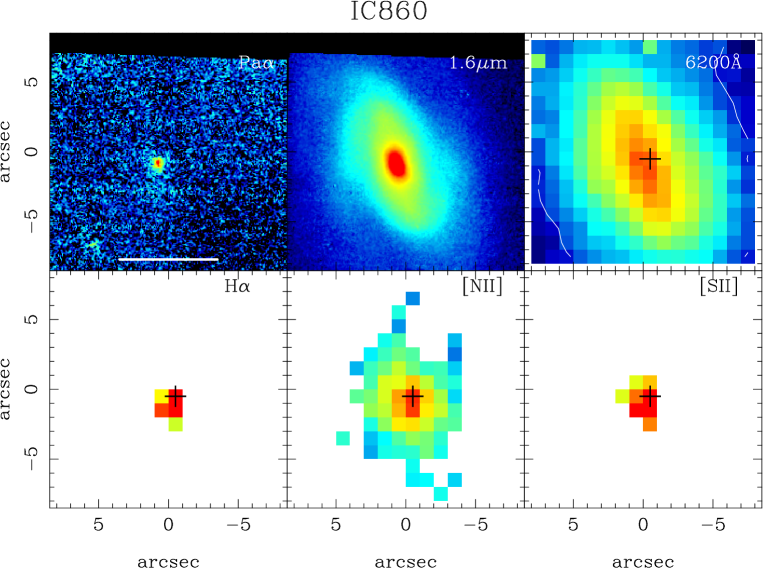
Since the emission lines observed in IC 860 are faint, we decided to fit the H+[N ii] and the [S ii] lines (H, [O iii]5007 and [O i]6300 were not detected) manually using splot within iraf without any constraints. The spectral maps for this galaxy are shown in Fig. 1f. As can be seen from this figure, the H and [S ii] lines are only detected in the nuclear regions, whereas the [N ii]6584 emission line is more extended.
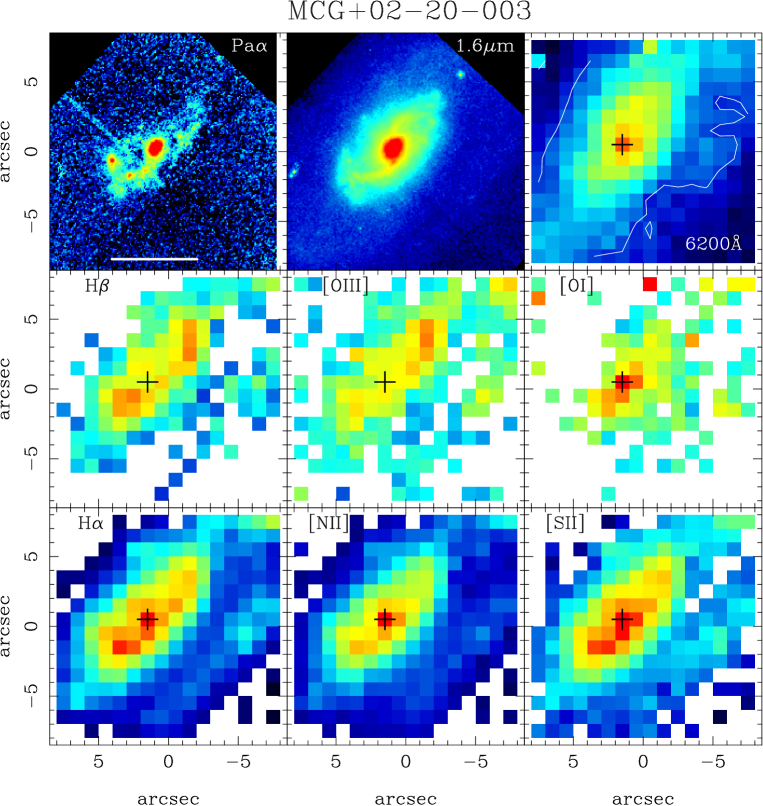
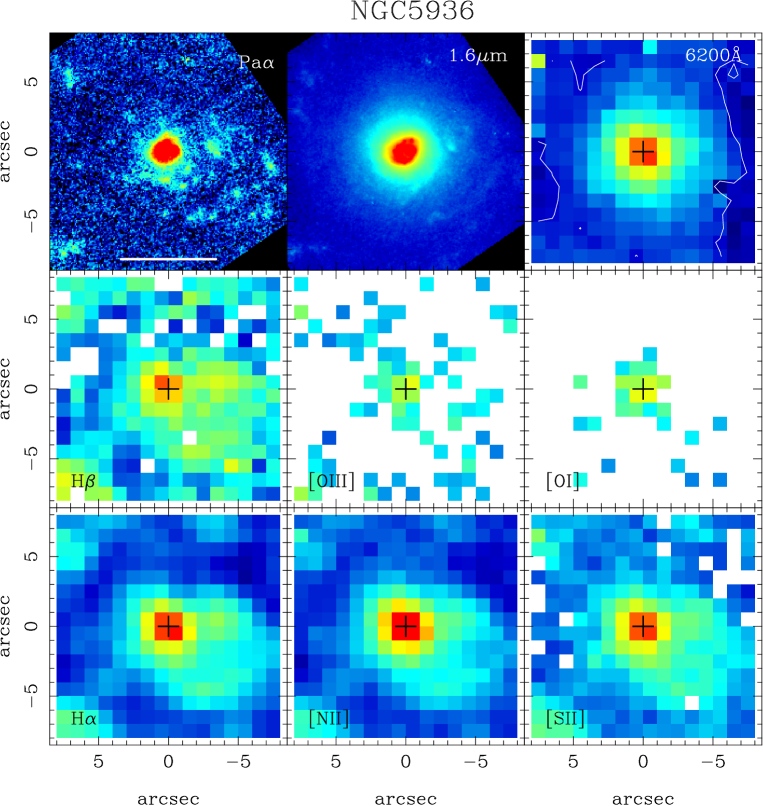
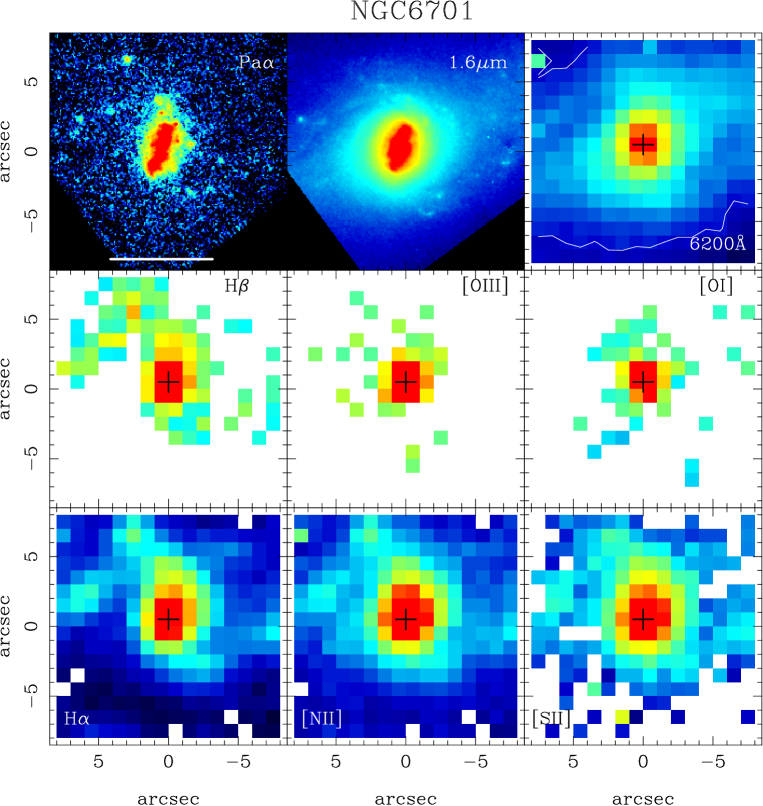
In addition to fitting the brightest emission lines for each galaxy, we constructed a continuum image centered at Å by summing up the continuum spectra over a rectangular band width of approximately 17 Å. Fig. 1 shows the continuum maps for our sample of LIRGs. The peak of the optical continuum emission is marked with a cross for each galaxy on the PMAS maps in this figure as well as in Figs. 2 and 3.
As explained in Sect. 2.1.1, for NGC 7771 we took two separate pointings to cover the approximate central region of the galaxy. The systematic error of telescope offsets with PMAS is given by the astrometric accuracy of the PMAS Acquisition and Guiding (A&G) system, which has been determined to be /pixel (Roth et al. 2005). As the A&G system is an integral part of the instrument, systematic offset errors are negligible. The statistical accuracy of the auto-guider is a fraction of a pixel, and the canonical value is r.m.s. (Roth, 2009, private communication). Thus, we used the offsets commanded using the PMAS acquisition images to construct mosaics of the emission line and continuum maps, as well as the H velocity fields and maps of the velocity dispersion.
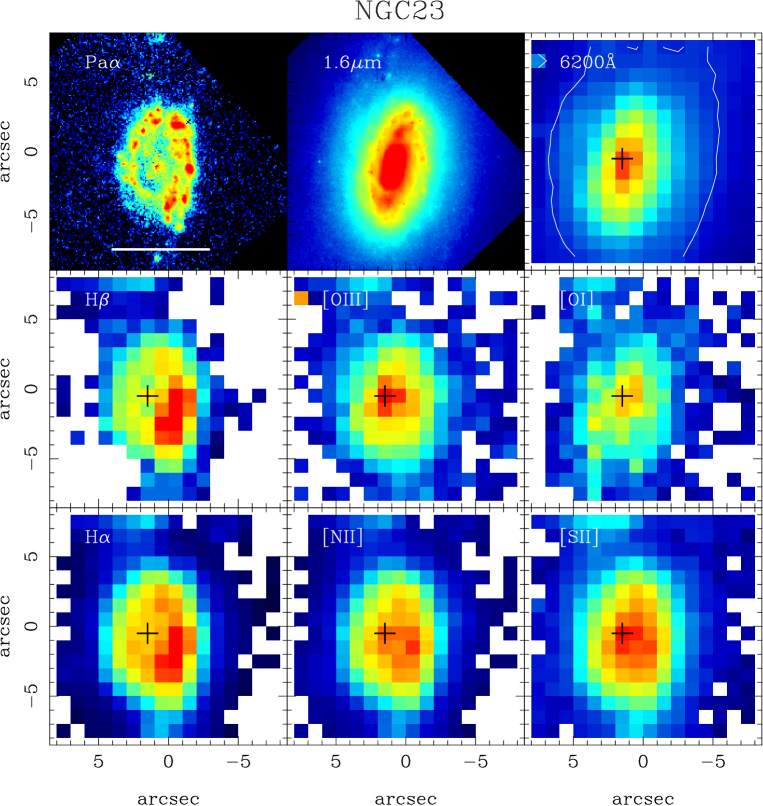
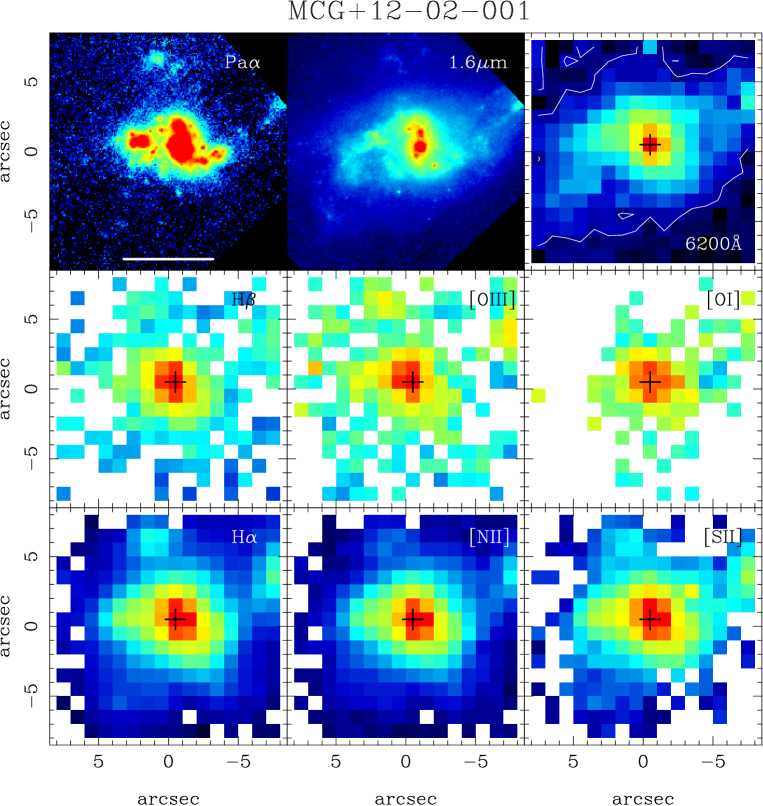
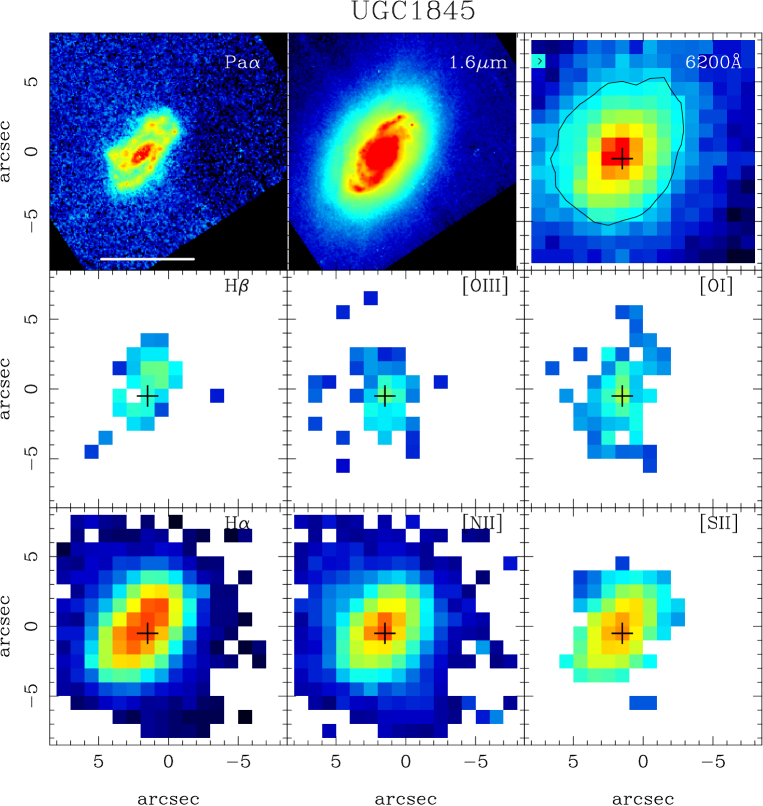
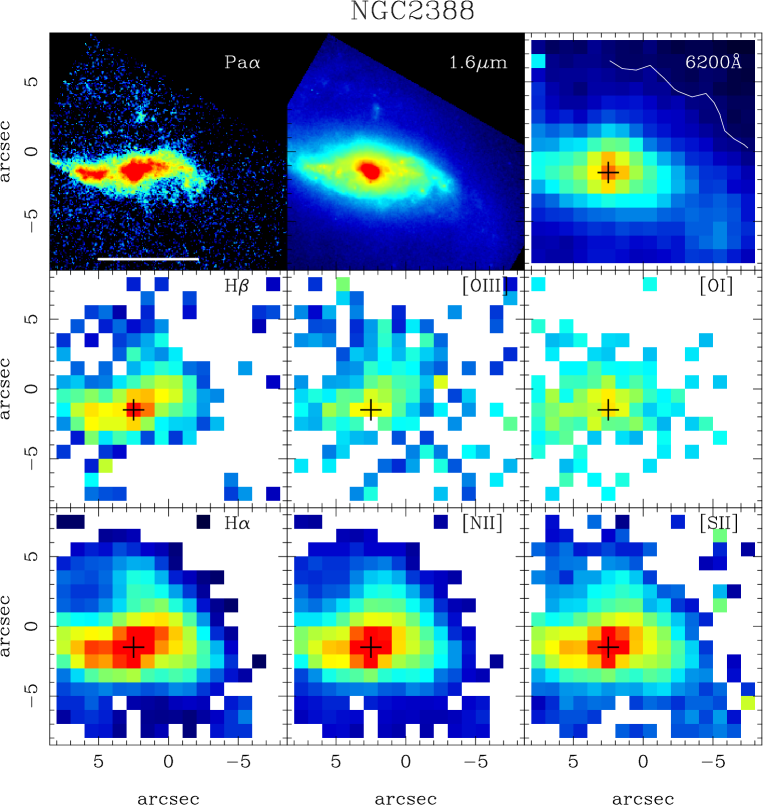
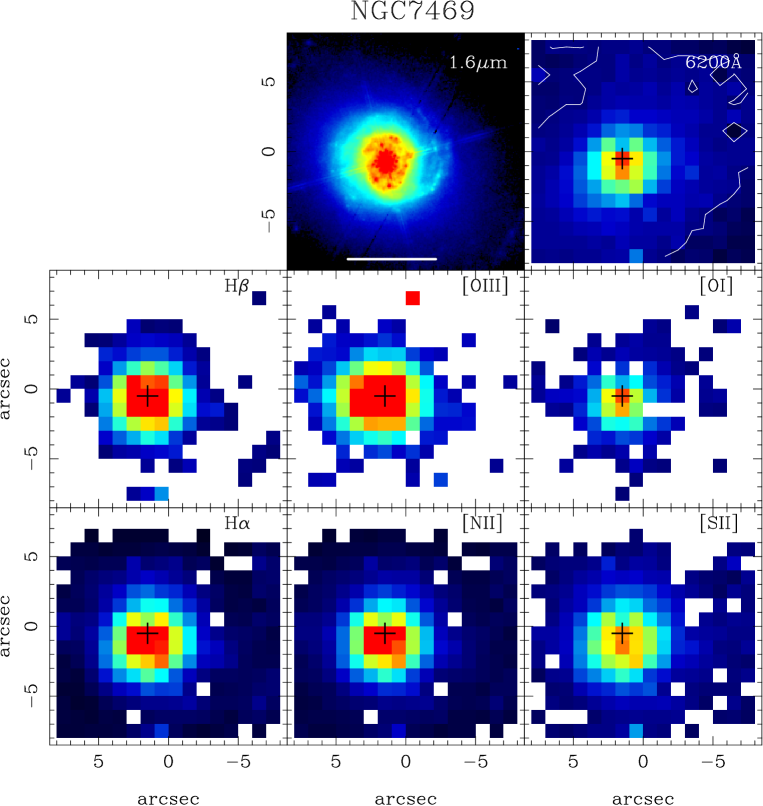
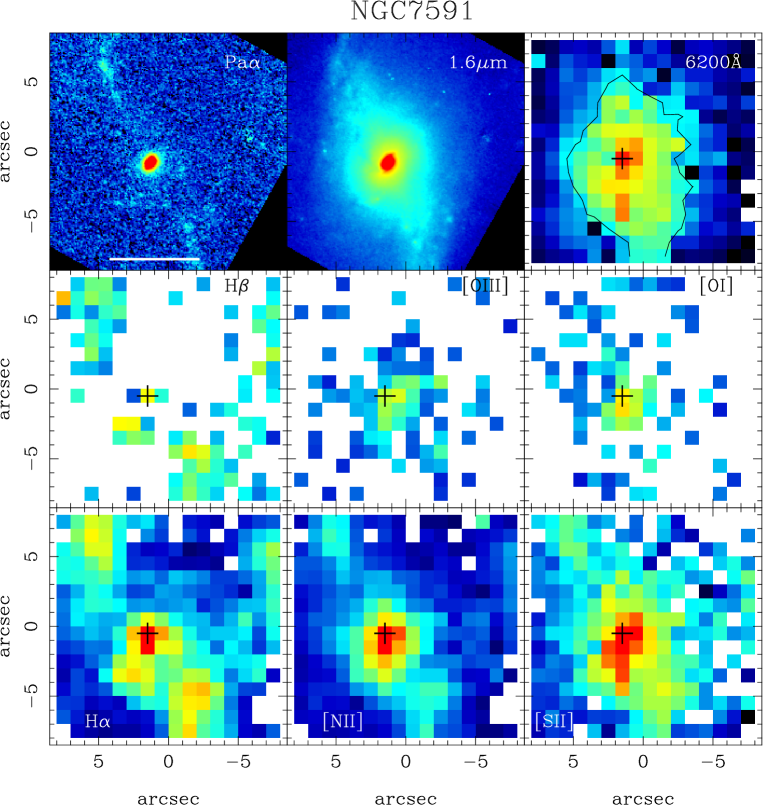
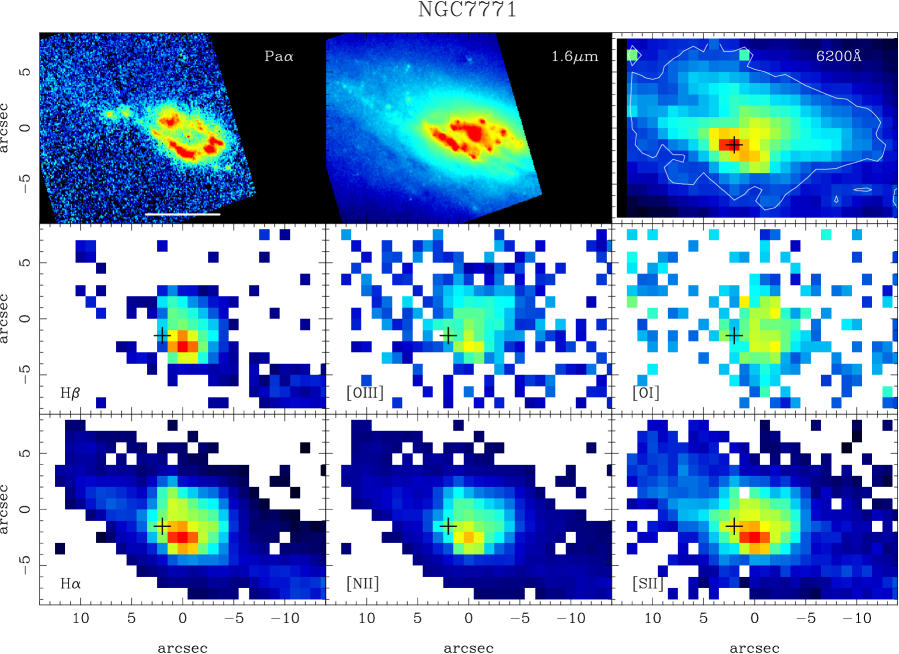
Fig. 1 shows for the 11 LIRGs in our sample the PMAS maps of the brightest optical emission lines, the HST/NICMOS continuum subtracted Pa images, together with images of the stellar emission at Å (PMAS) and at m (NICMOS). Since the PMAS images do not have astrometry, the PMAS and NICMOS images were registered by using the peaks and shapes of the continua for reference. For the typical distances of our galaxies the FoV of the PMAS observations cover the central kpc, except for NGC 7771 for which the PMAS mosaics cover approximately the central . The maps are shown on a square root scale to maximize the contrast between diffuse and bright regions.
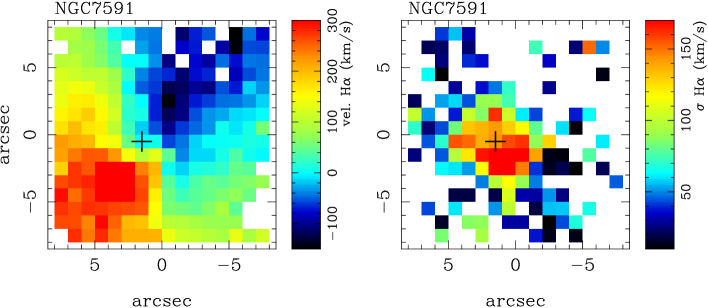
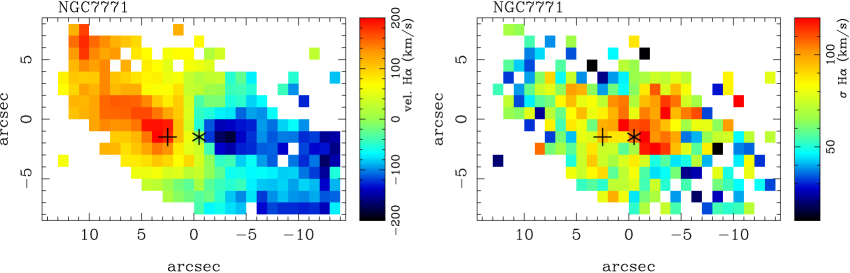
The observed H velocity fields for all the LIRGs in our sample except for IC 860 are shown in Fig. 3. For NGC 7469 we show the [N ii]6584 velocity field instead, as that of H is affected by the uncertainties associated with fitting the broad and narrow components. The zero points of the velocity fields are set at the peak of the 6200 Å continuum emission. The only exception is NGC 7771 where the zero point is placed at the position that makes the velocity field gradient symmetric, and it is approximately coincident with the peak of the near-infrared continuum. Table 3 gives the measured H for the nuclei of our sample of LIRGs.
3.2 Extraction of 1D spectra
For each galaxy we extracted two 1D spectra: the nuclear spectrum and the integrated spectrum. The nuclear spectra correspond to the spaxel at the peak of the 6200 Å continuum emission. The physical size covered by the nuclear spectrum is given for each galaxy in Table 2, and it is typically the approximate central 300 pc. For reference the nuclear spectra of Kim et al. (1995) and Veilleux et al. (1995) were extracted with a linear physical size of 2 kpc (see discussion in Sect. 5).
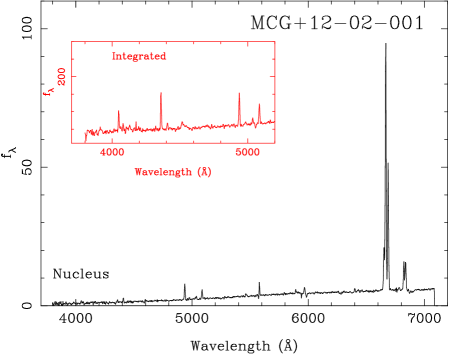
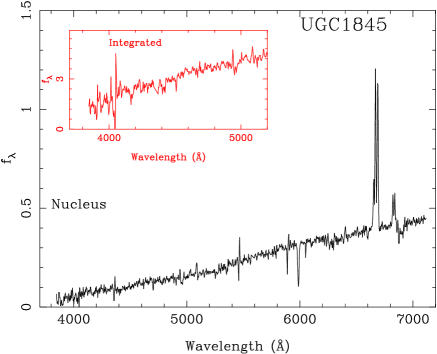
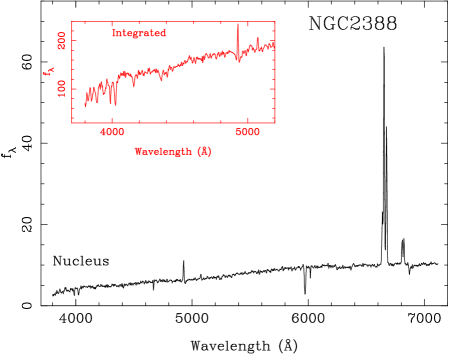
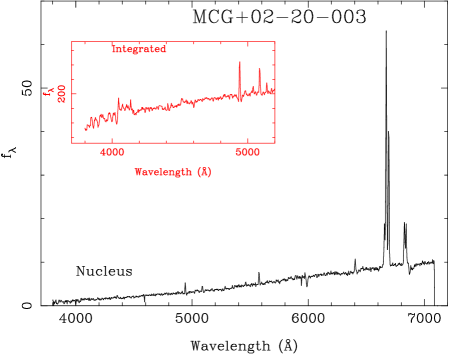
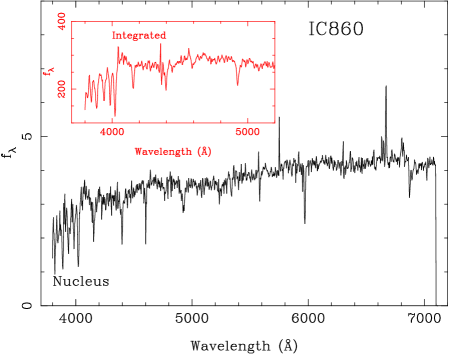
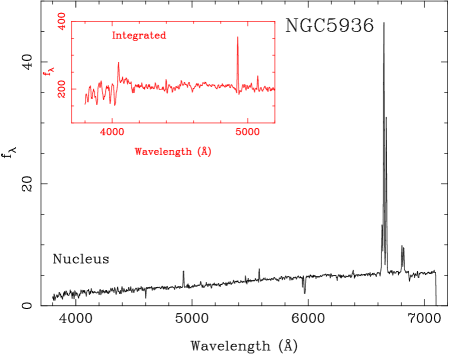
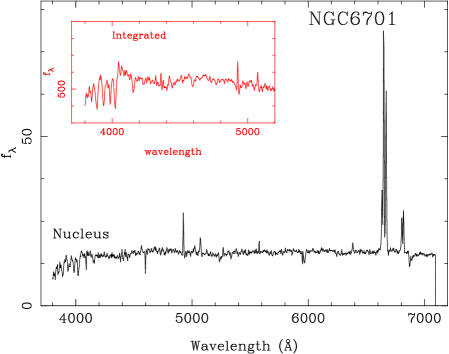
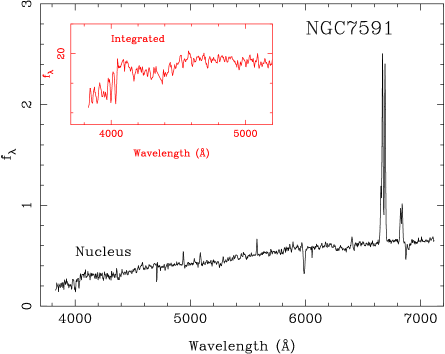
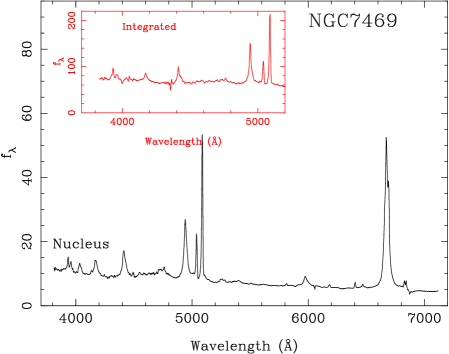
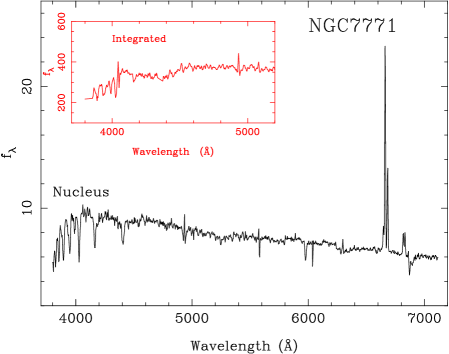
The integrated spectrum of each galaxy was extracted by defining Å continuum isophotes and then summing up all the spaxels contained within the chosen external continuum isophote. The external isophotes (plotted for all galaxies in Fig. 1) were selected to cover the PMAS FoV as much as possible, without compromising the quality of the extracted spectra. In Table 2 we give for each galaxy the approximate physical size along the major axis of the galaxy of the outer continuum isophote used for the integrated spectra. Note that the term integrated is used in the sense of integrated spectra over the PMAS FoV, and the integrated spectra do not encompass the whole galaxy (see e.g. figure.set.8 of Moustakas & Kennicutt 2006 for a comparison with one of the galaxies in our sample, NGC 23). Typically our integrated spectra cover the central 3 to 8 kpc along the major axis of the galaxy, depending on the galaxy, but for most galaxies they include the central kpc (see Table 2). The integrated spectra of those galaxies observed under non-photometric conditions (Table 1) may be affected by imperfect sky subtraction, but this does not affect the measurements of the brightest emission lines. The full nuclear spectra are shown in Fig. 4 for each LIRG in the sample. In the same figure we present in the insets the blue part of the integrated spectra to emphasize the differences between the underlying absorption features and the H and [O iii]5007 emission lines in the nuclear and integrated spectra.
The fluxes of the brightest emission lines of the nuclear and integrated spectra were measured manually using splot within iraf and were compared with the automated flux measurements used for constructing the spectral maps (see Sect. 3.1), except for NGC 7469. In the case of the manual measurements we did not impose any constraints on the line widths and ratios when measuring the [N ii]6548, H and [N ii]6584, and the [S ii]6717,6731 lines. For the nuclear and integrated spectra of NGC 7469 we used the method and restrictions described in Sect. 3.1. We find a good agreement between the manual and the automated measurements of the nuclear values. The largest differences (up to ) are for the [O i]6300/H line ratio, whereas for the other line ratios the differences are always of less than . As done for the spectral maps, we did not attempt to correct for the presence of H in absorption. The observed (not corrected for extinction) line ratios for the nuclear and integrated spectra are given in Table 2.
4 Morphology of the stellar and gas emissions
The optical and near-infrared continuum images (Fig. 1) reveal the presence of bright nuclei, and a large number of star clusters in the nuclear regions as well as along the large scale spiral arms. The star clusters are only unveiled by the higher angular resolution of the NICMOS images, which is typically a few tens of parsecs for our sample of LIRGs. There is a good overall correspondence, on scales of a few hundred parsecs (the PMAS spatial resolution), between the optical and the near-infrared stellar continua as mapped out by the PMAS 6200 Å and the NICMOS m emissions, respectively. This indicates that for the majority of these LIRGs the effects of extinction on the continuum morphologies are not overly severe, except for the nuclei of the galaxies (Alonso-Herrero et al. 2006). This is clearly seen in NGC 7771 where the peaks of the optical and near-infrared continua appear displaced by a few arcseconds (see Figs. 1k and 3). This is probably due to the highly inclined nature of this galaxy, as well as the diversity of stellar populations and patchy extinction present in the ring of star formation (Davies, Alonso-Herrero & Ward 1997; Smith et al. 1999; Reunanen et al. 2000). Another example with large differences between the optical and near-infrared continuum emission is Arp 299, and we refer the reader to Alonso-Herrero et al. (2000a) and García-Marín et al. (2006) for a full discussion.
The PMAS H and the NICMOS Pa emissions are well correlated, and both trace the nuclear emission as well as the emission from bright, high surface-brightness H ii regions (Fig. 1). The high angular resolution of the NICMOS Pa images resolves with exquisite detail the sites of the youngest star forming regions in the central regions of LIRGs. These high surface-brightness H ii regions can be either located in the central kpc or spread out throughout the disk of the galaxies (see Alonso-Herrero et al. 2006 for more details).
Since the NICMOS Pa and nearby continuum images were taken with narrow-band filters, and a relatively small pixel size, they are not very sensitive to the diffuse low surface-brightness emission. This may also be due to the fact that in LIRGs the diffuse emission suffers much less extinction than the bright H ii regions (see Rieke et al. 2009 and references therein). The PMAS H images show emission from the H ii regions, at lower angular resolution than the NICMOS images. Additionally, for most LIRGs the PMAS H images are also sensitive to more diffuse low surface-brightness emission. This extended emission can be seen almost over the entire PMAS FoV (e.g., NGC 5936 Fig. 1g and NGC 6701 Fig. 1h), and beyond, as shown by other works for a few galaxies in common with our sample (Márquez, Masegosa, & Moles 1999; Dopita et al. 2002; Hattori et al. 2004). It is only the two galaxies with the most compact nuclear Pa emission, IC 860 (Fig. 1f) and to a lesser degree UGC 1845 (Fig. 1c), that also show relatively compact H emission.
The fact that H and Pa morphologies are in general similar suggests that over the PMAS FoV and with the PMAS angular resolution the extinction effects on H are not severe, except in the very nuclear regions. Indeed, Alonso-Herrero et al. (2006) for the galaxies in common with this work measured average extinctions to the gas of mag over the Pa emitting regions (a few kpc). Similar values of the extinction were found by Veilleux et al. (1995) from the Balmer decrement. The PMAS H maps are similar to those of H although they are more affected by extinction and/or the presence of H in absorption, especially in the nuclear regions (e.g., UGC 1845 Fig. 1c, MCG+02-20-003 Fig. 1e, NGC 7591 Fig. 1j).
In general the overall morphology of the brightest forbidden lines ([N ii], [S ii]6717,6731) shows a reasonable correlation with that of H. On smaller scales, however, some differences are already apparent in Fig. 1. For instance, in NGC 23 (Fig. 1a) all the optical emission lines except for H and H peak in the nucleus, whereas the brightest regions of hydrogen recombination line emission (H, Pa), which trace the sites of on-going star formation, are in the circumnuclear ring of star formation. There are also small scale differences between the H and [N ii] emissions of the nuclei and the H ii regions For example, some of the extra-nuclear H ii regions of NGC 2388 (Fig. 1d) and MCG +02-20-003 (Fig. 1e) appear to have lower [N ii]/H ratios than their nuclei. This is a well known behavior of galaxies (Veilleux & Osterbrock 1987; Kennicutt, Keel, & Blaha 1989; Sarzi et al. 2007). The small scale differences of the different emission lines in LIRGs are more apparent from the spatially resolved properties of the optical line ratios of this sample of LIRGs and will be discussed in detail in a forthcoming paper (Alonso-Herrero et al. 2009, in preparation).
Although the limited angular resolution of the PMAS continuum and gas maps does not allow us to resolve all the morphological details seen in the NICMOS images, the general behavior is the same. For the majority of the LIRGs in our sample the peaks of the stellar and the H gas emissions are coincident and located in the nuclear region. The few cases of displacements between the stellar and the H peaks are found in those LIRGs with circumnuclear rings of star formation without Seyfert activity. In NGC 23 (Fig. 1a) and NGC 7771 (Fig. 1k) the stellar emission peaks in the nuclei, whereas the brightest H and Pa emission are in luminous H ii regions in the rings. These displacements are likely to be due to differences in the stellar populations. That is, the youngest regions and thus brightest H emitting regions are in the rings, whereas the nuclei contain older stellar populations. The latter is clearly demonstrated by the presence of strong absorption features (Balmer line series, H+K CaII lines) in the nuclear spectra of these two galaxies (Fig. 5). In the case of NGC 7469, which also shows a bright circumnuclear ring of star formation (see Genzel et al. 1995; Díaz-Santos et al. 2007, and references therein), the peaks of the stellar and gas emission are coincident with the nuclear AGN.
In contrast to the majority of the LIRGs in this volume-limited sample, in the interacting LIRG Arp 299 the peaks of the observed warm ionized gas are displaced from the stellar peaks typically by kpc (see García-Marín et al. 2006). In local interacting ULIRGs the displacements between the continuum and gas emissions are common and even larger, typically kpc and in some exceptional cases as large as kpc (Colina et al. 2005; García-Marín et al. 2009). The differences in the stellar and gas distributions in ULIRGs are understood in terms of the more extreme effects produced by the interaction processes on the spatial distribution of the ionizing sources and the presence of large amounts of dust in the nuclear regions.
5 Nuclear versus integrated spectral classification
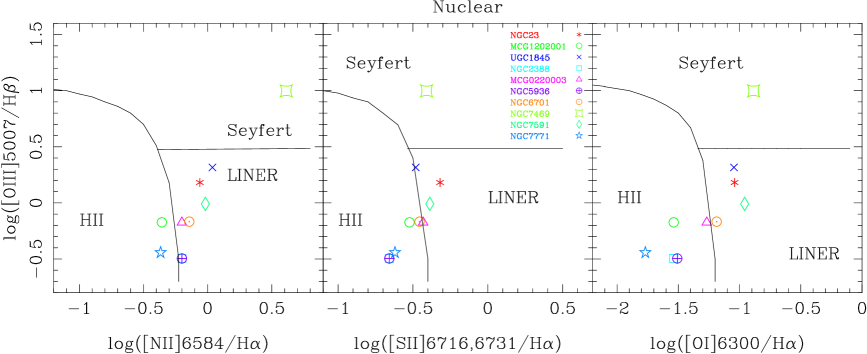
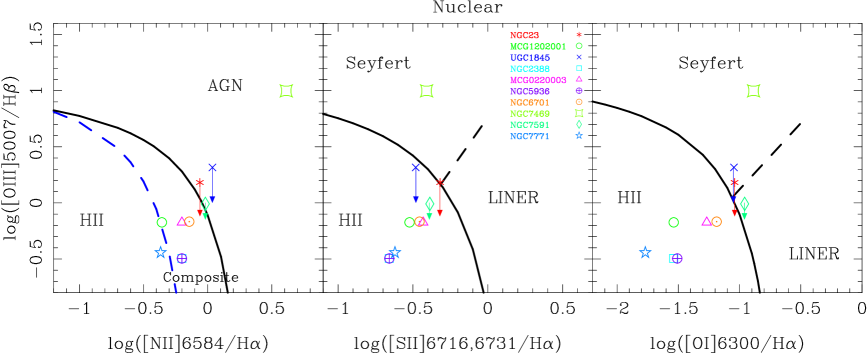
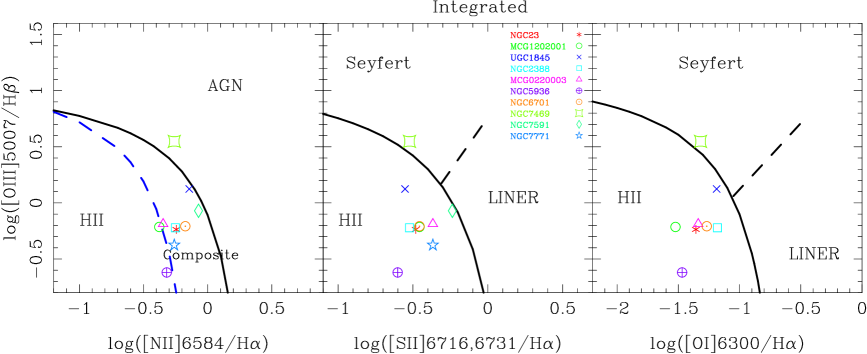
We used the standard optical diagnostic diagrams (BPT diagrams, Baldwin, Phillips, & Terlevich 1981) to classify galaxies into the H ii-like, LINER, and Seyfert spectral types. For the spectral classification of the nuclear and integrated activity we used two different sets of boundaries in the optical line ratio diagrams. The first are the classical semi-empirical boundaries of Veilleux & Osterbrock (1987, V&O87 hereafter), which have the added advantage of making the comparison with previous results on these LIRGs easier. The V&O87 boundaries are shown in Fig. 5. The second set includes the latest empirical and theoretical boundaries derived by Kauffmann et al. (2003) and Kewley et al. (2001a, b; 2006), and are shown in Fig. 6. Kewley et al. (2001a, b) modeled AGN and starburst line ratios to provide theoretical boundaries in these diagnostic diagrams. They defined the so-called maximum starburst lines above which the line ratios cannot be explained by pure star formation. Kauffmann et al. (2003) and Kewley et al. (2006) derived empirical boundaries in these diagrams to separate H ii, LINERs and Seyfert galaxies using large samples of galaxies drawn from the Sloan Sky Digital Survey (SSDS). We will refer to this second set of boundaries as theoretical/SSDS.


| Galaxy | Type | Classical V&O87 Boundaries | Theoretical/SSDS Boundaries | Adopted | ||||
|---|---|---|---|---|---|---|---|---|
| [OI] | [NII] | [SII] | [OI] | [NII] | [SII] | |||
| (1) | (2) | (3) | (4) | (5) | (6) | (7) | (8) | (9) |
| NGC 23 | Nuclear | L | L | L | HII/L | AGN/Composite | HII/L | Composite |
| Integrated | HII | L/HII | HII | HII | Composite | HII | HII | |
| MCG +12-02-001 | Nuclear | HII | HII | HII | HII | Composite | HII | HII |
| Integrated | HII | HII | HII | HII | Composite | HII | HII | |
| UGC 1845 | Nuclear | L | L | L/HII | Sy/L | AGN | Sy/HII | Composite |
| Integrated | L/HII | L | HII | Sy/HII | AGN/Composite | HII | Composite | |
| NGC 2388 | Nuclear | HII | L/HII | HII | HII | Composite | HII | HII |
| Integrated | HII | L/HII | HII | HII | Composite | HII | HII | |
| MCG +02-20-003 | Nuclear | L/HII | L/HII | L/HII | HII | Composite | HII | HII |
| Integrated | HII | HII | L/HII | HII | Composite | HII | HII | |
| IC 860 | Nuclear | L/Sy? | L/Sy? | AGN? | L? | |||
| NGC 5939 | Nuclear | HII | L/HII | HII | HII | Composite | HII | HII |
| Integrated | HII | L/HII | HII | HII | HII | HII | HII | |
| NGC 6701 | Nuclear | L | L | L/HII | HII/L | Composite | HII | Composite |
| Integrated | L/HII | L | L/HII | HII | Composite | HII | HII | |
| NGC 7469 | Nuclear | Sy | Sy | Sy | Sy | AGN | Sy | Sy |
| Integrated | Sy/HII | Sy | Sy/HII | Sy/HII | Composite | Sy/HII | Composite | |
| NGC 7591 | Nuclear | L | L | L | L | AGN/Composite | HII/L | Composite |
| Integrated | L/HII | L/HII | AGN/Composite | L/HII | Composite | |||
| NGC 7771 | Nuclear | HII | HII | HII | HII | HII | HII | HII |
| Integrated | L/HII | L/HII | Composite | HII | HII | |||
Notes.— Column (2): PMAS type of 1D spectra.
Columns (3), (4), and (5):
Spectral classification based on the [O iii]5007/H vs.
[O i]6300/H, [N ii]6584/H,
and
the [S ii]6717,6731/H diagrams,
respectively and the classical
boundaries of V&O87 in the BPT diagrams.
The classifications are, HII=HII galaxy, L=LINER, and Sy=Seyfert.
Galaxies classified as Composite are likely to be a combination
of AGN activity and star formation. The classifications take into
account the uncertainties reported by Kewley et
al. (2001a) for the maximum starburst lines.
Columns (6), (7), and (8):
As Columns (3), (4) and (5) but using the latest theoretical/SSDS
boundaries.
Column (9): Adopted spectral classification.
We did not attempt to correct the line ratios for extinction. The effects of extinction on the spectral classifications should be moderately small because the lines involved in the line ratios are in most cases close in wavelength.
The first result worth noticing is that when using the [O iii]5007/H vs. [N ii]6584/H diagram and the theoretical/SSDS boundaries (Fig. 6 and Table 3), a large fraction of the LIRG nuclei are classified as composite, and thus they are likely to contain a metal-rich stellar population and an AGN (see Kewley et al. 2006). It is also possible that some of these composite objects have an added contribution from shock excited emission (from supernovae) associated with an aging starburst (see Alonso-Herrero et al. 2000b). If we use all three BPT diagrams the fraction of composite objects appears to be smaller. However, Kauffmann et al. (2003) did not provide an empirical separation between AGN and star-forming galaxies in the diagrams involving the [O i]6300/H and the [S ii]6717,6731/H ratios, so we cannot assess whether galaxies are composite or not using those two diagrams.
Using all three BPT diagrams and the V&O87 classical boundaries (thin lines in Fig. 5) we find that only two nuclei in our sample of LIRGs show pure H ii-like excitation (that is, classified as H ii using all three BPT diagrams), five have an intermediate LINER/H ii classification, two fall in the LINER regions, and one nucleus is classified as a Seyfert galaxy (upper panels of Fig. 5, see also Table 3). This large fraction of composite objects (i.e., star formation and AGN activity) is a well-known property of samples of infrared-bright galaxies (Veilleux et al. 1995; Kewley et al. 2001b; Chen et al. 2009), regardless of what boundaries are used for classifying galaxies.
We cannot provide a conclusive classification for IC 860 because the emission lines in the blue part of the spectrum are not detected (note the strong H absorption, Fig. 4). The high [N ii]6584/H and [S ii]6717,6731/H line ratios could indicate a Seyfert or LINER classification, but the correction for underlying stellar H absorption would decrease significantly the observed line ratios in this galaxy.
A large fraction of the LIRGs in this sample show a strong contribution from an evolved stellar population as indicated by the presence of absorption features (Balmer line series, H+K CaII lines) in the blue part of the spectra (Fig. 4). Although a detailed modeling of the stellar populations is beyond the scope of this paper, we can attempt to correct the [O iii]5007/H ratio for the presence of an evolved stellar population for those galaxies located near the AGN/HII boundaries. These are NGC 23, UGC 1845, and NGC 7591 (Fig. 6). Our preliminary modeling indicates that a combination of intermediate (Gyr) and young (Myr) stellar populations with a measured equivalent width of H in absorption of Å would produce acceptable fits to their spectra. This is within the average H stellar absorption corrections obtained by Moustakas & Kennicutt (2006) for a sample of nearby star-forming galaxies. The approximate effects of correcting the observed [O iii]5007/H for underlying stellar absorption are shown as arrows in the upper panel of Fig. 6. The corrections for the other line ratios involving H would be smaller. As can be seen from this figure, this correction does not change fundamentally the result that these nuclei appear to be composite in nature.
| Galaxy | |||
|---|---|---|---|
| (1) | (2) | (3) | (4) |
| NGC 23 | , | ||
| MCG +12-02-001 | , | ||
| UGC 1845 | , | ||
| NGC 2388 | , | ||
| MCG +02-20-003 | , | ||
| IC 860∗ | |||
| NGC 5936 | , | ||
| NGC 6701 | , | ||
| NGC 7469 | ,∗∗ | ||
| NGC 7591 | , | ||
| NGC 7771 | , |
Notes.— Column (2):
is the H velocity of the
nucleus, defined as the peak of the 6200 Å continuum, except
for NGC 7771 where it is refered to the position that makes the
velocity field gradient symmetric (see text and Fig. 3c).
Column (3): is the H
peak-to-peak velocity range over the PMAS FoV. Column (4):
is the nuclear H velocity dispersion
(corrected for instrumental effects). All
measurements are in km s-1, and are not corrected for
inclination and/or angular resolution effects.
∗For IC 860 is from [N ii]6584 and
[S ii]6717,6731. We note that
NED quotes a value of from 21 cm H i measurements, whereas our value
of the velocity is confirmed by measurements of the mid-infrared emission
lines with Spitzer/IRS (Pereira-Santaella et al. 2009, in
preparation).
∗∗For NGC 7469 the measurements are from
[N ii]6584.
We have seven galaxies in common with the work of Veilleux et al. (1995). Our nuclear classifications are in good agreement with theirs. The only two exceptions are NGC 23 and NGC 6701, which we would classify as LINER/HII with the V&O87 boundaries, or as composite using the theoretical/SSDS boundaries. As explained in Sect. 3.2 we extracted our nuclear spectra with the smallest possible physical sizes allowed by the PMAS spaxels (pc, Table 2), whereas Veilleux et al. (1995) used linear sizes of 2 kpc for extracting their nuclear spectra. As can be seen from Fig. 1a and 1h, the Veilleux et al. (1995) apertures included a large number of H ii regions in the ring of star formation of NGC 23 and in the inner spiral structure of NGC 6701. This readily explains the H ii-like classification given by Veilleux et al. (1995).
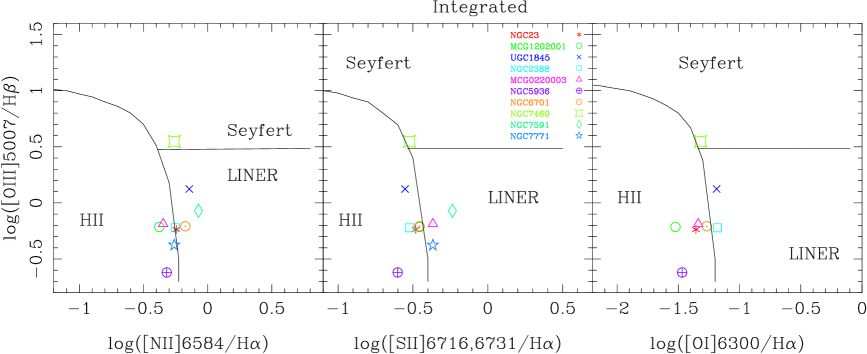
The BPT diagrams for the integrated emission over the PMAS FoV are presented in the lower panels of Figs. 5 and 6. The integrated line ratios of the four galaxies whose nuclei are classified as LINERs using the V&O87 boundaries now fall in the H ii region or in the intermediate LINER/H ii region. A similar situation is seen for NGC 7469 for which the integrated line ratios move toward the composite area in all diagrams. This is well understood in terms of the increased contribution of extra-nuclear high surface-brightness H ii regions (see H morphologies in Fig. 1) to their integrated emission. For the other galaxies there is no general trend, as the integrated line ratios depend on the relative contribution of H ii regions and diffuse emission to the total line emission over the PMAS FoV (Alonso-Herrero et al. 2009, in preparation). For instance, the integrated line ratios of NGC 7771 show larger [N ii]6584/H and [S ii]6717,6731/H line ratios than the nuclear ones, whereas the nuclear and integrated line ratios of other galaxies (e.g., MCG+02-20-003) remain approximately constant or slightly more similar to those of H ii regions.
Finally, we show an example of the power of optical IFS in identifying different excitation conditions. For NGC 7469 we also extracted the spectrum of an H ii region in the circumnuclear ring of star formation, located at about 2″ west from the nucleus (Fig. 4). It is clear that the line ratios are typical of H ii-like excitation and are not contaminated by the nearby Seyfert 1 nucleus (i.e., no broad components are present in the hydrogen recombination lines).
Summarizing, the comparison of the nuclear and integrated activity classifications, together with the spatial distribution of the bright emission lines (in particular H) allowed us to isolate and quantify the different ionization sources (nuclei, and circumnuclear H ii regions and diffuse emission) contributing to the observed emission in galaxies (see also Alonso-Herrero et al. 2009, in preparation).
6 Ionized Gas Kinematics
The velocity fields of the emission lines over the central few kpc (typically 5 kpc) are mostly consistent with rotation (see Fig. 3) for all the galaxies in the sample. We note that even on the physical scales probed by PMAS (pc), some velocity fields appear to show some peculiarities. However, it is clear that these velocity fields are more similar to those of disk galaxies (Falcón-Barroso et al. 2006: Daigle et al. 2006) than to those of local ULIRGs (Colina et al. 2005: Monreal-Ibero et al. 2006). The large scale continuum major photometric axis and the H major kinematic axis are broadly in agreement with each other (seen in projection) in the majority of our LIRGs. The ionized gas peak-to-peak velocities of LIRGs (over the central kpc) are typically between and (see Table 4), whereas in ULIRGs with tidally induced flows the gas peak-to-peak velocities can be as high as (Colina et al. 2005).
Three galaxies in our sample show circumnuclear rings of star formation. The central H velocity field of NGC 23 is consistent with rotation, with the major kinematic axis aligned with the major axis of the galaxy rather than with the orientation of the ring of star formation as seen in H (Fig. 1a). A similar situation is observed for NGC 7469, where the [N ii]6584 velocity field has a major axis similar to that of the continuum, although it is asymmetric towards the north-west direction. This asymmetry was already reported in the rotation curve along the major axis of the galaxy by Márquez & Moles (1994). In both galaxies, it is likely that most of the mass in the central region is in relatively evolved stars rather than in young ionizing stars (see also Díaz-Santos et al. 2007 for NGC 7469). The H velocity field of the inner of NGC 7771 has a major kinematic axis aligned with the approximate orientation of the circumnuclear ring of star formation (east-west direction), whereas the outer velocity field appears to have a major kinematic axis in better agreement with that of the large scale continuum emission. This kind of velocity fields with symmetric distortions can be associated with the presence of a warped disk. It is also worth mentioning that there is dynamical evidence that NGC 7771 is weakly interacting with NGC 7770 (Keel 1993) and is located in a group of galaxies.
Another example of a central H velocity field that deviates from perfect rotation is that of NGC 6701. This galaxy shows a complex overall morphology, with the presence of a large scale bar, an inner isophote twist produced by a spiral like inner ring (see Márquez et al. 1996, and the continuum m image in Fig. 1h), a perturbed rotation curve, and a small companion likely to be responsible for some of these properties (Márquez et al. 1996). As seen in other galaxies in our sample, the major kinematic axis of the H velocity field appears to be better aligned with the photometric axis of the galaxy (PA, Vogt et al. 2004) rather than with the orientation of the nuclear high surface-brightness emission Pa emission, which is seen in an almost north-south orientation.
Arp 299 the most luminous galaxy in our sample and a strongly interacting system shows very complicated velocity fields (both of neutral and ionized gas, see García-Marín et al. 2006), not only at the interface between the two galaxies, but also in the nuclear regions of the two members of the system. Moreover, the velocity fields of the ionized gas in Arp 299 do not appear to be dominated by ordered virialized motions, probably as a result of the interaction between the two galaxies, as is the case of most ULIRGs.
As can be seen from Fig. 3 for most LIRGs in our sample the peak of the H velocity dispersion coincides with the peak of the optical and near-infrared continuum emission (i.e., the nucleus), and thus the velocity dispersion is likely to be tracing mass. The nuclear H velocity dispersions are between 66 and 144 (Table 4). The largest velocity dispersions of the ionized gas are associated with three of the nuclei classified as LINERs and the Seyfert galaxy NGC 7469.
In the case of galaxies with circumnuclear rings of star formation, we find that the gas velocity dispersions in the rings are less than in the nuclear regions. This is consistent with the findings of Falcón-Barroso et al. (2006) for the same type of galaxies and was interpreted as an indication for the presence of large amounts of cold gas from which stars have recently formed.
There are only a few measurements of the stellar velocity dispersion of LIRGs. From near-infrared CO absorption features the stellar velocity dispersions are between 60 and 160 (Shier, Rieke, & Rieke 1996; Hinz & Rieke 2006), similar to the range of H velocity dispersions measured for our LIRGs. The only LIRG in our sample with a stellar velocity dispersion measurement is NGC 7469, for which Onken et al. (2004) obtained from the calcium triplet, in good agreement with our measurement from the ionized gas. The velocity dispersions of LIRGs are in general similar to or slightly less than the typical nuclear gas and stellar velocity dispersions of ULIRGs (Colina et al. 2005; Dasyra et al. 2006). This suggests that at least some LIRGs have comparable dynamical masses to those of ULIRGs, although a detailed modeling is needed to assess this issue.
7 Discussion and Summary
This is the first paper in a series presenting PMAS optical IFS observations of the northern hemisphere portion of the volume-limited () sample of local LIRGs defined by Alonso-Herrero et al. (2006). This sample is in turn part of the larger IFS survey of nearby () LIRGs and ULIRGs assembled by Arribas et al. (2008). In this paper we presented the observations and data reduction of the PMAS observations. The PMAS observations cover the central (typically the central 5 kpc) with spaxels of 1″ in size, and a spectral range Å. The PMAS IFS data were complemented with our own existing near-infrared HST/NICMOS observations of the m continuum and the Pa emission line. The main goal of this paper is to present an atlas of the observations and the general IFS results of the sample of LIRGs and compare them with local ULIRGs.
On the physical scales probed by the PMAS IFS (pc) the optical and near-infrared stellar morphologies are similar for most galaxies, indicating that extinction is not playing a major role for this sample of LIRGs, except in the innermost regions. Similarly, there are no major morphological differences between Pa and H. The HST/NICMOS Pa and PMAS H observations are complementary, with the former revealing in great detail (physical scales of a few tens of parsecs) the morphologies of the high surface-brightness H ii regions, and the latter being sensitive not only to H ii regions but also to diffuse emission with lower surface brightness.
In the majority of the LIRGs in our sample the peaks of the continuum and gas (e.g., H, [N ii]6584) emissions coincide. This contrasts with local interacting ULIRGs, where the extreme effects of the interaction processes on the ionizing mechanisms and the distribution of dust can cause displacements between the peaks of continuum and gas emission of typically kpc (Colina et al. 2005: García-Marín et al. 2009). The only exceptions in the LIRG sample are galaxies with circumnuclear rings of star formation (NGC 23 and NGC 7771) and the strongly interacting galaxy Arp 299. In the case of the galaxies with circumnuclear rings of star formation, the most luminous H emitting regions are found in the rings rather than in the nuclei of the galaxies, and the displacements are well understood in terms of differences in the stellar populations. In Arp 299 the displacements are due to the high extinctions suffered by the nuclear regions (see Alonso-Herrero et al. 2000a and García-Marín et al. 2006).
Using standard BPT diagrams we compared the excitation conditions of the nuclear and integrated (over the PMAS FoV) 1D spectra of the LIRGs in our sample. Only two nuclei show pure H ii-like excitation using the classical V&O87 boundaries, and one has a Seyfert nucleus. The rest are classified as LINER or intermediate LINER/H ii, using the V&O87 boundaries, or alternatively as composite objects using the theoretical/SSDS boundaries. We also found that a large fraction of the nuclei show evidence for a strong contribution from an evolved stellar population (absorption features). There is no general trend for the excitation conditions of the integrated emission when compared with the nuclear excitation, as the former depends on the relative contributions of H ii regions and the diffuse emission to the line emission over the PMAS FoV (Alonso-Herrero et al. 2009, in preparation). That is, galaxies dominated by high surface-brightness H ii regions show integrated H ii-like excitation, whereas galaxies with more diffuse low surface-brightness emission tend to show slightly larger [N ii]6584/H and [S ii]6717,6731/H line ratios.
The H velocity fields over the central few kpc covered by the PMAS observations are generally consistent, at least to first order, with rotational motions. The observed H velocity amplitudes (peak-to-peak) are between 200 and . Although the velocity fields of some LIRGs show some peculiarities, they are not as perturbed as those of most local, strongly interacting ULIRGs. In that respect, the velocity fields of the emission lines of our sample resemble those of disk galaxies (Falcón-Barroso et al. 2006: Daigle et al. 2006). In most LIRGs in our sample the peak of the H velocity dispersion coincides with the peak of the optical and near-infrared continuum emission (i.e., the nucleus). Thus, the velocity dispersion is likely to be tracing mass and provides further support for rotation. The nuclear H velocity dispersions are in the range and are similar to the stellar values measured from near-infrared CO absorption features measured for other LIRGs. The LIRG nuclei with the largest H velocity dispersions are those classified as LINERs and the Seyfert 1 nucleus of NGC 7469.
Throughout this paper we discussed the ionized gas and stellar distributions, excitation conditions and kinematics of a volume limited sample of LIRGs. We also showed that the properties of this sample of LIRGs, and in particular, their kinematics, are more similar to those of disk galaxies, rather than to those of local, strongly interacting ULIRGs. Our LIRGs are part of a flux and volume limited sample drawn from the IRAS RBGS of Sanders et al. (2003). As a consequence, our sample is predominantly composed of low-luminosity LIRGs with an average IR luminosity of for the full sample (northern and southern hemispheres, see Alonso-Herrero et al. 2006). Sanders & Ishida (2004) demonstrated that marks the transition between samples being dominated by disk galaxies and merger dominated samples. In the Sanders & Ishida (2004) sample of LIRGs, most objects at are spiral galaxies with no signatures of a major interaction and pairs of galaxies, whereas at most objects are strongly interacting equal mass galaxies with overlapping disks. The similarities of our sample with ¨normal¨ disk galaxies are then well understood because our sample is mostly composed of disk galaxies and galaxy pairs not undergoing a strong interaction (Sect. 2.1).
At intermediate redshifts () LIRGs are the main contributors to the star formation rate density (Elbaz et al. 2002; Le Floc’h et al. 2005; Pérez-González et al. 2005; Caputi et al. 2007). Moreover, these LIRGs are mostly classified as spiral galaxies (Bell et al. 2005: Melbourne et al. 2005, 2008) with the star formation smoothly distributed in the disks of the galaxies as seen for our sample of LIRGs. There is also a strong evolution in galaxy kinematics at , but still about half of the line emitting population at these redshifts, which are mostly LIRGs, have rotating disks (Puech et al. 2008; Yan et al. 2008). While local and distant LIRGs may have self regulated star formation as in disk galaxies (see Bell et al. 2005), it is clear that their star formation rates are at least a factor of ten or more higher than in spirals. Locally the central regions of LIRGs are found to contain a large population of giant HII regions not observed in normal spiral galaxies (see Alonso-Herrero et al. 2006). This, together with a higher star formation efficiency of the dense gas in local LIRGs (Graciá- Carpio et al. 2008) may explain the high star formation rates of LIRGs when compared to normal disk galaxies. Studying the spatially resolved properties of flux-limited complete samples of local LIRGs may help us understand if the similarities with LIRGs stem from the same physical processes and comparable evolutionary states.
Summarizing, we demonstrated the ability of optical IFS to spatially resolve the different ionization sources contributing to the observed emission of LIRGs, as well as to study their kinematic properties. Full detailed studies of the extinction, excitation conditions, stellar populations, and kinematics of LIRGs and ULIRGs will be presented in forthcoming papers.
Acknowledgements.
We are grateful to the Calar Alto staff, and in particular to S. Sánchez, A. Guijarro, L. Montoya, and N. Cardiel, for their support during the PMAS observing campaigns. We thank Martin Roth for interesting and useful discussions about the PMAS instrument, and J. Rodríguez Zaurín for advice on stellar populations. We thank the referee for his/her constructive comments. This research has made use of the NASA/IPAC Extragalactic Database (NED) which is operated by the Jet Propulsion Laboratory, California Institute of Technology, under contract with the National Aeronautics and Space Administration. AA-H, LC, SA, AL, and JA-G acknowledge support from the Spanish Plan Nacional del Espacio under grants ESP2005-01480 and ESP2007-65475-C02-01. AA-H also acknowledges support for this work from the Spanish Ministry of Science and Innovation through Proyecto Intramural Especial under grant number 200850I003. MG-M is supported by the German Federal Department of Education and Research (BMBF) under project numbers: 50OS0502 and 50OS0801. AM-I is supported by the Spanish Ministry of Science and Innovation (MICINN) under program ”Specialization in International Organisms”, ref. ES2006-0003.References
- (1) Alonso-Herrero, A., Rieke, G. H., Rieke, M. J., & Scoville, N. Z. 2000a, ApJ, 532, 845
- (2) Alonso-Herrero, A., Rieke, M. J., Rieke, G. H., & Shields, J. C. 2000b, ApJ, 530, 688
- (3) Alonso-Herrero, A., Rieke, G. H., Rieke, M. J., Colina, L., Pérez-González, P. G., & Ryder, S. D. 2006, ApJ, 650, 835
- (4) Alonso-Herrero, A., Rieke, G. H., Colina, L., Pereira-Santaella, M., García-Marín, M., Smith, J.-D. T., Brandl, B., Charmandaris, V., & Armus, L. 2009, ApJ, 697, 660
- (5) Armus, L., Heckman, T. M., & Miley, G. K. 1989, ApJ, 347, 727
- (6) Arribas, S., Colina, L., & Clements, D. 2001, ApJ, 560, 160
- (7) Arribas, S., et al. 1998, SPIE, 3335, 821
- (8) Arribas, S., Colina, L., Monreal-Ibero, A., Alfonso, J., García-Marín, M., & Alonso-Herrero, A. 2008, A&A, 479, 687
- (9) Baldwin, J. A., Phillips, M. M., & Terlevich, R. 1981, PASP, 93, 5
- (10) Bedregal, A. G., Colina, L., Alonso-Herrero, A., & Arribas, S. 2009, ApJ, 698, 1852
- (11) Bell, E. et al. 2005, ApJ. 625, 23
- (12) Bingham, R. G., Gellatly, D. W., Jenkins, C. R., & Worswick, S. P. 1994, Proc. SPIE, 2198, 56
- (13) Caputi, K. et al. 2007, ApJ, 660, 97
- (14) Chen, X. Y., Liang, Y. C., Hammer, F., Zhao, Y. H., & Zhong, G. H. 2009, A&A, 495, 457
- (15) Colina, L., Arribas, S., & Monreal-Ibero, A. 2005, ApJ, 621, 725
- (16) Daigle, O., Carignan, C., Amram, P., Hernandez, O., Chemin, L., Balkowski, C., & Kennicutt, R. 2006, MNRAS, 367, 469
- (17) Dasyra, K. M., et al. 2006, ApJ, 638, 745
- (18) Davies, R. I., Alonso-Herrero, A., & Ward, M. J. 1997, MNRAS, 291, 557
- (19) Díaz-Santos, T., Alonso-Herrero, A., Colina, L., Ryder, S. D., & Knapen, J. H. 2007, ApJ, 661, 149
- (20) Dopita, M. A., Pereira, M., Kewley, L. J., & Capaccioli, M. 2002, ApJS, 143, 47
- (21) Eisenhauer, F. et al. 2003, SPIE, 4841, 1548
- (22) Elbaz, D., Cesarsky, C. J., Chandal, P., Aussel, H., Franceschini, A., Fadda, D., & Chary, R. R. 2002, A&A, 384, 848
- (23) Falcón-Barroso, J. et al. 2006, MNRAS, 369, 529
- (24) Farrah, D. et al. 2008, ApJ, 677, 957
- (25) Förster-Schreiber, N. M. et al. 2006, ApJ, 645, 1062
- (26) García-Marín, M., Colina, L., Arribas, S., Alonso-Herrero, A., & Mediavilla, E. 2006, ApJ, 650, 850
- (27) García-Marín, M., Colina, L., Arribas, S., & Monreal-Ibero, A. 2009, A&A, in press (astro-ph/0907.2408)
- (28) Genzel, R. et al. 1995, ApJ, 444, 129
- (29) Genzel, R. et al. 2006, Nature, 422, 786
- (30) Genzel, R. et al. 2008, ApJ, 687, 59
- (31) Graciá-Carpio, J., García-Burillo, S., Planesas, P., Fuente, A., & Usero, A. 2008, A&A, 479, 703
- (32) Hattori, T. et al. 2004, AJ, 127, 736
- (33) Heckman, T. M., Armus, L., & Miley, G. K. 1987, AJ, 92, 276
- (34) Heckman, T. M., Lehnert, M. D., Strickland, D. K., Armus, L. 2000, ApJS, 129, 493
- (35) Hinz, J. L. & Rieke, G. H. 2006, ApJ, 646, 872
- (36) Kauffmann, G. et al. 2003, MNRAS, 346, 1055
- (37) Keel, W. C. 1993, AJ, 106, 1771
- (38) Kennicutt, R. C. Jr., Keel, W., C., & Blaha, C. A. 1989, AJ, 97, 1022
- (39) Kewley, L. J., Dopita, M. A., Sutherland, R. S., Heisler, C. A., & Trevena, J. 2001a, ApJ, 556, 121
- (40) Kewley, L. J., Heisler, C. A., Dopita, M. A., & Lumsden, S. 2001b, ApJS, 132, 37
- (41) Kewley, L. S., Groves, B., Kauffmann, G., & Heckman, T. 2006, MNRAS, 372, 961
- (42) Kim, D.-C., Sanders, D. B., Veilleux, S., Mazzarella, J. M., & Soifer, B. T. 1995, ApJS, 98, 129
- (43) Kim, D.-C., Veilleux, S., & Sanders, D. B. 1998, ApJ, 508, 672
- (44) Law, D. R. et al. 2007, ApJ, 669, 929
- (45) Le Févre, O. et al. 2003, SPIE, 4841, 1670
- (46) Le Floc’h, E. et al. 2005, ApJ, 632, 169
- (47) Lípari, S. et al. 2004a, MNRAS, 355, 641
- (48) Lípari, S., et al. 2004b, MNRAS, 348, 369
- (49) Lonsdale, C. J., Farrah, D., & Smith, H. E. 2006, in Astrophysics Update 2, edited by John W. Mason, Springer Verlag, Heidelberg, Germany
- (50) Marcillac, D., Elbaz, D., Charlot, S., Liang, Y. C., Hammer, F., Flores, H., Cesarsky, C., & Pasquali, A. 2006, A&A, 458, 369
- (51) Markwardt, C. B. 2008, ”Non-Linear Least Squares Fitting in IDL with MPFIT,” in proc. Astronomical Data Analysis Software and Systems XVIII, Quebec, Canada, ASP Conference Series, Vol. TBD, eds. D. Bohlender, P. Dowler & D. Durand (Astronomical Society of the Pacific: San Francisco), in press (astro-ph/0902.2850)
- (52) Márquez, I., & Moles, M. 1994, AJ, 108, 90
- (53) Márquez, I., Masegosa, J., & Moles, M. 1996, A&A, 310, 401
- (54) Melbourne, J., Koo, D. C. & Le Floc’h, E. 2005, ApJ, 632, 65
- (55) Melbourne, J. et al. 2008, AJ, 136, 1110
- (56) Monreal-Ibero, A., Arribas, S., & Colina, L. 2006, ApJ, 637, 138
- (57) Moustakas, J., & Kennicutt, R. C. Jr. 2006, ApJS, 164, 81
- (58) Murphy, T. W. Jr., Soifer, B. T., Matthews, K., & Armus, L. 2001, ApJ, 559, 201
- (59) Onken, C. A., Ferrarese, L., Merritt, D., Peterson, B. M., Pogge, R. W., Vestergaard, M., & Wandel, A. 2004, ApJ, 615, 645
- (60) Pérez-González, P. G. et al. 2005, ApJ, 630, 82
- (61) Puech, M. et al. 2008, A&A, 173, 187
- (62) Reunanen, J., Kotilainen, J. K., Laine, S., Ryder, S. D. 2000, ApJ, 529, 853
- (63) Reunanen, J., Tacconi-Garman, L. E., & Ivanov, V. D. 2007, MNRAS, 382, 951
- (64) Rieke, G. H., Alonso-Herrero, A., Weiner, B. J., Pérez-González, P. G., Blaylock, M., Donley, J. L., & Marcillac, D. 2009, ApJ, 692, 556
- (65) Roth, M. M. et al. 2005, PASP, 117, 620
- (66) Rupke, D. S., Veilleux, S., & Sanders, D. B. 2005, ApJS, 160, 115
- (67) Sanders, D. B., & Mirabel, I. F. 1996, ARA&A, 34, 749
- (68) Sanders, D. B., Mazzarella, J. M., Kim, D.-C., Surace, J. A., & Soifer, B. T. 2003, AJ, 126, 1607
- (69) Sanders, D. B., & Ishida, C. M. 2004, ASPC, 320, 230
- (70) Sarzi, M., Allard, E. L., Knapen, J. H., & Mazzuca, L. M., 2007, MNRAS, 380, 946
- (71) Shapiro, K. L. et al. 2008, ApJ, 682, 231
- (72) Shier, L. M., Rieke, M. J., & Rieke, G. H. 1996, ApJ, 470, 222
- (73) Smith, D. A., Herter, T., Haynes, M. P., & Neff, S. G. 1999, ApJ, 510, 669
- (74) Soifer, B. T. et al. 2000, AJ, 119, 509
- (75) Veilleux, S., & Osterbrock, D. E. 1987, ApJS, 63, 295
- (76) Veilleux, S., Kim, D.-C., Sanders, D. B., Mazzarella, J. M., & Soifer, B. T. 1995, ApJS, 98, 171
- (77) Veilleux, S., Kim, D.-C., & Sanders, D. B. 1999, ApJ, 522, 113
- (78) Vogt, N. P., Haynes, M. P., Herter, T., & Giovanelli, R. 2004, AJ, 127, 3273
- (79) Wu, H., Zou, Z. L., Xia, X. Y., & Deng, Z. G. 1998, A&AS, 132, 181
- (80) Wright, S. A., Larkin, J. E., Law, D. R., Steidel, C. C., Shapley, A. E. & Erb, D. K. 2009, ApJ, 699, 421
- (81) Yang, Y. et al. 2008, A&A, 477, 789