Discovery of Extremely High Velocity “Molecular Bullets” in the HH 80–81 High-Mass Star-Forming Region
Abstract
We present Submillimter Array 1.3 mm waveband continuum and molecular line observations of the HH 80–81 high-mass star-forming region. The dust continuum emission reveals two dominant peaks MM1 and MM2, and line emission from high-density tracers suggests the presence of another core MC. Molecular line emission from MM1, which harbors the exciting source of the HH 80–81 radio jet, yields a hot molecular core at a gas temperature of 110 K. The two younger cores MM2 and MC both appear to power collimated CO outflows. In particular, the outflow arising from MM2 exhibits a jet-like morphology and a broad velocity range of 190 km s-1. The outflow contains compact and fast moving molecular clumps, known as “molecular bullets” first discovered in low-mass class 0 protostellar outflows. These “bullets” cannot be locally entrained or swept up from the ambient gas, but are more likely ejected from the close vicinity of the central protostar. The discovery of this remarkable outflow manifests an episodic, disk-mediated accretion for massive star formation.
1 Introduction
Over the last decade, there have been a growing number of high-angular-resolution studies using observations from submm/mm and cm interferometers, aimed at understanding morphological and kinematical features associated with the massive star formation process, such as molecular outflows, possible rotating disks or envelopes, and inward accretion flows (e.g., Zhang et al., 1998; Shepherd et al., 1998; Beuther et al., 2002; Cesaroni et al., 2005; Keto & Wood, 2006; Qiu et al., 2009). More recently, studies based on observations from the Submillimeter Array (SMA), a combined power of high-angular-resolution and broad frequency coverage, have begun to shed light on the physical and chemical diversities in high-mass star-forming cores at different evolutionary stages (e.g., Rathborne et al. 2008; Beuther et al. 2009; Zhang et al. 2009). These efforts provided a wealth of information that greatly advanced our knowledge of massive star formation.
In this paper we present a high-angular-resolution study of the high-mass star-forming region HH 80–81, which has a bolometric luminosity of at an adopted distance of 1.7 kpc (Rodríguez et al., 1980). This region is distinguished by a 5.3 pc radio jet that has an opening angle of 1∘, known as the best collimated radio jet driven from a high-mass protostar (Martí et al., 1993, 1995, 1998). Recent Spitzer 8 m imaging reveals a bi-conical outflow cavity surrounding the radio jet (Qiu et al., 2008). The jet powering source has been detected from mid-infrared to cm wavelengths (Aspin et al., 1994; Stecklum et al., 1997; Martí et al., 1999; Gómez et al., 2003; Qiu et al., 2008), yet some basic properties of the source, such as physical and chemical conditions of the circumstellar matter, remain unclear. Here we present a detailed study of the dust continuum and molecular line emission of the radio jet powering source, and the discovery of an exceptional CO outflow containing fast moving molecular bullets.
2 Observations and Data Reduction
The SMA111The Submillimeter Array is a joint project between the Smithsonian Astrophysical Observatory and the Academia Sinica Institute of Astronomy and Astrophysics and is funded by the Smithsonian Institution and the Academia Sinica. observations toward the phase center (R.A., decl.) were undertaken with eight antennas on 2008 June 30 in the compact configuration and on 2008 September 9 in the sub-compact configuration, both under good weather conditions. Particularly the sub-compact data were taken with 0.02–0.03. The 4 GHz correlator was configured to cover rest frequencies of 219.2 to 221.2 GHz in the lower sideband and 229.2 to 231.2 GHz in the upper sideband. In the compact configuration, we observed Uranus, 3c454.3, and 3c273 for bandpass calibration, Callisto for flux calibration, and J1911-201 to monitor the time dependent gain. In the sub-compact configuration, observations of 3c454.3, Uranus, and J1733-130 and J1911-201 were used for the bandpass, flux, and gain calibrations, respectively. The data were calibrated using the IDL MIR package and then exported to MIRIAD for further processing. Self-calibration was performed on continuum and the solutions were applied to lines as well. The two data sets were jointly imaged with the ROBUST parameter set to 0.5, resulting in a synthesized beam of at FWHM.
3 Results
3.1 Dense Molecular Cores
Figure 1 shows the 1.3 mm continuum map and the integrated intensity maps of lines detected from a variety of molecular species. The mm continuum reveals two dominant peaks MM1 and MM2; MM1 coincides well with the radio source that powers the HH 80–81 radio jet and MM2 is spatially associated with H2O masers and a very weak radio source (Gómez et al., 1995; Martí et al., 1999). In addition, emission lines from high-density tracers, such as CH3OH, CH3CN, HCO, OCS, and HNCO, clearly reveals another dense core MC (Figures 1b–1f), although the mm continuum map only shows a weak enhancement toward this core. In Figure 1b the CH3OH (8-1,8– emission toward MC is eminently bright with a peak flux of 6.4 Jy beam-1. This narrow spectral component at a LSR velocity of km s-1 appears to be a maser emission. Kurtz et al. (2004) detected a 44 GHz methanol maser in the vicinity of MC, which is consistent with our 229.8 GHz detection as both masers are class I transitions (Slysh et al., 2002). Apart from the maser emission, most thermal line emission in Figure 1 appears brighter toward MM1. In particular lines of CH3OH (154,11– and HNCO – and those from SO2 isotopologues are only seen in MM1. We will discuss these diversities in Section 4.1.
MM1 has an integrated flux of 1.2 Jy at 1.3 mm continuum, in agreement with the BIMA measurement of 0.97 Jy at 1.4 mm and is completely dominated by the dust emission (Gómez et al., 2003). The mm continuum emission from MC does not appear to be very centrally peaked and is blended with the MM2 emission. Therefore we cannot obtain a reliable estimate of the continuum flux for MC alone. The measured flux toward MM2 and MC amounts to 0.8 Jy and is apparently dominated by MM2. From the continuum fluxes and assuming thermal equilibrium between the gas and dust hence adopting the temperatures derived from the CH3CN emission (Section 4.1), we obtain a gas mass of 6–34 for MM1 and a total mass of 12–65 for MM2 and MC, for a dust opacity 1.9–0.35 cm2 g-1 or an emissivity index 1–2 (Hildebrand, 1983).
3.2 Molecular Outflows
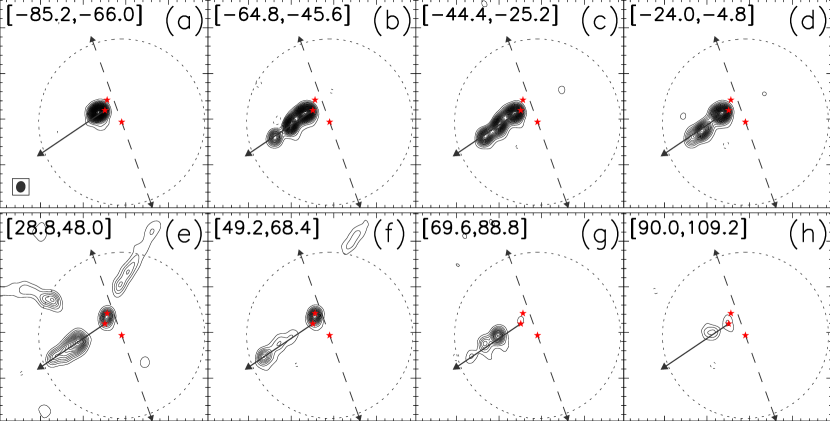
Figure 2 shows the high velocity CO (2–1) emission integrated over every 20.4 km s-1 from to km s-1 in the blueshifted lobe and from 28.2 to 109.2 km s-1 in the redshifted lobe. The emission at lower velocities (15 km s-1 with respect to the systemic velocity of 12 km s-1 for MM2) suffers from side lobes and missing flux due to inadequate coverage, hampering the interpretation of the morphology and kinematics, hence we focus on the high velocity CO emission in this work. The most remarkable feature in Figure 2 is a jet-like outflow emanating from MM2 to the southeast (SE), which exhibits extremely high velocity (EHV) emission up to km s-1 for the blueshifted lobe and km s-1 for the redshifted lobe above a 3 level of 60 mJy beam-1 per 1.2 km s-1. This outflow shows a knotty appearance with multiple clumps aligned along the flow axis. In addition, two more collimated flows, the northwest and northeast flows, are seen in Figure 2e; the former apparently originates from MC, whereas it is difficult with the existing data to unambiguously assign a driving source to the latter. These two flows both extend well beyond the SMA primary beam of 54′′ at 230 GHz, thus are not further discussed in this work.
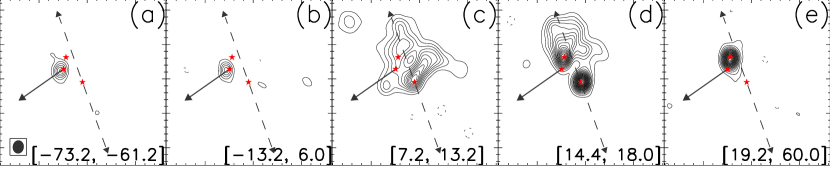
Figure 3 shows the SO (–) emission integrated over five velocity intervals. The blueshifted emission arising from the SE outflow is detected as an EHV clump in Figure 3a and a low to high velocity clump in Figure 3b. In Figure 3c the blueshifted low velocity emission mostly traces a wide-angle outflow surrounding the radio jet axis. In Figure 3d the redshifted low velocity emission reveals two compact clumps coincident with MM1 and MC, as well as extended structures probably attributed to outflows from MM1 and/or MC. In Figure 3e, a redshifted clump is detected at very high velocities; this structure can also be identified in CO in Figures 2e and 2f, and is apparently associated with MC.
4 Discussion
4.1 Physical and Chemical Diversities among the Dense Cores
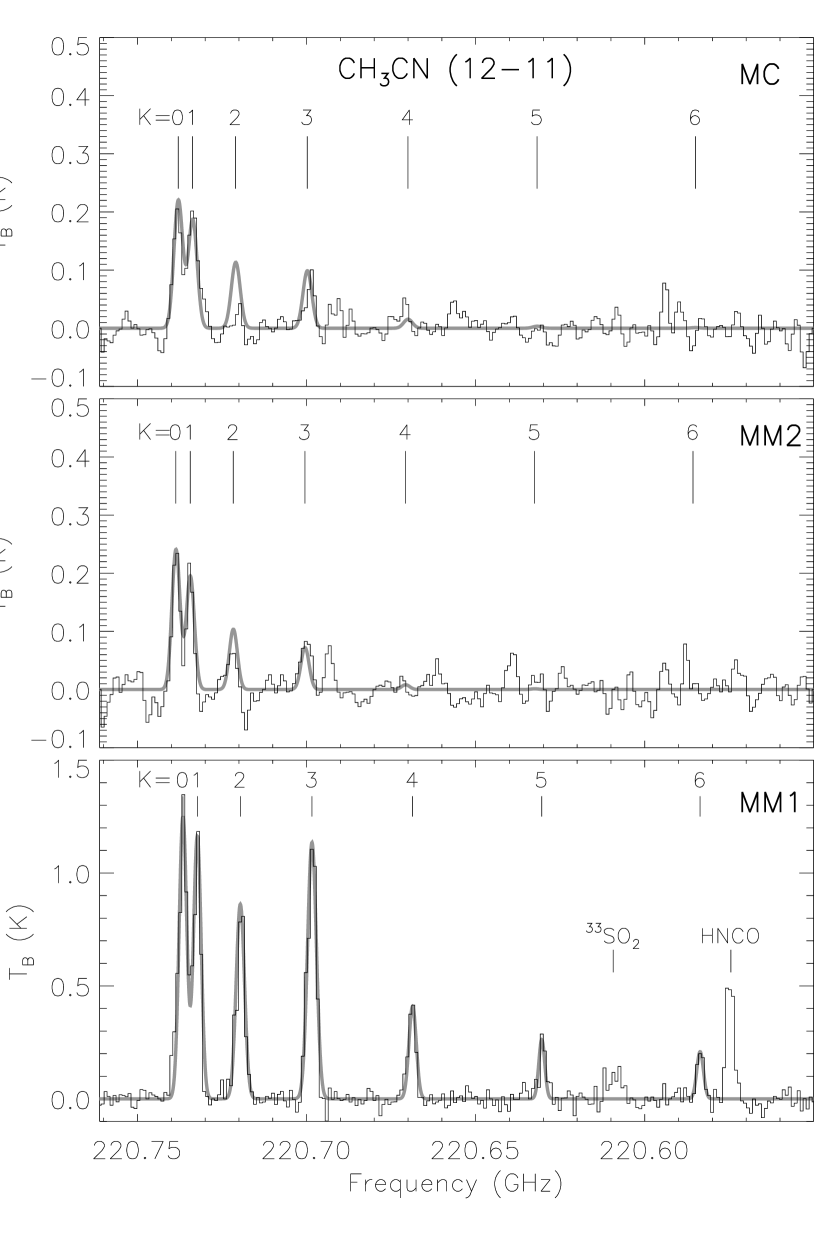
The CH3CN (12K–11K) emission is a good thermometer of dense gas surrounding high-mass protostars. Assuming that all the components are in local thermodynamical equilibrium and tracing the same gas, we perform a simultaneous fitting, taking into account the optical depth effect, to all the detected components by means of grid search minimization. From Figure 4, the best fitting models agree well with the observations, and yield gas temperatures of 110 K for MM1, 35 K for MM2, and 45 K for MC.
In addition to the CH3OH (8-1,8–70,7) line shown in Figure 1b, thermal emission in CH3OH (80,8–71,6) and (3-2,2–4-1,4) is detected in all the three cores but appears much brighter in MM1. The CH3OH (154,11–163,13) emission, however, is seen in MM1 alone (Figure 1g). This is not surprising since this transition has an upper energy level () of 374 K, dramatically higher than 39–96 K for the other three transitions. As indicated by the higher temperature inferred from the CH3CN emission, only the MM1 core possesses sufficient hot gas to populate the high-excitation CH3OH.
HNCO shows a diversity similar to CH3OH; the HNCO (100,10–90,9) emission is seen in both MM1 and MC, and probably MM2 as well, but the HNCO (101,9–91,8) emission is detected in MM1 alone. Lines of HNCO () are suggested as a good probe of the far-infrared field since its 0 ladders are populated primarily by far-infrared radiation rather than collisions with H2 (Churchwell et al., 1986; Zinchenko et al., 2000). The warm/hot dust in MM1 is expected to produce far-infrared photons responsible for the population of the =1 HNCO, giving rise to the HNCO (101,9–91,8) emission, however, the cooler dust in MM2 and MC would not provide sufficient far-infrared radiation to populate appreciable HNCO at 0.
The emission from SO2 and its isotopologues exhibits a significant diversity among the three cores. Besides the SO2 (115,7–124,8) emission shown in Figure 1i, the lines of SO2 (227,15–236,16), 34SO2 (111,11–100,10), 34SO2 (42,2–31,3), 34SO2 (222,20–221,21), and 33SO2 (111,11–100,10), are clearly detected in MM1. However, none of them is seen in MC or MM2. The detected transitions have ranging from 19 to 353 K, hence the temperature variation among the cores cannot solely account for the non-detection of any transition in MC or MM2. In addition, the SO2 chemistry does not seem to be much dependent on luminosity or mass of the central forming star, as bright SO2 emission was detected in low-mass star-forming regions as well (e.g., IRAS 16293-2422, Blake et al., 1994). It is therefore the chemical effect that plays a central role in shaping the appearance of SO2 in these cores. If SO2 forms via the reaction of SOOHSO2, as adopted by Charnley (1997) and Doty et al. (2002), the non-detection of SO2 points to the deficiency of OH in MC and MM2, since bright SO emission is detected toward all the three cores. This is plausible considering that the UV induced photodissociation of H2O may be the primary source of OH in MM1 (Tappe et al., 2008) and the formation of other molecules detected in MC and MM2 does not necessarily involve the OH radical. The rich emission lines from SO2 and its isotopologues seem to probe a more evolved stage of MM1, in agreement with recent sulphur chemistry models (Doty et al., 2002; Beuther et al., 2009).
With a gas temperature of 110 K and moderately rich molecular line emission, MM1 seems to be at an early hot core phase (Kurtz et al., 2000). Of the two younger cores MM2 and MC, the latter is likely more evolved with its more active molecular line emission. One issue to be addressed toward MC is that the core appears relatively faint in the dust continuum, which may be caused by the deficiency of dust or by a flattened density profile hence a large fraction of the emission being filtered out by the interferometer. With the existing data we cannot shed more light on this issue. However, its hot-core-like line emission is very likely excited by a high-mass protostar. Although nearby low-mass protostars my excite emission in complex organic molecules such as CH3OH and CH3CN (e.g. Bottinelli et al., 2004; Chandler et al., 2005), the emission may not be detectable at much larger distances. Quantitatively, if the dust and gas reach thermal equilibrium, the luminosity of the central source can be estimated based on the heating of the dust (Scoville & Kwan, 1976; Zhang et al., 2007). For dust temperatures of 35–110 K at scales of and a typical dust emissivity index of 1.5, the luminosity of the central star ranges from 2 to 4 . Thus, the central protostars in the three cores are likely to be massive.
4.2 The EHV Jet-like Outflow and Molecular Bullets
To obtain a more reasonable assessment of the mass and energetics of the SE outflow, we calculate the gas mass down to 6 km s-1; but to alleviate contamination from ambient gas and unrelated features we only take into account an area closely encompassing the jet-like structure. Following the procedure of Qiu et al. (2009), we derive the outflow mass, momentum, dynamical timescale, mass rate, and momentum rate of 0.22 , 4.9 km s-1, 2.2 yr, yr-1, and 2.2 km s-1 yr-1, respectively. Considering the missing flux and optical depth effect at low velocities, the derived mass and energetics may represent lower limits. The overlapping blue- and redshifted emission along the jet-like structure suggests that the flow axis is strongly inclined to the plane of sky. In projection the flow axis appears to wiggle over a small angle of 20∘. If the flow axis wiggles along the line of sight as it does in the plane of sky, the inclination angle is likely about 10∘, half of the wiggle angle. The outflow mass and momentum rates corrected for the inclination angle would amount to 6 yr-1 and 7 km s-1 yr-1, respectively. The one-sided appearance of the outflow is probably ascribed to the peculiar environment. In projection the central source MM2 is close () to the HH 80–81 radio jet, which is surrounded by a biconical cavity. The northwestern side of MM2 is likely deficient in dense gas and the outflow is expanding into the radio jet cavity, thus cannot create appreciable CO emission.
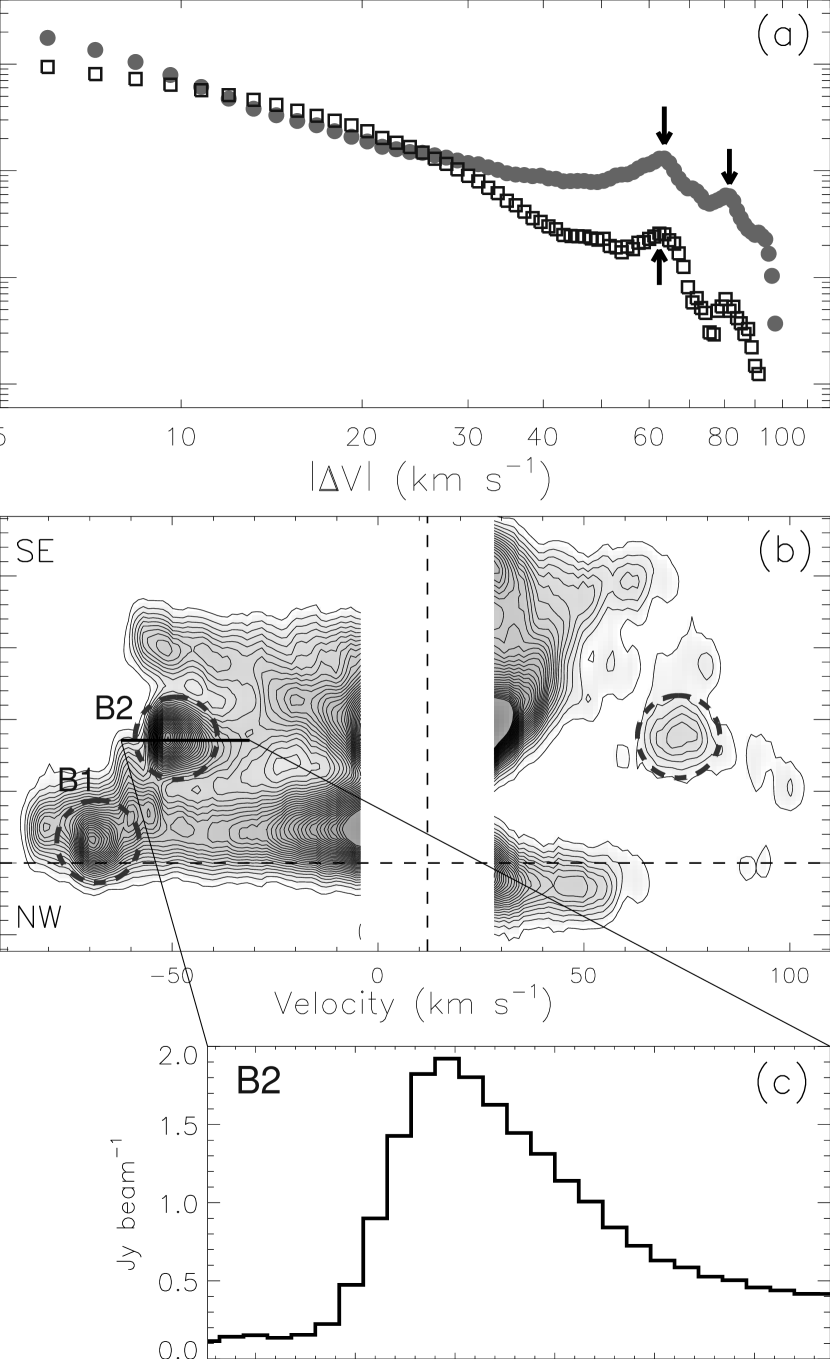
Figures 5a and 5b show, respectively, the mass-velocity (MV) and position–velocity (PV, cut along the major axis) diagrams of the SE outflow. The most interesting characteristics in the two diagrams are the distinct EHV features that appear as abrupt bumps in the MV diagram (denoted by arrows) and as enhanced condensations in the PV diagram (denoted by dashed circles). This kind of compact and fast moving features are recognized as “molecular bullets” in low-mass class 0 protostellar outflows (Bachiller et al., 1990; Hatchell et al., 1999; Nisini et al., 2007). The bullets in the SE outflow are, to our knowledge, the first discovery of molecular bullets originating from a high-mass star-forming core. The bright B1 and B2 bullets have sizes of 0.04–0.05 pc and masses of 10-3 . However, recent multi-transition SiO and CO observations yield hot gas (100 K) in low-mass molecular bullets (Hatchell et al., 1999; Nisini et al., 2007); if this is the case for the B1 and B2 bullets, their masses would reach 10-2 . It is also worth noting that the B1 bullet is clearly detected in SO (–), suggesting shock activity in this bullet (Figure 3a).
From its velocity profile shown in Figure 5c, the B2 bullet has the bulk material moving at highest velocities, with a gradual decrease toward the systemic velocity. The B1 bullet exhibits a similar but less prominent profile. The velocity structure of the two bullets is in direct contrast to what is expected if the bullets were created in situ from entrained or swept-up ambient medium, in which case the profile would have a steep decrease toward the systemic velocity (e.g., Zhang et al., 1995; Qiu et al., 2007). It is more likely that the majority of the bullet material is ejected from the close vicinity of the central protostar. In this scenario the presence of multiple molecular bullets directly manifests an episodic nature of the outflow.
Martí et al. (1999) resolved H2O maser spots toward MM2 into two groups, with one group aligned in a linear distribution and the other located to the NE. Although the H2O maser spots are seen very close to MM2 (500 AU in projection), we find that in both velocity and orientation the NE and linear maser groups agree well with the B1 and B2 bullets, respectively. This further supports the scenario that the bullets are ejected from the close vicinity of the central protostar. A sketchy and tempting interpretation is that the episodic ejections from the central protostar or star-disk system collides with the existing flow, re-accelerating the flow material to form the fast moving bullets; the maser emission, which is pumped under critical conditions, signifies the collision sites. Future proper motion measurements of the H2O maser spots and multi-transition observations of the bullets may place more stringent constraints on the excitation mechanisms of the two extreme phenomena.
High velocity, jet-like molecular outflows are often seen in low-mass class 0 protostars (e.g., Guilloteau et al., 1992; Bachiller et al., 1995; Gueth & Guilloteau, 1999; Lee et al., 2007); in theoretical models they are physically linked to the earliest-phase disk accretion within a dense envelope (Shang et al., 2006; Fendt, 2009). However, jet-like outflows with high velocity emission are still rarely identified toward high-mass star-forming regions (e.g., Qiu et al., 2007). Based on single-dish CO observations, Rodríguez-Franco et al. (1999) report high velocity bullets and jets toward the well-known Orion-KL outflow, but recent interferometric observations show a fan-shaped or explosive morphology of the outflow (Beuther & Nissen, 2008; Zapata et al., 2009). The SE outflow has a well-defined jet-like morphology, reaching an order of 100 km s-1 in both blue- and redshifted lobes, thus apparently favors a disk-mediated accretion onto the central protostar. The EHV emission may trace part of the outer layer of an underlying wind. Moreover, the outflow contains multiple molecular bullets, indicating an episodic mass-loss process and further pointing to an episodic nature of the central accretion process.
5 Summary
We report the discovery of jet-like CO outflows in the HH 80–81 star-forming region. In particular, the outflow arising from core MM2 exhibits blue- and redshifted line wings close to 100 km s-1 from the cloud velocity, and molecular bullets, which points to an episodic, disk-mediated accretion for massive star formation. Three dense cores identified in continuum and molecular line emission demonstrate physical and chemical diversities which suggest an evolutionary sequence that MM2 is younger than MC, which is in turn younger than the hot molecular core MM1.
References
- Aspin et al. (1994) Aspin, C. et al. 1994, A&A, 292, L9
- Bachiller et al. (1990) Bachiller, R., Cernicharo, J., Martín-Pintado, J., Tafalla, M., & Lazareff, B. 1990, A&A, 231, 174
- Bachiller et al. (1995) Bachiller, R., Guilloteau, S., Dutrey, A., Planesas, P., & Martin-Pintado, J. 1995, A&A, 299, 857
- Beuther & Nissen (2008) Beuther, H. & Nissen, H. D. 2008, ApJ, 679, 121L
- Beuther et al. (2002) Beuther, H., Schilke, P., Gueth, F., McCaughrean M., Andersen, M., Sridharan, T. K., & Menten, K. M. 2002, A&A, 387, 931
- Beuther et al. (2009) Beuther, H., Zhang, Q., Bergin, E. A., & Sridharan, T. K. 2009, AJ, 137, 406
- Blake et al. (1994) Blake, G. A., van Dishoek, E. F., Jansen, D. J., Groesbeck, T. D., & Mundy, L. G. 1994, ApJ, 428, 680
- Bottinelli et al. (2004) Bottinelli, S. et al. 2004, ApJ, 615, 354
- Cesaroni et al. (2005) Cesaroni, R., Neri, R., Olmi, L., Testi, L., Walmsley, C. M., & Hofner, P. 2005, A&A, 434, 1039
- Chandler et al. (2005) Chandler, C. J., Brogan, C. L., Shirley, Y. L., & Loinard, L. 2005, ApJ, 632, 371
- Charnley (1997) Charnley, S. B. 1997, ApJ, 481, 396
- Churchwell et al. (1986) Churchwell, E., Wood, D., Myers, P. C., & Myers, R. V. 1986, ApJ, 305, 405
- Doty et al. (2002) Doty, S. D., van Dishoek, E. F., van der Tak, F. F. S., & Boonman, A. M. S. 2002, A&A, 389, 446
- Fendt (2009) Fendt, C. 2009, ApJ, 692, 346
- Gómez et al. (2003) Gómez, Y., Rodríguez, L. F., Girart, J. M., Garay, G., & Martí, J. 2003, ApJ, 597, 414
- Gómez et al. (1995) Gómez, Y., Rodríguez, L. F., & Martí, J. 1995, ApJ, 453, 268
- Gueth & Guilloteau (1999) Gueth, F. & Guilloteau, S. 1999, A&A, 343, 571
- Guilloteau et al. (1992) Guilloteau, S., Bachiller, R., Fuente, A., & Lucas, R. 1992, A&A, 265, L49
- Hatchell et al. (1999) Hatchell, J., Fuller, G. A., & Ladd, E. F. 1999, A&A, 346, 278
- Hildebrand (1983) Hildebrand, R. H. 1983, QJRAS, 24, 267
- Keto & Wood (2006) Keto, E. & Wood, K. 2006, ApJ, 637, 850
- Kurtz et al. (2000) Kurtz, S., Cesaroni, R., Churchwell, E., Hofner, P., & Walmsley, C. M. 2000, in Protostars & Planets IV, ed. Mannings, V., Boss, A. P., & Russell, S. S. (Tucson, AZ: Univ. Arizona Press), 299
- Kurtz et al. (2004) Kurtz, S., Hofner, P., & Álvarez, C. V. 2004, ApJS, 155, 149
- Lee et al. (2007) Lee, C.-F., Ho, P. T. P., Palau, A., Hirano, N., Bourke, T., L., Shang, H., & Zhang, Q. 2007, ApJ, 670, 1188
- Martí et al. (1993) Martí, J., Rodgríguez, L. F., & Reipurth, B., 1993, ApJ, 416, 208
- Martí et al. (1995) Martí, J., Rodgríguez, L. F., & Reipurth, B., 1995, ApJ, 449, 184
- Martí et al. (1998) Martí, J., Rodgríguez, L. F., & Reipurth, B., 1998, ApJ, 502, 337
- Martí et al. (1999) Martí, J., Rodgríguez, L. F., & Torrelles, J. M. 1999, A&A, 345, L5
- Nisini et al. (2007) Nisini, B., Codella, C., Giannini, T., Santiago Garcia, J., Richer, J. S., Bachiller, R., & Tafalla, M. 2007, A&A, 462, 163
- Qiu et al. (2008) Qiu, K., et al. 2008, ApJ, 685, 1005
- Qiu et al. (2007) Qiu, K., Zhang, Q., Beuther, H., & Yang, J. 2007, ApJ, 654, 361
- Qiu et al. (2009) Qiu, K., Zhang, Q., Wu, J., & Chen, H. 2009, ApJ, 696, 66
- Rathborne et al. (2008) Rathborne, J. M., Jackson, J. M., Zhang, Q., & Simon, R. 2008, ApJ, 689, 1141
- Rodríguez et al. (1980) Rodríguez, L. F., Moran, J. M., Ho, P. T. P., & Gottlieb, E. W. 1980, ApJ, 235, 845
- Rodríguez-Franco et al. (1999) Rodríguez-Franco, A., Martín-Pintado, J., & Wilson, T. L. 1999, A&A, 344, L57
- Scoville & Kwan (1976) Scoville, N. Z. & Kwan, J. 1976, ApJ, 206, 718
- Shang et al. (2006) Shang, H., Allen, A. Li, Z.-Y., Liu, C.-F., Chou, M.-Y., Anderson, J. 2006, ApJ, 649, 845
- Shepherd et al. (1998) Shepherd, D. S., Watson, A. M., Sargent, A. I., & Churchwell, E. 1998, ApJ, 507, 861
- Stecklum et al. (1997) Stecklum, B., Feldt, M., Richichi, A., Calamai, G., & Lagage, P. O. 1997, ApJ, 479, 339
- Slysh et al. (2002) Slysh, V. I., Kalenskii, S. V., & ValTts, I. E. 2002, Astronomy Reports, 46, 49
- Tappe et al. (2008) Tappe, A., Lada, C. J., Black, J. H., & Muench, A. A. 2008, ApJ, 680, L117
- Zapata et al. (2009) Zapata, L., Rodríguez, L. F., Ho, P., Menten, K., & Schmid-Burgk, J. 2009, poster presented at the Millimeter and Submillimeter Astronomy at High Angular Resolution meeting, Taipei, Taiwan
- Zhang et al. (1995) Zhang, Q., Ho., P. T. P., Wright, M. C. H., & Wilner, D. J. 1995, ApJ, 451, L71
- Zhang et al. (2007) Zhang, Q., Hunter, T. R., Beuther, H., Sridharan, T. K., Liu, S.-Y., Su, Y.-N., Chen, H.-R., & Chen, Y. 2007, ApJ, 658, 1152
- Zhang et al. (1998) Zhang, Q., Hunter, T. R., & Sridharan, T. K. 1998, ApJ, 505, L151
- Zhang et al. (2009) Zhang, Q., Wang, Y., Pillai, T., Rathborne, J. 2009, ApJ, 696, 268
- Zinchenko et al. (2000) Zinchenko, I., Henkel, C., & Mao, R. Q. 2000, A&A, 361, 1079