Spectroscopy of the bright optical counterparts of X-ray sources in the direction of M 31. II
Abstract
Context. A recent survey of the Local Group spiral galaxy M 31 with XMM-Newton yielded a large number of X-ray sources.
Aims. This is the second in a series of papers with the aim of identifying the optical counterparts of these X-ray sources.
Methods. We have obtained optical spectra for 21 bright optical counterparts of 20 X-ray sources in the direction of M 31, using the 1.3-m Skinakas telescope in Crete, Greece.
Results. For 17 of the 20 X-ray sources, we have identified the optical counterpart as a normal late type star (of type F or later) in the foreground (i.e. in the Milky Way). For two more sources there were two possible optical counterparts in each case, while two more objects have X-ray properties that are not compatible with the spectral characteristics of late type non-flaring stars.
Key Words.:
Galaxies: individual: M 31 - X-rays: galaxies - X-rays: stars1 Introduction
We have embarked in an effort of identifying and classifying the objects responsible for the X-ray emission detected in the XMM-Newton major-axis survey of M 31 (Pietsch et al. 2005, hereafter PFH2005). The PFH2005 catalogue includes a total of 856 X-ray sources, some of which are within M 31 (supernova remnants - SNRs super-soft sources, X-ray binaries - XRBs and globular cluster sources, which are most likely low mass X-ray binaries within the cluster), while others are foreground stars or background active galactic nuclei (AGNs). A first classification of the sources was attempted by PFH2005 on the basis of hardness ratio criteria, however, several sources were not classifiable.
The characterization of the X-ray sources involves optical spectroscopy of candidate optical counterparts, identified via cross-correlation with the USNO-B1 catalogue (Monet et al. 2003), the Local Group Survey Catalogue (LGS, Massey et al. 2006) and the Two Micron All Sky Survey (2MASS) catalogue (Skrutskie et al. 2006). The spectroscopic observations are conducted using different sized telescopes, depending on the magnitude of the candidate optical counterpart. In a recent paper (Hatzidimitriou et al. 2006, hereafter HPM2006) we obtained optical spectra for 14 bright optical counterparts of X-ray sources in the direction of M 31 (along with sources in the direction of M33), using the 1.3-m Skinakas Telescope. The spectra were classified and their spectral classes compared against their recorded X-ray properties (fluxes and hardness ratios) to ensure compatibility between the X-ray and optical characteristics. All 14 objects in the direction of M 31 were confirmed to be foreground stars of spectral types F0 to G9.
In the present paper, we have observed another 21 bright counterparts of 20 X-ray sources in the direction of M 31 from the PFH2005 catalogue, down to a limiting magnitude of using the 1.3-m Skinakas Telescope in Crete (Greece). Of these X-ray sources, 18 had been classified as foreground star candidates by PFH2005 on the basis of their X-ray properties and another 2 were among those classified as ‘hard’ sources (XRBs, Crab-Like SNR or AGN candidates). It must be noted that none of these bright counterparts appear in the LGS catalogue, which does not provide photometry for stars brighter than about 15 mag.
In a forthcoming paper (in preparation) fainter optical counterparts of X-ray sources in the direction of M 31, observed with the 3.5-m Telescope at Apache-Point Observatory, will be discussed.
In Section 2 we describe the optical observations, in Section 3 the data reduction procedure, in Section 4 the spectral classification method and finally, in Section 5 we discuss the results, including individual objects of interest.
2 Optical Observations
The optical observations used in this study were obtained with the 1.3-m Ritchey-Cretien telescope at Skinakas Observatory, located on the island of Crete (Greece) and were carried out during three observing runs, on September 12-15, September 26-30, 2007 and on October 5-7, 2007.
We used the Low Resolution Spectrograph which is incorporated in the Focal Reducer instrument. A reflection grating of 1302 lines/mm was introduced in the collimator path, giving a nominal dispersion of 1.04Å/pixel, and a wavelength coverage from 4680Å to 6761Å. The spectra were recorded with a 2000x800 ISA SITe CCD camera. The spectral region was selected to include both the Hα and Hβ Balmer lines.
Exposure times ranged from 1800 s to 7200 s, depending on the magnitude of the object and on seeing and weather conditions. Two or more exposures were obtained per object. An arc calibration exposure (NeHeAr) was recorded before and after each object observation.
During the first observing run, 6 targets were observed. During the second run another 8 targets were observed, of which the candidate counterpart of source [PFH2005] 766, USNO-B1 1314-0014843, was resolved into two stars, both within the X-ray source (3-sigma) error circle. During the final run, 6 more target spectra were obtained. Thus, spectra for a total of 21 candidate bright counterparts of 20 PFH2005 sources were acquired. Table 1 provides a list of the optical identifications, coordinates and magnitudes of the objects observed along with a log of the observations.
-
1.
Column 1 gives the X-ray source number of the target as it appears in the corresponding X-ray catalogue paper (PFH2005). As previously mentioned, for object 766, the bright USNO-B1 star given as possible optical counterpart in PFH2005 is actually resolved into two stars on Skinakas images (with a third just outside the 3-sigma error circle of the X-ray position). Spectra of both stars were obtained. Both stars are also listed in the 2MASS catalogue.
-
2.
Columns 2 & 3 give the co-ordinates of the X-ray sources (epoch 2000) as given in the PFH2005 catalogue.
-
3.
Column 4 provides the USNO-B1 identification derived from the cross-correlation between the X-ray catalogue and the USNO-B1 catalogue.
-
4.
Columns 5 & 6 list the and magnitudes of the corresponding USNO object (B2 and R2 in the USNO-B1 catalogue). The limiting magnitude of the sample of stars observed was 14.3.
-
5.
Column 7 gives the 2MASS identification derived from the cross-correlation between the X-ray catalogue and the 2MASS catalogue.
-
6.
Column 8 provides the corresponding magnitude of the 2MASS counterpart (as given in the 2MASS catalogue).
-
7.
Column 9 provides the corresponding magnitude of the 2MASS counterpart (as given in the 2MASS catalogue).
-
8.
Column 10 gives the date of the Skinakas observation.
-
9.
Column 11 lists the total exposure time for the specific spectrum, while the number of exposures taken for that object is provided in the parenthesis following the total exposure time.
-
10.
Column 12 gives the spectral type derived in Section 4.
A total of 14 standards of spectral types ranging from O8 to M6 were observed during the three observing runs in fall 2007, with exactly the same instrument setup as the targets. The standards were supplemented by another 15 stars observed with the same instrument setup in September 2008 with spectral types between F5 and K3. These complementary data were deemed necessary, as most target stars proved to be in this spectral range, and a finer spectral-subclass grid was needed in order to perform accurate spectral classification (see Section 4). Finally, the 14 standard stars from HPM2006 were also used, ranging from O9.5 to M6, as they were observed with the same instrument setup. In this manner, a grid of a total of 43 standard star spectra was constructed.
| M 31 | |||||||||||
|---|---|---|---|---|---|---|---|---|---|---|---|
| ID1 | RA | Dec | USNO-B1 | 2MASS | Date | Exp. | Spectral | ||||
| (2000) | (2000) | ID | ID | (s) | type | ||||||
| 40 | 00 40 07.29 | 40 41 41.2 | 1306-0011378 | 16.1 | 14.3 | 00400722+4041428 | 13.55 | 13.16 | 29/09/07 | 7200 (4) | G2 |
| 42 | 00 40 07.71 | 40 31 12.3 | 1305-0011632 | 13.5 | 12.1 | 00400757+4031134 | 12.18 | 11.85 | 12/09/07 | 3600 (2) | F8 |
| 78 | 00 40 40.16 | 40 25 50.9 | 1304-0011697 | 14.4 | 14.2 | 00404007+4025532 | 13.15 | 12.79 | 14/09/07 | 7200 (4) | G0 |
| 100 | 00 40 54.54 | 40 31 32.7 | 1305-0012214 | 14.4 | 14.1 | 00405458+4031303 | 13.12 | 12.75 | 06/10/07 | 7200 (4) | F7 |
| 128 | 00 41 18.76 | 40 51 59.3 | 1308-001239 | 15.7 | 13.6 | 00411865+4051592 | 11.74 | 11.26 | 29/09/07 | 5400 (3) | G6 |
| 129 | 00 41 19.27 | 40 51 01.7 | 1308-0012400 | 13.8 | 13.9 | 00411911+4051017 | 12.01 | 11.48 | 05/10/07 | 5400 (3) | K0 |
| 273 | 00 42 29.43 | 41 29 03.0 | 1314-0013202 | 15.2 | 12.4 | 00422944+4129035 | 10.00 | 9.24 | 14/09/07 | 3600 (2) | K0 |
| 473 | 00 43 38.58 | 41 37 37.7 | 1316-0014855 | nf | 14.2 | 00433861+4137386 | 11.76 | 11.12 | 07/10/07 | 7200 (4) | K3 |
| 484 | 00 43 43.10 | 41 38 06.6 | 1316-0014885 | nf | 14.2 | 00434293+4138078 | 12.01 | 11.70 | 07/10/07 | 7200 (4) | F5 |
| 492 | 00 43 46.69 | 41 38 35.6 | 1316-0014901 | 16.1 | 14.1 | 00434663+4138360 | 11.55 | 11.00 | 07/10/07 | 7200 (4) | K2 |
| 593 | 00 44 53.31 | 42 02 15.8 | 1320-0014419 | 14.1 | 13.3 | 00445336+4202145 | 11.76 | 11.16 | 15/09/07 | 2800 (2) | K1 |
| 611 | 00 45 05.85 | 42 03 17.3 | 1320-0014588 | 13.5 | 13.1 | 00450551+4203177 | 11.80 | 11.45 | 27/09/07 | 5400 (3) | G2 |
| 662 | 00 45 38.97 | 41 56 17.3 | 1319-0014370 | 14.3 | 13.1 | 00453897+4156163 | 11.70 | 11.16 | 30/09/07 | 3600 (2) | K0 |
| 663 | 00 45 40.40 | 42 08 07.6 | 1321-0015992 | 13.9 | 11.5 | 00454053+4208066 | 10.46 | – | 12/09/07 | 2400 (2) | K4 |
| 665 | 00 45 41.26 | 42 19 40.4 | 1323-0017116 | 13.2 | 12.4 | 00454112+4219440 | 11.48 | 11.14 | 15/09/07 | 3600 (2) | G0 |
| 701 | 00 46 03.09 | 42 24 34.6 | 1324-0016254 | 14.8 | 14.0 | 00460308+4224338 | 13.08 | 12.68 | 06/10/07 | 7200 (4) | F6 |
| 741 | 00 46 23.72 | 41 21 16.7 | 1313-0014047 | 14.6 | 13.7 | 00462372+4121172 | 12.58 | 12.21 | 30/09/07 | 5400 (3) | G0 |
| 7662 | 00 46 37.75 | 41 29 05.3 | 1314-0014843 | 14.1 | 12.6 | 00463749+4129053 | 13.56 | 13.23 | 28/09/07 | 3600 (2) | G2 |
| 00463781+4129037 | 13.23 | 12.64 | 28/09/07 | 3600 (2) | K1 | ||||||
| 780 | 00 46 45.85 | 42 30 48.3 | 1325-0017703 | 14.2 | 12.8 | 00464627+4230478 | 11.74 | 11.33 | 27/09/07 | 3600 (2) | G2 |
| 840 | 00 47 26.05 | 42 21 58.9 | 1323-0018108 | 13.0 | 12.5 | 00472611+4221583 | 11.27 | 10.92 | 27/09/07 | 3600 (2) | G2 |
1 X-ray source numbers from PFH2005 (M 31), i.e. the prefix
should be added in front of each number.
2 The bright USNO-B1 star given as possible optical counterpart in PFH2005 (USNO-B1 1314-0014843) is actually resolved into two brighter stars on Skinakas images (and in 2MASS).
3 Data reduction
Data reduction was performed using standard procedures in the IRAF package 2.13-BETA2 (2006). The frames were bias subtracted, the sky was removed and the spectra traced and extracted using the all-in-one subpackage apextract. Arc spectra were extracted from the arc exposures, using exactly the same profiles as for the corresponding target spectra. The arc spectra were subsequently used to calibrate the target spectra. Whenever more than one spectrum of the same object was obtained, the calibrated spectra were combined, after weighting them according to exposure time, to yield the final spectrum.
The same reduction and calibration procedure was also applied to the set of the 43 spectroscopic standard stars. 111The spectra of the standard stars from HPM2006 were re-reduced following the procedure described here, for consistency, although no differences in the final spectra were noted.
The signal-to-noise ratio (S/N) of the raw target spectra ranged between 60 and 200. The S/N of the standard star spectra ranged from 90 to 750.
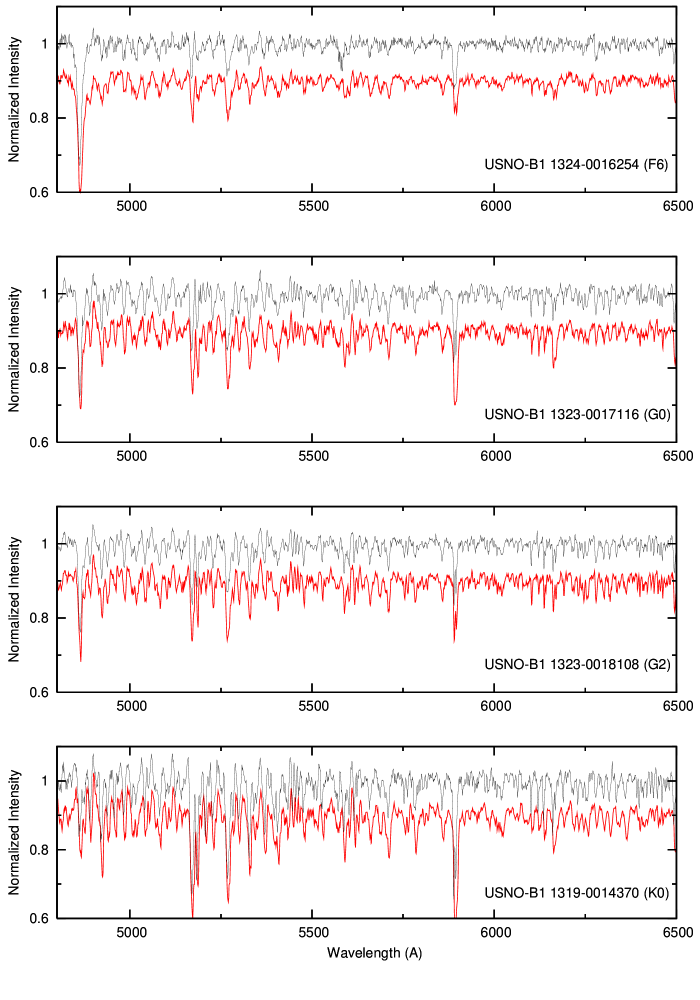
Figure 1 shows four examples of target spectra. The spectra were normalized using ordinary IRAF procedures. For presentation purposes, the wavelength region between 4800-6500 Å is shown. On the same figure we show in red the corresponding standard star spectra of the same spectral type as the target spectra, shifted in by an arbitrary amount.
4 Spectral classification
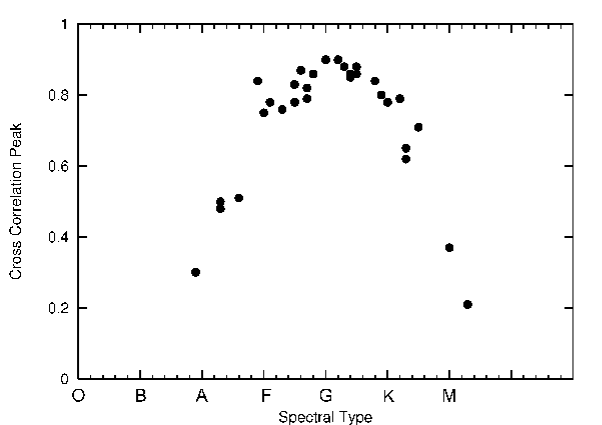
Classification of the optical spectra was achieved via cross-correlation against the grid of 43 standard star spectra222The spectral types we adopted for the standards were taken from the Catalogue of Stellar Spectral Classification (Skiff, 2009) table B/mk/mktypes (http://vizier.u-strasbg.fr/viz-bin/VizieR?-source=B/mk); when a star had more than one spectral class assigned, we adopted the most recent one., following the procedure described in detail in HPM2006, i.e. each object spectrum was cross-correlated with each standard spectrum; the height of the corresponding cross-correlation peak (hereafter, CCP), which is an indicator of the quality of the match between the target and the standard star spectral features, was recorded; these CCP heights were plotted as a function of the spectral type of the standard, with the maximum of the curve yielding the adopted spectral type for the object spectrum. As an example, Figure 2 shows the CCP vs. standard spectral type plot for object USNO-B1 1323-0017116.
As an independent check of the classification process, the spectra were also visually inspected and compared against the standard star spectra.
The spectral classes derived from the CCP vs standard spectral type plot and from the visual inspection were in very good agreement in all cases. The final spectral type adopted for each object was the average of the two estimates (CCP and visual) and it is reported in the last column of Table 1.
Conservatively, the accuracy of the adopted spectral classes is estimated to be 0.3 of a subclass, following the same arguments as in HPM2006. It is obvious that the accuracy of the spectral classification will depend on the fineness of the grid of standard spectra used, on the signal-to-noise ratio of the cross-correlated spectra, as well as on spectral class (later spectral types are easier to classify than earlier types, as molecular absorption bands are very sensitive to temperature and thus the spectrum changes noticeably between subtypes. However, these effects were taken into account by making the standard star grid denser wherever necessary). As in HPM2006, we tested the reliability of the adopted classification procedure by treating each standard in turn as an object spectrum and by cross-correlating it against the rest of the standards. In Figure 3, we show the derived spectral type for the standards as a function of the reference spectral type. A least-squares linear fit yields a slope of (correlation coefficient ), while the average disagreement between the standard and derived spectral type is 0.23 of a spectral type.

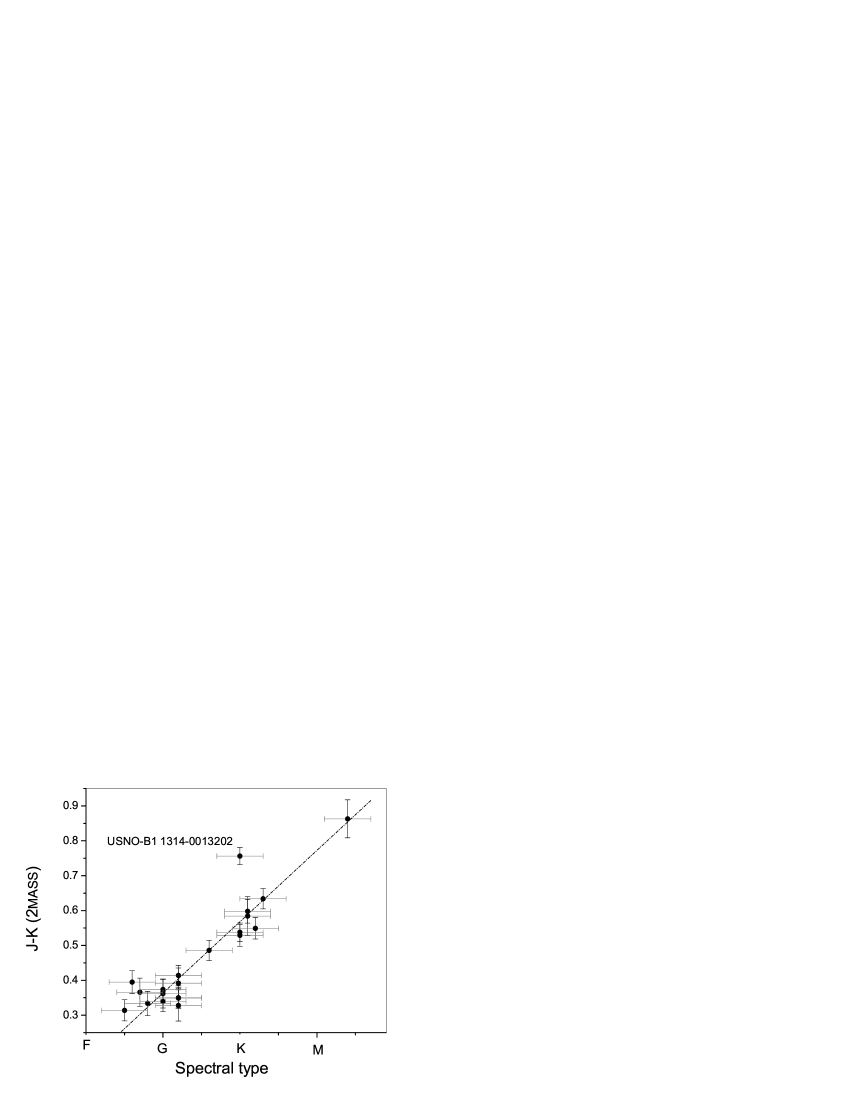
In Figure 4, we plot the derived spectral types of the optical counterparts observed against their colour as given in the 2MASS catalogue. The correlation is quite tight (correlation coefficient , excluding USNO-B1 1314-0013202, see below), and in all but one case the colour is in excellent agreement with the derived spectral type. The one exception is the spectrum of the counterpart of object [PFH2005] 273 (USNO-B1 1314-0013202) which has a spectral type K0, while its colour suggests type M. It must be noted that the star is very bright, and its recorded magnitude and colour in 2MASS may have been affected by saturation or linearity effects.
5 Discussion and Conclusions
All spectra obtained correspond to foreground stars with spectral types F5 to K4. None of the stars showed emission in H-alpha, that could be associated to flaring activity. Figure 5 shows the frequency distribution of the derived spectral types, both from the present work and from HPM2006. Spectral types peak between G0 and G5, with all but one object of type F or later. Such later type stars are known to be soft X-ray emitters due to coronal activity (e.g. Schmitt 1999, Schachter et al. 1996, Sciortino et al. 1993).
In the case of [PFH2005] 766, two late type foreground stars of similar optical magnitude lie within the error circle of the X-ray source (see Table 1). Since any of these stars could be the source of the X-ray emission, we could not identify with certainty the optical counterpart. It is also possible that the X-ray emission results from more than one star, in this case.
In the case of [PFH2005] 663, the optical counterpart USNO-B1 1321-0015992 (which is also recorded as a single star in 2MASS) is actually resolved into two close bright stars in the LGS catalogue. The two stars are also resolved on the Skinakas acquisition images, but the spectra could not be separated. The obtained -presumably composite- spectrum does not show any indication of the presence of two separate spectral components and was consistent with a K-type star.
In order to ascertain that the optical counterparts observed are indeed responsible for the X-ray emission, compatibility with the X-ray properties should be examined. In Table 2, we list the main X-ray properties of the sources (as given in PFH2005), namely the X-ray flux, , the logarithm of the ratio of the X-ray flux to the optical flux, (calculated as described in HPM2006) and the hardness ratios HR1, HR2, HR3 and HR4 (for the definition of the hardness ratios see PFH2005).
The logarithm of the ratio of X-ray flux to optical flux, , ranges between and for the F stars in the sample, between and for the G stars and between and for the K stars. These are consistent with the values expected for normal stars of types F-M (Schachter et al. 1996, Maccacaro et al. 1988, Vaiana et al. 1981). One of the G stars, the G6 star USNO-B1 1308-001239, has a relatively high value of , which places it at the edge of the expected range for G stars (Schachter et al. 1996). There is no clear correlation between and spectral type, while the ranges of the possible values of for the different spectral types largely overlap. Indeed, the soft X-ray emission caused by stellar coronal activity varies significantly within the same spectral type. This is a well known fact, which indicates that X ray coronal activity is the result of a combination of several factors that determine the efficiency of stellar coronal heating, such as stellar magnetic field, stellar rotation rate, stellar age and depth of the convection zone (see e.g. Schachter et al. 1996).
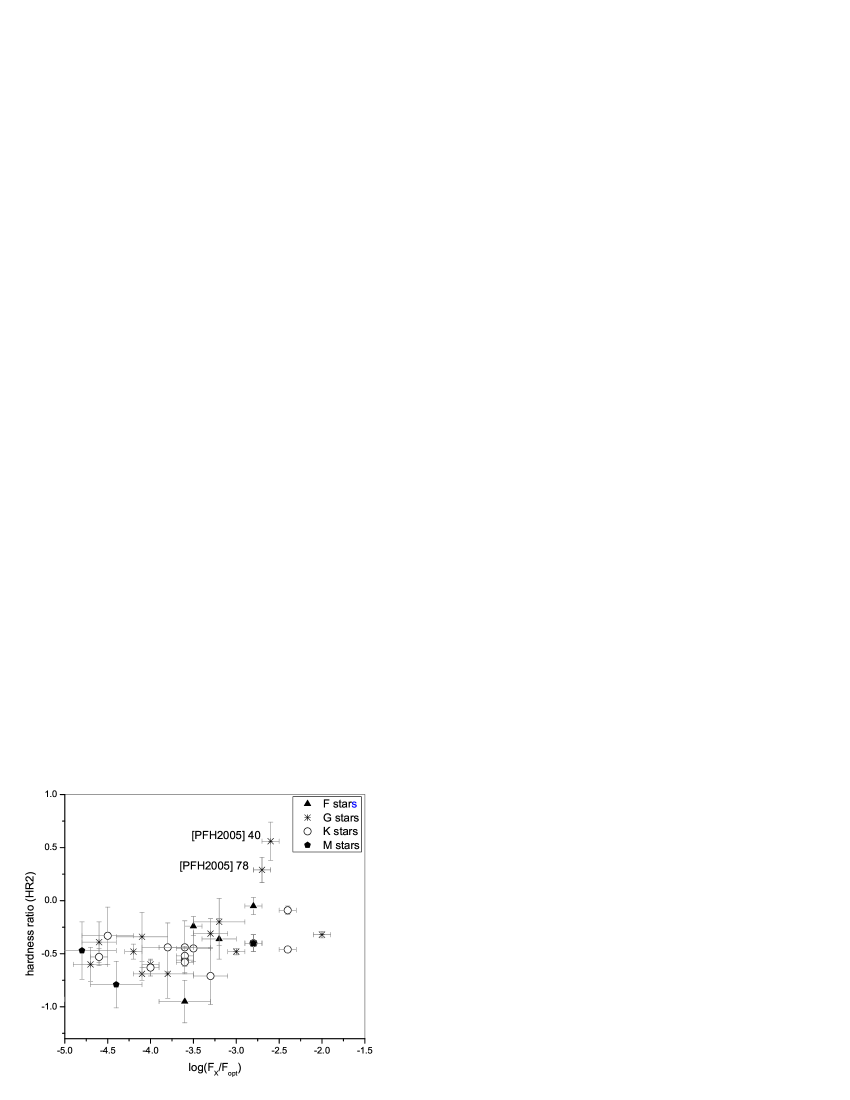
Figure 6 shows the hardness ratio HR2 against the X-ray to optical flux ratio [], marking the different spectral classes in different colours. In the same figure we have included foreground stars in the HPM2006 sample, excluding object [PFH2005] 464 with poorly defined hardness ratios (see discussion in HPM2006). All spectral types occupy the same locus on the -HR2 plane. The objects appear to lie on a horizontal branch up to -3.6; beyond this value there seems to be a small increase in hardness ratio. This behavior is similar for all the spectral types. The observed dispersion of the data points is expected to be affected by the unspecified luminosity class of the objects, as giants have on average higher hardness ratios and higher X-ray fluxes than dwarfs. Moreover high rotation can also affect the location of a star in the above diagram. Two objects, [PFH2005] 40 and [PFH2005] 78, have hardness ratios (HR2) that appear to be too high for a normal late type star. Indeed, both sources were classified as ”hard” by PFH2005. Careful inspection of the X-ray data did not provide any possible cause for an inadvertent increase of the hardness ratios recorded (such as close vicinity to a bright hard source), or show any X-ray variability. Moreover none of the stars show flaring activity in their optical spectra.
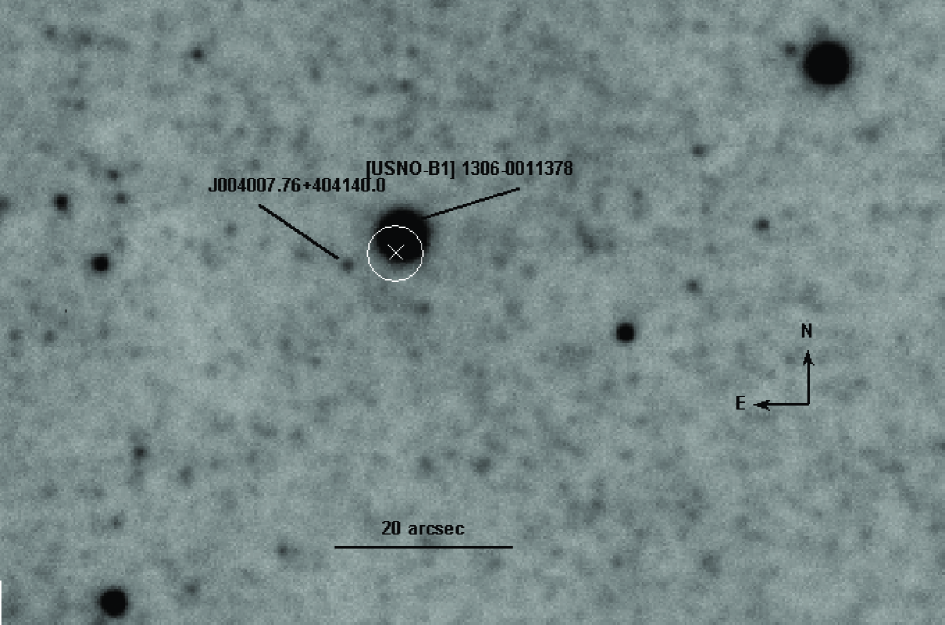
In the case of [PFH2005] 40, we observed the candidate counterpart USNO-B1 1306-0011378. There is no other optical source within the 3-sigma error radius of the X-ray source position in any of the USNO-B1, 2MASS or the LGS catalogues. The closest neighbour is the LGS object J004007.76+404140.0 at a distance of 5.48 South-East of the X-ray position and beyond the 3 sigma error radius, at a magnitude of mag and colour . It is not clear that this object is a likely counterpart of [PFH2005] 40. There may be other sources within the 3-sigma error circle that are too faint to be recorded even in the deepest optical catalogue currently available. Figure 7 shows the location of the X-ray source [PFH2005] 40 along with the 3-sigma error circle, overlayed on a LGS -band image. The locations of USNO-B1 1306-0011378 and J004007.76+404140.0 are also marked.
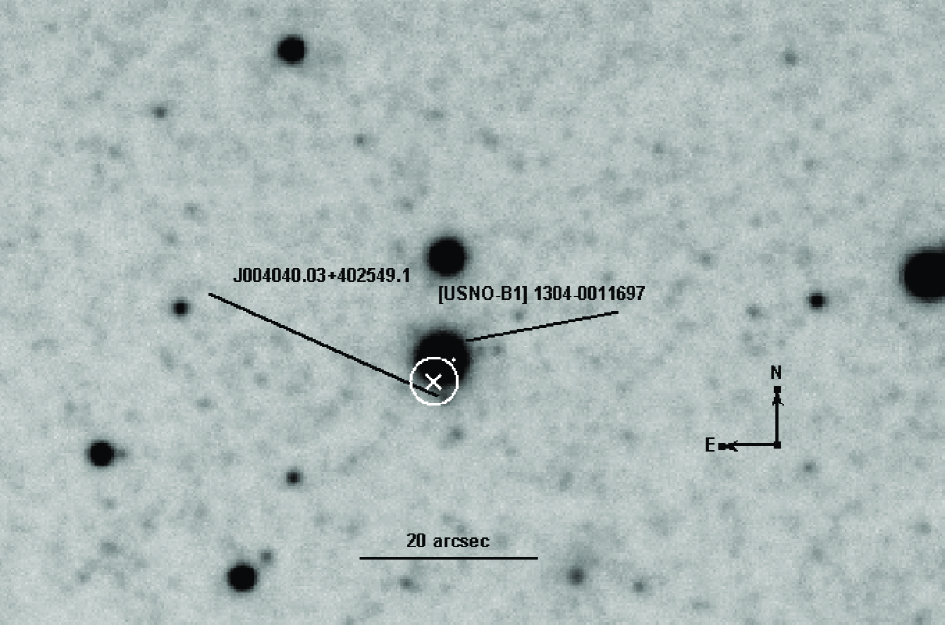
In the case of [PFH2005] 78, we observed the candidate counterpart USNO-B1 1304-0011697. Within the 3-sigma X-ray error circle, at a distance of 2.33 South-West of the X-ray position, there is a 21.3mag () object in the LGS catalogue (object ID: J004040.03+402549.1). Follow-up spectroscopy of this fainter object is necessary, in order to proceed with the identification of the counterpart of this sources. Figure 8 shows the location of the X-ray source [PFH2005] 78 along with the 3-sigma error circle, overlayed on a LGS -band image. The locations of USNO-B1 1304-0011697 and J004040.03+402549.1 are also marked.

| M 31 | ||||||
|---|---|---|---|---|---|---|
| ID1 | (mW/m2) | HR1 | HR2 | HR3 | HR4 | |
| 40 | 8.4e-151e-15 | -2.60.1 | 0.120.34 | 0.560.18 | -0.240.18 | -0.450.37 |
| 42 | 1.0e-141e-15 | -3.50.1 | 0.530.09 | -0.240.09 | -0.270.13 | -0.590.25 |
| 78 | 1.6e-142e-15 | -2.70.1 | 0.700.18 | 0.290.12 | -0.220.12 | -0.350.27 |
| 100 | 4.8e-151e-15 | -3.20.2 | 0.590.18 | -0.360.19 | -0.430.30 | - |
| 128 | 6.1e-142e-15 | -2.00.1 | 0.560.03 | -0.320.03 | -0.840.04 | -0.970.26 |
| 129 | 3.0e-154e-16 | -3.60.1 | 0.320.12 | -0.560.12 | -0.780.30 | - |
| 273 | 5.0e-142e-15 | -2.40.1 | 0.510.05 | -0.090.04 | -0.580.05 | -0.620.21 |
| 473 | 1.2e-153e-16 | -3.60.3 | 0.270.23 | -0.440.25 | - | - |
| 484 | 1.5e-154e-16 | -3.60.3 | 0.040.27 | -0.950.20 | - | - |
| 492 | 2.1e-155e-16 | -3.30.2 | 0.280.14 | -0.710.27 | - | - |
| 593 | 2.5e-157e-16 | -3.80.3 | 0.620.22 | -0.440.23 | - | - |
| 611 | 3.1e-158e-16 | -3.80.3 | 0.540.21 | -0.690.23 | - | - |
| 662 | 4.2e-157e-16 | -3.50.2 | 0.590.13 | -0.450.12 | -0.500.24 | - |
| 663 | 1.3e-135e-15 | -2.40.1 | 0.360.03 | -0.460.03 | -0.830.05 | -0.320.43 |
| 665 | 2.6e-158e-16 | -4.10.3 | 0.510.23 | -0.340.23 | -0.830.48 | - |
| 701 | 1.2e-141e-15 | -2.80.1 | 0.420.09 | -0.050.08 | -0.630.12 | -0.430.44 |
| 741 | 5.2e-151e-15 | -3.30.2 | 0.670.18 | -0.310.14 | -0.920.24 | - |
| 766 | 3.2e-144e-15 | -2.80.1 | 0.530.08 | -0.400.08 | -0.590.17 | - |
| 780 | 1.1e-143e-15 | -3.20.3 | 0.720.19 | -0.200.22 | -0.600.31 | - |
| 840 | 3.5e-141e-15 | -3.00.1 | 0.700.03 | -0.480.03 | -0.900.05 | - |
1 X-ray source numbers from PFH2005 (M 31), i.e. the prefix should be added in
front of each number.
In conclusion, we have obtained optical spectra for 21 bright optical counterparts of 20 X-ray sources in the direction of M 31, using the 1.3-m Skinakas telescope in Crete, Greece. For 17 of the 20 X-ray sources, we have identified the optical counterpart as a normal late type star (later than type F) in the foreground (i.e. in the Milky Way). For two more objects, there are two normal late type stars within the X-ray error circle, and therefore it was not possible to identify with any certainty the actual counterpart of the X-ray emission. Two more objects have X-ray properties that are not compatible with the spectral characteristics of a late type non-flaring star. In one of these cases, a fainter optical source within the error circle of the X-ray position is a possible counterpart, that needs to be confirmed.
Acknowledgements.
The authors thank T. Koutentakis, N. Primak and V. Antoniou who helped with the observations at Skinakas Observatory.References
- (1) Hatzidimitriou, D., Pietsch, W., Misanovic, Z., Reig, P., Haberl F. 2006, A&A 451, 835 (HPM2006)
- (2) Massey, P., Olsen, K. A. G., Hodge, P. W., Strong, S. B., Jacoby, G. H., Schlingman, W., & Smith, R. C. 2006, AJ, 131, 2478
- (3) Maccacaro, T., Gioia, I. M., Wolter, A., Zamorani, G., & Stocke, J. T. 1988, ApJ, 326, 680
- (4) Monet D.G., Levine S.E., Canzian B., et al., 2003, AJ, 125, 984
- (5) Pietsch, W., Freyberg, M., & Haberl, F. 2005a, A&A 434, 483 (PFH2005)
- (6) Pietsch, W., Fliri, J., Freyberg, M.J., et al. 2005b, A&A 442, 879
- (7) Schachter, J.F., Remillard, R., Saar, S.H., et al. 1996, ApJ, 463, 747
- (8) Schmitt, J.H.M.M 1999, Proceedings of the Symposium: ”Highlights in X-ray Astronomy” in honour of Joachim Trümper’s 65th birthday, eds B. Aschenbach & M.J. Freyberg, 1999, MPE Report 272, pp. 372-378
- (9) Sciortino, S., Favata, F., and Micela, G. 1993, A&A, 296, 370
- (10) Skrutskie, M.F., Cutri, R.M., Stiening, R., et al. 2006, AJ, 131, 1163
- (11) Vaiana, G. S., Cassinelli, J. P., Fabbiano, G., et al. 1981, ApJ, 244, 163