No Transition Disk? Infrared Excess, PAH, H2, and X-rays from the Weak-Lined T Tauri Star DoAr 21
Abstract
As part of a program to understand disk dispersal and the interplay between circumstellar disks and X-ray emission, we present new high-resolution mid-infrared imaging, high-resolution optical spectroscopy, and Chandra grating X-ray spectroscopy of the weak-lined T Tauri star DoAr 21. DoAr 21 (age yr and mass M☉ based on evolutionary tracks) is a strong X-ray emitter, with conflicting evidence in the literature about its disk properties. It shows weak but broad H emission (reported here for the first time since the 1950s); polarimetric variability; PAH and H2 emission; and a strong, spatially-resolved 24-µm excess in archival Spitzer photometry. Gemini sub-arcsecond-resolution 9–18 µm images show that there is little or no excess mid-infrared emission within 100 AU of the star; the excess emission is extended over several arcseconds and is quite asymmetric. The extended emission is bright in the UV-excited µm PAH emission feature. A new high-resolution X-ray grating spectrum from Chandra shows that the stellar X-ray emission is very hard and dominated by continuum emission; it is well-fit by a multi-temperature thermal model, typical of hard coronal sources, and shows no evidence of unusually high densities. A flare during the X-ray observation shows a temperature approaching K. We argue that the far-ultraviolet emission from the transition region is sufficient to excite the observed extended PAH and continuum emission, and that the H2 emission may be similarly extended and excited. While this extended emission may be a disk in the final stages of clearing, it also could be more akin to a small-scale photodissociation region than a protoplanetary disk, highlighting both the very young ages ( yr) at which some stars are found without disks, and the extreme radiation environment around even late-type pre–main-sequence stars.
1 Introduction
An open question in early stellar evolution and planet formation is the process and timescale by which stars disperse their protoplanetary disks. Central to this question is the lifetime of the gas component of circumstellar disks. The gas dominates the disk mass, but since small dust grains dominate the infrared opacity, dispersal or growth of these grains can significantly reduce or eliminate the excess infrared emission that is often taken to be the primary signature of a circumstellar disk, even if substantial gas is still present.
Related to the question of gas disk survival and evolution is the influence of X-ray emission on the circumstellar gas, and vice versa. T Tauri stars, low-mass pre–main-sequence stars, are often strong X-ray emitters (see, e.g., the review of Feigelson & Montmerle, 1999, and references therein). A detailed understanding of the X-ray emission from these young stars is important both for an understanding of the early evolution of the stars themselves, and due to the X-rays’ impact on the surrounding environment. T Tauri stars are often surrounded by disks of gas and dust, from which planets presumably form later in the pre–main-sequence phase. The physical state of these disks is strongly influenced by the star’s X-ray emission. The X-rays are the dominant source of ionization of the disk (Igea & Glassgold, 1999), they strongly influence the disk chemistry (Maloney et al., 1996), and they can be important in disk photoevaporation (Gorti & Hollenbach, 2009; Drake et al., 2009). X-ray flares from the young Sun may have produced the isotopic anomalies seen today in meteorites (Feigelson, Garmire, & Pravdo, 2002).
Similarly, the presence of circumstellar gas may play a role in shaping or modifying the star’s X-ray emission. The model for the X-ray emission of the vast majority of T Tauri stars is that the X-rays are produced by solar-type magnetic activity scaled up by rapid rotation and/or longer convective turnover times (e.g., Feigelson & Montmerle, 1999; Preibisch et al., 2005). In a small number of systems, there is also evidence that the X-rays are influenced by interaction between a stellar magnetic field and a circumstellar disk, perhaps via accretion (Kastner et al., 2002; Stelzer & Schmitt, 2004; Schmitt et al., 2005). The unprecedented X-ray spectral resolution and sensitivity of the Chandra X-ray satellite offers an opportunity to place much better constraints on the temperature and density of the X-ray emitting gas, thereby providing potentially important information about the X-ray emission mechanism(s), and about the X-ray radiation field incident on the circumstellar disk.
To date, however, only a modest number of high-spectral-resolution X-ray observations of pre–main-sequence stars have been published; even the distances to the nearest star-forming regions result in X-ray fluxes that make high-resolution observations prohibitively long. There are a handful of notable exceptions, however. TW Hya (Kastner et al., 2002) and HD 98800 (Kastner et al., 2004) both lie in the nearby TW Hya association, with a distance of roughly 50 pc and an age of 5–15 Myr (Weintraub et al., 2000, and references therein). The Chandra X-ray spectrum of TW Hya yielded a surprisingly low temperature for the X-ray emitting gas, and suggestions of very high densities in the X-ray emitting regions, leading Kastner et al. (2002) to suggest that the X-ray emission is related to accretion from the star’s circumstellar disk. Stelzer & Schmitt (2004) reached a similar conclusion based on density diagnostics in TW Hya’s XMM-Newton spectrum, and also attributed the low Fe abundance seen in the X-ray emitting gas to depletion of some elements from the gas phase onto dust grains in the disk. Schmitt et al. (2005) presented similar evidence for high-density X-ray emitting gas around the classical T Tauri star BP Tau.
In contrast, the X-ray spectra of both HD 98800 (Kastner et al., 2004) and the similarly-aged ( Myr) PZ Tel (Argiroffi et al., 2004) are quite similar to spectra of older solar-type stars and show no evidence for unusually high densities, suggesting that their X-ray activity is, to first order, scaled-up solar activity. Solar-like X-ray activity is also seen in AB Dor (Sanz-Forcada, Maggio, & Micela, 2003), which is near or recently arrived on the zero-age main sequence. Notably, TW Hya and BP Tau show clear evidence of active accretion from their circumstellar disks, while the stars with more solar-like X-ray emission do not have disks.111Only the southern component (HD 98800 B) of the wide binary pair in HD 98800 has circumstellar material (Koerner et al., 2000), while Kastner et al. (2004) show clearly that the X-ray spectrum they detect and analyze is from the diskless northern component, HD 98800 A. In general, while accretion may modify the X-ray spectrum in some young stars, studies of the X-ray emission from large samples of young stars show that accretion is not a primary driver of X-ray activity (Preibisch et al., 2005; Stassun et al., 2006).
In the context of understanding both disk evolution and the interplay between disks and X-rays, the weak-lined T Tauri star DoAr 21 (a.k.a. V2246 Oph, Elias 2-14, VSSG 23, GSS 23, ROXs 8, Haro 1-6, YLW 26, HBC 637, ROXR1 13) presents an interesting case study. It has no strong evidence for accretion or a massive disk, and yet it is one of the few T Tauri stars around which emission from H2 and polycyclic aromatic hydrocarbon (PAH) molecules has been detected (Sec. 2.2). Bary et al. (2002) suggest that it may retain a gas-only disk in which all of the dust has coagulated into larger grains; Cieza et al. (2008) classify it as a “transition disk,” one in the process of being cleared from the inside out. In addition, it is the most luminous X-ray source in Oph, making it an excellent laboratory to study the influence of X-rays and circumstellar material.
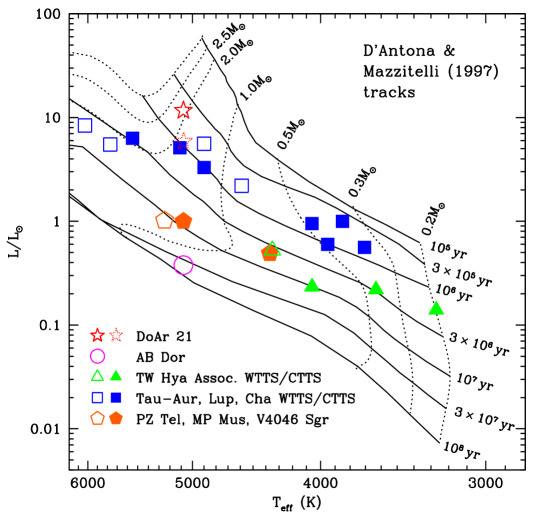
Here we present new Gemini mid-infrared images, high-resolution optical spectra, and Chandra high-resolution grating spectra of DoAr 21. The primary contrast of DoAr 21 with the handful of pre–main-sequence stars previously observed at high X-ray spectral resolution (Fig. 1) is the combination of its youth and lack of a strong accretion signature. DoAr 21 is embedded in the Oph star-forming region (see Wilking, Gagné, & Allen 2008 for a recent review), whereas a number of the others (e.g., TW Hya, Hen 3-600, MP Mus, and V4046 Sgr, with ages of –30 Myr) no longer lie in regions of active star formation, with all surrounding molecular gas having been dissipated. With an estimated age of Myr, DoAr 21 is younger than these other stars. A few of the stars observed with high X-ray spectral resolution (e.g. T Tau, BP Tau, RU Lup) are of a similar age to DoAr 21, but all are classical T Tauri stars with strong accretion signatures. The central questions here, then, are how much difference the young age and lack of strong accretion make in the X-ray emission of DoAr 21; what the distribution and physical conditions of its circumstellar material are; and how the high-energy radiation field incident on the circumstellar material may influence its properties.
Below we discuss the stellar and circumstellar properties of DoAr 21 (Sec. 2), showing new images of its circumstellar material, which, surprisingly, is not present near the star but which extends to several hundred AU. We present new high-resolution optical spectra which show that DoAr 21 is probably not accreting, but which are consistent with strong chromospheric activity. In this light, we then present our new X-ray observations (Sec. 3) and analyze the X-ray emission in detail through emission-line-ratio fits, modeling of the entire spectrum, and analysis of time variability of the emission before, during, and after a large flare. In Sec. 4, we discuss the influence of the star’s X-ray and ultraviolet emission on its circumstellar environment. Based on the level of activity suggested by our X-ray observations, we estimate the far-ultraviolet (FUV) flux, suggesting that it is sufficient to excite the observed PAH emission even at hundreds of AU from the star. Finally, we present a possible geometry for the H2 emission, suggesting that it may be more akin to a photo-dissociation region (PDR) than a circumstellar disk.
2 DoAr 21’s stellar properties and circumstellar environment
Before considering our new X-ray data for DoAr 21, here we consider new and existing data from other wavelengths, including new mid-infrared imaging and high-resolution optical spectroscopy. We also consider infrared and optical photometry and spectroscopy from the literature in order to build up a more complete picture of the stellar properties and circumstellar environment of DoAr 21.
2.1 Stellar properties and multiplicity
Spectral types in the literature are K0 (Bouvier & Appenzeller, 1992; Martín et al., 1998) from optical spectra and K0–K2 (Luhman & Rieke, 1999) from near-infrared spectra. Following Luhman & Rieke (1999), we adopt a spectral type of K1 and effective temperature of 5080 K.222The spectral type of B2 found in some references, and as of this writing in Simbad, is from Chini et al. (1977), and is based on B, R, I, and K photometric colors. The authors did not find a unique combination of spectral type and extinction that fit the data; assuming an extinction of they found a spectral type of B2, and assuming –6.2 they found a spectral type of G5–K0. A follow-up paper by Chini (1981) used a broader range of colors and found and a spectral type of K0, consistent with what we find here. The distance to DoAr 21 from a VLBA parallax measurement is pc (Loinard et al., 2008). Using this distance and our fit to the de-reddened spectral energy distribution (Sec. 2.2), we estimate the stellar luminosity to be , where the uncertainty arises primarily from the large photometric variability and somewhat uncertain extinction.
The VLBA observations of Loinard et al. (2008) show DoAr 21 to be a binary, with a projected separation of 5 mas (0.6 AU) in one of their observations. The orbital parameters are uncertain, but Loinard et al. estimate the semimajor axis to be 1–2 AU. Since the binary pair has been detected only at radio wavelengths thus far, there is no information about the mass ratio or the optical luminosity ratio. Ascribing all of the luminosity to the primary star (solid-lined star in Fig. 1) yields a mass of and an age of yr. If the luminosity is split equally between the two stars (dotted star in Fig. 1), the mass of each star is and the age is yr. There is some evidence in the optical spectra (Sec. 2.4) that the secondary is contributing to the observed line width, suggesting that its optical luminosity is non-negligible; thus the latter set of parameters may be closer to reality. We note that DoAr 21 is relatively massive among T Tauri stars, and it has a K spectral type only because of its very young age. By an age of 3–4 Myr, it will move into the spectral type range of Herbig Ae/Be stars, and it will arrive on the main sequence as a late B or early A star.
2.2 Spectral energy distribution and infrared excess
The evidence in the literature for circumstellar material around DoAr 21 (and accretion of such material) is mixed, and DoAr 21 has often been considered (e.g., Lada & Wilking, 1984; André et al., 1992; Preibisch, 1999; Bontemps et al., 2001) to be a Class III or diskless T Tauri star, though some sources have stated that it has an infrared excess (e.g., Bouvier & Appenzeller, 1992), and it has recently been classified as a “transition disk” system, with a cleared inner disk but optically thick outer disk (e.g., Cieza et al., 2008).
In light of the lack of a strong infrared excess, the detection of emission features from PAHs (Hanner, Brooke, & Tokunaga, 1995) and H2 (Bary et al., 2003; Bitner et al., 2008) was surprising, raising the possibility that a substantial gas component of the disk is still present. Early observations showed H with bright and variable emission (Haro, 1949), and then later weakly in emission (Dolidze & Arakelyan, 1959; Hidajat, 1961). Since then, however, no published observations of the star have shown H emission (Rydgren et al., 1976; Montmerle et al., 1983; Feigelson & Montmerle, 1985; Wilking et al., 1987; Bouvier & Appenzeller, 1992; Martín et al., 1998). Br is in absorption with no near-infrared veiling (Luhman & Rieke, 1999). Our new high-resolution optical spectra (Sec. 2.4) show that the photospheric H absorption line is partly filled in with emission and is surrounded by weak but very broad ( km s-1 FWHM) emission wings, revealing a weak and variable emission component that is consistent with the H emission seen in older, coronally-active low-mass stars and which thus suggests that there is little to no accretion onto DoAr 21.
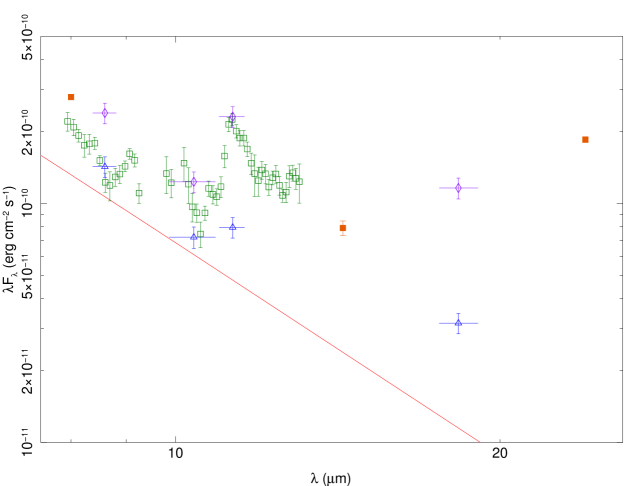
The spectral energy distribution (SED) of DoAr 21 gives some clues to the nature of its circumstellar environment. We searched the literature for available photometry of DoAr 21, and assembled the SED from µm ( band) to mm. The observed broad-band colors are much redder than photospheric colors for a K1 star. To de-redden the photometry and to determine whether or not DoAr 21 shows any evidence of infrared excess, a signature of the presence of a circumstellar or circumbinary disk, we compared the SED of DoAr 21 to a model photosphere (Buser & Kurucz, 1992) with K (Fig. 2). We adopt the extinction law of Weingartner & Draine (2001a), with the modifications of Draine (2003). This extinction law has been shown to be a better fit to mid-infrared data than a power-law extrapolation from the near-infrared (Román-Zúñiga et al., 2007; Chapman et al., 2008; McClure, 2009). We use a ratio of total-to-selective extinction , determined from the relationship (Vrba et al., 1993), where µm is the wavelength of maximum observed polarization for DoAr 21 (Martin et al., 1992). This value of is consistent with results found for other lines of sight in Ophiuchus (Vrba et al., 1993) and yields a notably better fit to the data than the standard interstellar value of . Physically, a larger corresponds to larger grain sizes, as expected in a dense cloud. Using this extinction law, we de-reddened the photometry to find the best fit of the model photosphere to the , , and data, as the and data show significant variability and the longer-wavelength data may be affected by any infrared excess. This procedure yielded mag, and combined with our adopted distance, a photospheric luminosity of . This corresponds to a stellar radius of if all of the luminosity is attributed to one star. The adopted corresponds to . We note that this is consistent with the neutral hydrogen column density of atoms cm-2 found from the X-ray spectrum (Sec. 3); from a sample of 20 sources with good X-ray and infrared data in the Oph cloud, Vuong et al. (2003) find cm-2 mag-1. Given the differences in extinction laws used, our adopted extinction is reasonably consistent with that found by other authors; Luhman & Rieke (1999) find mag, and Bouvier & Appenzeller (1992) find . The de-reddened photometric data are plotted in Figure 2; the millimeter-wavelength upper limits of André et al. (1990) and Cieza et al. (2008) are not shown.
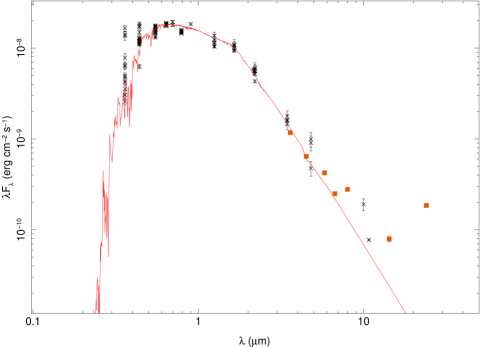
While the observed optical and near-infrared variability (see Section 4.1.5) makes it impossible to fit every data point, the photometry is broadly consistent with the model photosphere within the uncertainties for µm. There is some evidence for excess emission at and , which may be due to flaring as discussed below. While the brightest and points are clearly inconsistent with photospheric emission, the fainter points lie close to the model photosphere, consistent with a scenario in which DoAr 21 is flaring much of the time.
At longer wavelengths, there is a clear infrared excess at –24 µm. These points are quite insensitive to extinction corrections, since the extinction is so small, and to the determination of the star’s effective temperature, since they lie on the Rayleigh-Jeans tail of the photospheric emission. The space-based infrared data are highlighted in the figure as squares (orange in the on-line edition), as they are not affected by the Earth’s atmosphere and are measured on a uniform photometric system; the and 14 µm points are ISO data from Bontemps et al. (2001), while the other –24 µm squares are Spitzer IRAC and MIPS data from Cieza et al. (2007). While the presence of an excess shortward of 7 µm is debatable, the 8–24 µm points are well in excess of the photospheric emission, indicating the presence of some circumstellar material within a radius of 4″–9″, the aperture size of the mid-infrared observations. This circumstellar material apparently does not have a large mass in small dust grains, however, given the very sensitive flux upper limits of mJy at µm (André et al., 1990) and mJy at µm (Cieza et al., 2008).
2.3 Mid-infrared imaging
2.3.1 Archival Spitzer images
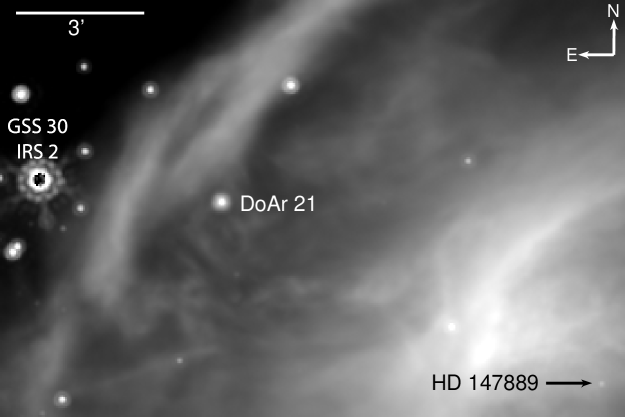
DoAr 21 was observed by the Spitzer Space Telescope with both IRAC (, 4.5, 5.8, 8.0 µm) and MIPS (, 70, and 160 µm) as part of the c2d Legacy program (Cieza et al., 2007; Padgett et al., 2008). PSF-fitting photometry of DoAr 21 from 3.6–24 µm is reported by Cieza et al. (2007) and plotted in Figure 2; here we concentrate on the images themselves. Figure 3 shows the µm image of the region around DoAr 21; DoAr 21 itself is clearly detected. Visual examination of the µm images shows a source at the position of DoAr 21, but the noise is too high for accurate photometry.
Surprisingly, the 24-µm emission from DoAr 21 is somewhat extended. Close inspection of the 24-µm MIPS images reveals that the profile of DoAr 21 is different from that of other stars in the field. Since Spitzer is diffraction-limited at 24 µm, the point-spread-function (PSF) is a modified Airy pattern, and indeed many of the sources in Figure 3 (including sources that are fainter than DoAr 21 and/or projected on comparable or brighter background emission) show the presence of the first Airy ring. DoAr 21 does not, however, indicating that it is not a point source at 24 µm. To check this, we compared the azimuthally-averaged radial profile of DoAr 21 to that of a star in the same image (GSS 26), and also to a sample empirical on-orbit PSF (constructed from many stars in a MIPS mosaic image of the Trapezium) supplied by the Spitzer Science Center (SSC). DoAr 21 is clearly more extended than the other stars, both of which show the signature of the first Airy ring at radii of 3–5 pixels, while DoAr 21 does not. (The diffraction limit of Spitzer at 24 µm is 74, while the MIPS mosaic pixel size is 245, so the first null occurs at a radius of 3 pixels.) We examined three different MIPS mosaic images, and DoAr 21 appears extended in all of them. We also examined the individual baseline-calibrated data (BCD) frames from the SSC archive (from which the mosaics were constructed), and found that DoAr 21 appears extended in each frame, regardless of its position on the chip, while other stars in the frame do not. Thus, the broader profile of DoAr 21 is not an artifact of the mosaicing process.
To estimate the radial extent of the emission, we convolved an oversampled MIPS PSF with Gaussians of different radii, resampled them at the MIPS pixel scale, and compared their radial profiles to that of DoAr 21. The profile of DoAr 21 is roughly consistent with a Gaussian source with a sigma of 0.75–1 MIPS pixel (18–25). At the 122 pc distance of DoAr 21, this corresponds to a FWHM of 500–700 AU. Thus, the 24-µm emission appears to be extended to radii of 250–350 AU from the star.
2.3.2 New Gemini images
Motivated by the extended emission seen in the Spitzer images, we observed DoAr 21 with the T-ReCS camera on Gemini South in June and July 2007. The observations were made through filters with central wavelengths (and 50% transmission widths) in µm of 8.6 (), 10.4 (), 11.3 (), and 18.3 (). The 8.6 and 11.3 µm filters are centered on PAH features, while the 10.4 µm Si-4 and 18.3 µm Qa filters largely measure continuum emission. In particular, the Si-4 filter acts as a nearby continuum reference for any PAH emission.
The data were taken with the standard chop and nod technique to remove sky background emission, and were processed with the standard Gemini IRAF pipeline.333IRAF is distributed by the National Optical Astronomy Observatories, which are operated by the Association of Universities for Research in Astronomy, Inc., under cooperative agreement with the National Science Foundation. The chop throw was 15″ at a position angle of 130°, parallel to the ridge of 24-µm emission seen in the Spitzer images (Fig. 3); this chop direction was chosen to minimize variation of the background emission.
The data were flux-calibrated with observations of HD 136422 (K5 III) at a similar airmass and near in time to the DoAr 21 observations in each filter. Fluxes for HD 136422 were taken from the calibrated template spectrum created by Cohen et al. (1999). Because the target and calibrator were observed at similar, low () airmasses and near in time to each other, we did not attempt to correct for differential atmospheric extinction between target and calibrator observations.
The spatial resolution of our observations, as measured by the FWHM of standard stars observed at similar airmass to DoAr 21, was 035–038 in the 8.6–11.3 µm observations, and 058 at 18.3 µm. This is near the diffraction limit of Gemini South, and is well-sampled by the T-ReCS pixel scale of 009 pixel-1.
The resulting images are shown in Figure 4. Irregular, extended emission is seen at all wavelengths. The emission is brighter in the filters containing PAH features (8.6 and especially 11.3 µm) than in the 10.4 µm continuum, suggesting that the extended material shows PAH emission. The brightest off-source emission is a spot roughly 11 north of DoAr 21, and there is a ridge or partial arc of emission to the north and west, seen in all filters.
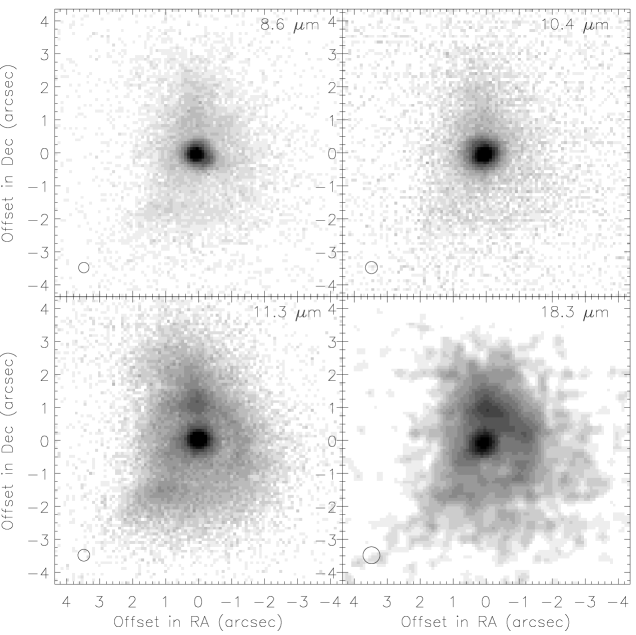
The central stellar source in the 8.6–11.3 µm DoAr 21 images appears point-like at our resolution; it has a FWHM similar to that of the photometric calibrator in the corresponding band. The slight extension of the PSF at PA ° in the 8.6 µm images is also seen in the calibrator. The central source in the 18.3 µm image has FWHM of 06–10; given the much lower signal-to-noise ratio at this wavelength, it is difficult to tell if the central source is extended, though certainly there is significant extended emission beyond this.
The extended emission is quite asymmetric, unlike the emission expected from a disk. There is a partial arc or ring to the north and west (seen most prominently at 11.3 and 18.3 µm) at roughly 11 from the star. There are bright knots at position angles of roughly 0° and 140°, with the northern knot appearing both brighter and more concentrated, and the SE knot being visible to larger radii, especially at 18.3 µm. As shown in the star-subtracted azimuthal profile in Figure 5, there is a roughly 4:1 contrast between the brightest and faintest position angles.
Archival HST WFPC/2 images of DoAr 21 in the F606W and F814W filters show a faint filament extending 8″–10″ southeast from the star; the filament is not apparent in images in the F1042M filter. There is no obvious brightness gradient along the filament, so Stapelfeldt et al. (2009) suggest that it is foreground or background material illuminated by the star, rather than a jet associated with the star. This filament is also visible in the narrow-band near-infrared images of Gómez et al. (2003), in filters both on and off the H2 1–0 S(1) line. Comparison of the WFPC/2, near-IR, and Gemini images shows that this filament overlaps the extension seen in Figure 4 at PA 140°. Thus, the circumstellar material apparently extends to even larger radii than seen in our images, at least in some directions. We discuss this point further in Section 4.

To quantify the spatial distribution of circumstellar material, and in particular to see whether there is any infrared excess emission that is not spatially resolved, we measured the flux in our images in apertures of different radii. We chose aperture radii of 082, 275, and 6″. The smallest radius corresponds to a physical radius of 100 AU, a typical disk radius for a young star; the intermediate radius matches the aperture used by Hanner et al. (1995) for their mid-infrared spectroscopy; and the largest radius encompasses all the detected flux above the background level in our images, probing roughly the same spatial scale as the MIPS 24-µm images. These fluxes are quoted in Table 1 and plotted in Figure 6. There is little infrared excess within 100 AU of the star, while the photometry of the more extended emission is roughly consistent with previous photometry.
| Filter | Flux within 082 | Flux within 275 | Flux within 6″ |
|---|---|---|---|
| (mJy) | (mJy) | (mJy) | |
| 8.6 µm (PAH) | 313 | 525 | 596 |
| 10.4 µm (Si-4) | 176 | 300 | 347 |
| 11.3 µm (PAH) | 234 | 680 | 816 |
| 18.3 µm (Qa) | 165 | 607 | 728 |
Given the clear presence of a significant amount of circumstellar material, but evidence that little of it is close to the star, we now turn to the question of whether there is any evidence for accretion onto DoAr 21.
2.4 Optical spectrum
As noted in Section 2.2, the H emission from DoAr 21 has shown varying behavior at different times in the past, and thus additional spectroscopic observations are useful to probe this behavior. In addition, DoAr 21’s stellar rotation period is unknown, as it did not show periodic photometric variability in the observations of Bouvier et al. (1988); thus, measurement of its projected rotational velocity is useful.
To probe the H emission and stellar rotation of DoAr 21, we observed it with the echelle spectrograph on the CTIO Blanco 4-meter telescope on 2002 June 12 and 14, and on the four consecutive nights 2003 April 11–14. The spectrograph setup gave wavelength coverage of approximately 5,000–8,000 Å with 0.08 Å/pixel. With a 1″ slit width, this gave a spectral resolving power (as measured from the FWHM of narrow lines in a ThAr comparison lamp spectrum) of at the H line. Exposure times were 20 minutes on 2002 June 12, 15 minutes on 2003 April 11 and 30 minutes on the other four nights. The data were reduced using standard routines for echelle spectra in IRAF.
Our spectra show broad absorption lines. There is no obvious evidence in the spectra of doubled lines from a binary companion, though the broad lines and relatively low signal-to-noise ratio limit our ability to detect other lines. The Li I 6708 Å absorption line has an equivalent width of mÅ, consistent with the measurement of Martín et al. (1998). From our spectra we measure a radial velocity of km s-1, consistent with the velocity of km s-1 measured by Massarotti et al. (2005), and with the Oph young-star mean of km s-1 (Prato, 2007). Comparison of our spectra with a K1 V standard spectrum artificially broadened to various velocities gives a projected rotational velocity km s-1 for DoAr 21. Combined with the stellar radius of 4.6 R☉ estimated from its effective temperature and luminosity (attributing all the luminosity to one star), this gives a rotational period of around 3 days, or less if the star is not viewed equator-on.444Bary et al. (2003) suggest that the inclination DoAr 21 is greater than 55°. If this is the case, then the equatorial rotational velocity is greater than 100 km s-1.
Given the discovery that DoAr 21 is a binary (Sec. 2.1), however, there is an alternate interpretation of the width of its spectral lines. Massarotti et al. (2005) report km s-1 for DoAr 21. The origin of the discrepancy between their determination and ours is unclear, but it could result from observing a binary at different orbital phases, so that sometimes the lines are broadened (though not clearly doubled) due to different radial velocities of the two stars. The Massarotti et al. (2005) spectra, measured at similar spectral resolution but with less spectral coverage and lower S/N, show some variation in the width of the cross-correlation peak, which is a measure of the line width, occasionally showing broader peaks (D. Latham, personal communication). Our spectra show consistently broad lines, and none of our six spectra is consistent with as low as 29 km s-1. We repeated the procedure used by Massarotti et al. (2005) on our spectra, cross-correlating various artificially broadened template spectra with DoAr 21 to find the template that gives the highest correlation peak, and we consistently find 80 km s-1. However, our spectra cover only two windows of a few days each, so it is possible that both our 2002 and 2003 observations were obtained at orbital phases with relatively large velocity differences. If we assume an equal-mass binary, the evolutionary tracks in Figure 1 give masses of for each star, or a total system mass of . With an assumed semimajor axis of 1–2 AU (Loinard et al., 2008), the relative orbital velocity of the two stars in a circular orbit would be 40–60 km s-1, which is of the right magnitude to account for the difference in line broadening observed in our spectra and those of Massarotti et al. (2005). The inferred orbital period of 0.5–1.5 yr from these orbital parameters is also consistent with our two observations (separated by ten months) falling either half or a whole orbital period apart, so that the same velocity difference would be observed.
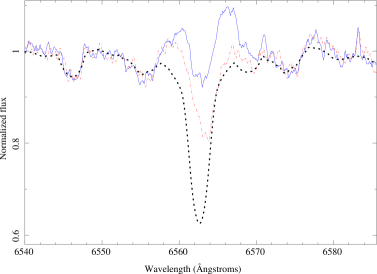
DoAr 21 has at times shown H in emission in the past (Haro, 1949; Dolidze & Arakelyan, 1959; Hidajat, 1961), while other observations have shown H absorption. Our observations, shown in Figure 7, show a combination of both. There is a central photospheric absorption line, but our high spectral resolution reveals the presence of broad emission wings. In addition, comparison with the K1 V spectral standard HD 13445 (Keenan & McNeil, 1989), artificially broadened to km s-1, shows that DoAr 21’s H absorption line is substantially filled in with emission. After correcting for the underlying photospheric absorption, the emission component we observe in DoAr 21 has an emission equivalent width of 1–2 Å.
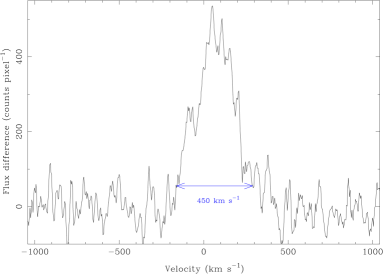
Further, the line varies substantially from one night to the next. Figure 7b shows the difference between two nights, clearly showing the presence of a broad, variable emission component at H. The emission shown here is a lower limit to the true H emission line flux, since any emission component present on both nights is subtracted out. The FWHM of the emission is km s-1, while the full width at 10% intensity is km s-1. White & Basri (2003) propose that stars with H full width at 10% intensity of km s-1 should be considered classical T Tauri stars, arguing that the line velocity width is a better accretion diagnostic than the more commonly used equivalent width; they observe a range of line widths from 270 to 670 km s-1 in accreting sources. By this measure, DoAr 21 could be considered to be a classical (accreting) T Tauri star, and indeed Bary et al. (2002) suggest that DoAr 21 is still accreting material from a disk based on their detection of H2.
While it is possible that DoAr 21 could have some low-level accretion, its H emission is also consistent with a lack of accretion, since some stars that are not thought to be accreting show H behavior similar to that seen in DoAr 21. Montes et al. (1997) find that some chromospherically active binary stars show H emission that is well-fit by a broad component and a narrow component, with the broad component having FWHM values from 133 to 470 km s-1. Fernández et al. (2004) find that the quiescent (non-flare) spectrum of the weak-lined pre–main-sequence triple system V410 Tau has H that is just filled in, not overtly in emission, while during a flare the H equivalent width is 27 Å. After subtraction of a photosphere of the correct spectral type from the quiescent spectrum, they find that the residual H emission line (equivalent width Å, similar to the emission component from DoAr 21) has a broad component with a FWHM of 300–400 km s-1. During a flare, the H line is observed to be in emission with FWHM of 730 km s-1, with its width declining as the flare decays. V410 Tau shows no evidence of infrared excess or other indicators of accretion, though definitive detection of a very weak infrared excess might be difficult given the shortage of resolved infrared measurements of the three stars (all within 03; White & Ghez 2001) in the system. There is no detectable emission in the CO fundamental (Najita, Carr, & Mathieu, 2003) nor H2 FUV lines (Herczeg et al., 2006). With no evidence of either a gas or a dust disk around V410 Tau, the H seems more likely to be related to the flares than to accretion. Thus, broad Balmer emission lines are not by themselves an unambiguous indicator of accretion.
We revisit the question of what the H and H2 emission tell us about DoAr 21’s circumstellar material in Section 4. Here we simply note that the chromospheric activity implied by one interpretation of the H emission, and the need for a strong UV flux to excite the H2 and PAH emission, both imply a need for a better understanding of the high-energy emission from DoAr 21. Thus, we now turn to an examination of our new high-resolution X-ray spectrum of DoAr 21.
3 X-ray emission
DoAr 21 is the brightest X-ray source in the Oph cloud core A, with an X-ray luminosity of nearly ergs s-1, a hard thermal spectrum, and large X-ray flares seen in several archival observations at a rate of nearly one per day. Its X-ray emission has been observed at low resolution with Einstein (Montmerle et al., 1983), ROSAT (Casanova et al., 1995), ASCA (Koyama et al., 1994), and Chandra (Imanashi et al., 2002; Gagné et al., 2004).
The new Chandra grating spectra we present here have vastly superior spectral resolution compared to any of these previous datasets, enabling us to extract temperature and abundance information with more reliability and also, for the first time, to examine density diagnostics. Given the high rate of flaring seen in previous observations, it is not surprising that we detected a large flare in our 94 ksec Chandra observation. Thus, we can bring the same temperature and abundance diagnostic tools to bear on the pre-flare, flare, and post-flare portions of the new dataset.
The High Energy Transmission Grating Spectrometer (HETGS) has two grating arrays: the Medium Energy Grating (MEG), with a FWHM resolution of 2.3 mÅ; and the High Energy Grating (HEG), with a resolution of 1.2 mÅ (Canizares et al., 2005). Both grating arrays operate together, with the dispersed spectra (first, second, and third orders) as well as the zeroth order spectrum recorded on the ACIS CCD array. We used standard CIAO (v.3.3) tools to extract the dispersed spectra, and to create observation-specific spectral response matrices and effective area tabulations, as well as to create light curves and also to extract spectra for each of the three subsets of the observation. Of the dispersed spectra, only the first order spectra have a significant number of counts. The zeroth order spectrum is severely piled up, so we restrict the analysis we report on here to the first order MEG and HEG spectra. We performed most of the spectral analysis using xspec v.12.3.
The goal of our X-ray spectral and timing analysis is to characterize the properties of the hot plasma on this very magnetically active pre–main-sequence star, and to compare its properties to those measured in other pre–main-sequence stars with high-resolution X-ray spectra. Its extreme youth and lack of obvious signatures of accretion make for an interesting contrast between DoAr 21 and the strongly accreting T Tauri stars that have been well-studied with the Chandra gratings (Güdel & Telleschi, 2007). Although DoAr 21 is not a classical T Tauri star, it does—as we have detailed in the previous section—have some circumstellar material in its vicinity. The observed X-rays, and the unobservable far- and extreme-UV emission associated with the X-ray emitting plasma as it cools, could have an important effect on this circumstellar material, perhaps being the dominant source of excitation for the PAH and H2 emission. Thus, characterizing the X-ray properties of the star is important for understanding the physical conditions in the circumstellar environment.
In Figure 8 we show the MEG and HEG spectra (negative and positive first orders co-added in both cases), with emission lines identified and labeled. Although the Chandra gratings and detector have significant response to wavelengths above 30 Å, interstellar attenuation (due to photoelectric absorption, which has a cross section that goes roughly as ) makes the spectra above 12 Å nearly devoid of counts. These spectra are dominated by a strong bremsstrahlung continuum, which is indicative of plasma with a dominant temperature well in excess of 20 million K (so that atoms are mostly fully stripped and their associated line emission is weak). The presence of emission from high ion stages—up to helium-like Fe xxv and hydrogen-like Fe xxvi—also indicates very high plasma temperatures. We analyze the temperature distribution in the plasma in detail below by fitting thermal emission models to the entire spectrum.

3.1 Spectral Modeling
We fit the MEG and HEG first order dispersed spectra simultaneously (but not co-added) over the spectral ranges where each has a significant number of counts. For the MEG this was 2–12.5 Å, and for the HEG it was 1.5–11.5 Å. We fit a two-temperature optically thin thermal emission model (the bapec implementation of the Astrophysical Plasma Emission Code apec, Smith et al. 2001) that accounts for bremsstrahlung and line emission from a plasma in statistical equilibrium. This model has four free parameters: the plasma temperature, the abundances (expressed as a fraction of solar), the emission measure (, proportional to the normalization of the model), and the line broadening, which is an ad hoc turbulent velocity added in quadrature to the thermal velocity of each line in the model. We also include interstellar attenuation, with cross sections from Morrison & McCammon (1983). We used the statistic with Churazov weighting (Churazov et al., 1996) to assess goodness of fit and to place confidence limits on the derived model parameters.
A single temperature model does not provide a good fit, though the low resolution ASCA and Chandra ACIS data are adequately fit by a single temperature thermal model (Imanashi et al., 2002). We did find a good fit when we used a two temperature bapec model with interstellar absorption. The best-fit model has temperatures of roughly 12 and 48 million K (MK), with approximately five times the emission measure in the hotter component as in the cooler component. The abundances are sub-solar, and no significant line broadening is found, with a 68% confidence limit of km s-1, about one-third of the peak spectral resolution. We find an interstellar column density of slightly more than cm-2, which is completely consistent with the extinction of magnitudes, given the conversion between extinction and hydrogen column density of Vuong et al. (2003). The model has a flux of ergs s-1 cm-2 on the range 0.3–10 keV. Correcting for interstellar attenuation, the unabsorbed X-ray flux is a little more than twice this, corresponding to an X-ray luminosity of ergs s-1. The best-fit model parameters and their 68% confidence limits are listed in the first row of Table 2. This fit is formally good, although the two temperatures certainly are an approximation to a continuous distribution of temperatures. Furthermore, the confidence limits are based only on statistical errors on the data, and in our experience, for datasets with many bins (the data we fit here have 12,196 bins), formal confidence limits are unrealistically tight.
| Abundance | |||||||
|---|---|---|---|---|---|---|---|
| (keV) | ( cm-3) | (keV) | ( cm-3) | (Solar unitsaaSolar abundances from Anders & Grevesse (1989).) | ( cm-2) | erg s-1 | |
| total | 5.44 | ||||||
| pre-flare | 3.49 | ||||||
| flare | 9.36 | ||||||
| post-flare | 6.78 |
To test the robustness of this fit, we refit the data using the isis X-ray analysis package (ver. 1.4.9-38; Houck & Denicola, 2000). We used the apec model with interstellar absorption, and, as we did with the fits in xspec, found that a two temperature model was required to achieve a good fit. The temperatures of the best-fit components were both higher by about 20%, and the emission measure weighting was even more skewed toward the hot component in this isis fit compared to the xspec fit. The interstellar column density was about 10% lower than in the xspec fit. There were some differences in the method used for the fitting in isis, including the use of the C statistic (Cash, 1979) and a somewhat different wavelength range (1.8–18 Å for both the MEG and HEG data). Perhaps these 10–20% discrepancies between the results from the two model fitting programs are a more realistic representation of the parameter uncertainties than are the formal, statistical confidence limits. We will use the apec model fitting in xspec as the standard throughout the rest of the paper.
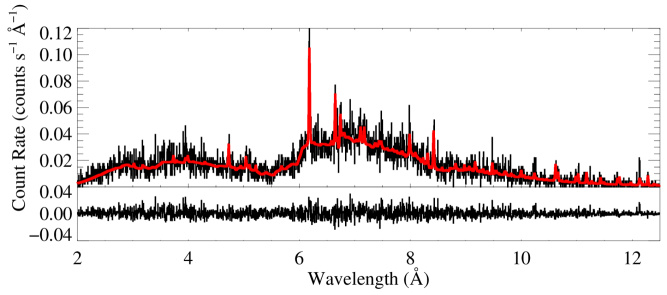
The best-fit model to the full observation, with parameters listed in the top row of Table 2, reproduces all portions of the spectrum quite well, with few systematic deviations. The best-fit model is shown in Figure 9 along with the higher signal-to-noise MEG data. In general, the continuum is well fit and the lines are adequately reproduced by this model. The same is true for the HEG data.
3.2 Time Variability and Spectral Analysis of the Pre-flare, Flare, and Post-flare Data
A large (factor of three) flare was seen in the middle of the Chandra observation, with a rapid rise of about six thousand seconds, followed by a steady decay during which the count rate drops by less than a factor of two in about 18 ks. After this, the count rate remains steady, but at a level that is nearly twice the quiescent, pre-flare level. The temporal behavior is shown in Figure 10, where we also display light curves for the hard and soft bands separately. Significant hardening is seen during the flare, which dissipates through the flare and post-flare phase but never returns to the pre-flare level.


Above we have presented fits to the total spectrum collected during the 94 ks observation. We next repeat the two-temperature thermal fitting on the pre-flare (0 through 48 ks), flare (54 to 70 ks), and post-flare (70 to 94 ks) spectra separately. The results are reported in Table 2, and the temporal divisions are indicated by the vertical lines in the first panel of Figure 10. The temperatures and emission measures roughly double during the flare portion of the observation, with somewhat larger relative changes in the hotter component of the two-temperature model. The flare plasma temperature is in excess of 90 MK. The post-flare plasma also has a temperature distribution that is elevated with respect to the pre-flare plasma, indicating that some reheating is occurring. The absorption column densities derived for each section of the observation are completely consistent with each other, which is consistent with an interstellar origin to the attenuation, as we would expect. We also note that the abundances show a marginally significant change among the three different sections of the observation, in the sense that the hotter sections—the flare and to a lesser extent the post-flare section—have higher abundances. Although this result may represent a real change in the coronal plasma abundances during the flare, it may also be affected by the simplified two-temperature assumption in the model. The abundance parameter in the emission model is largely controlled by the line-to-continuum ratio, and the strength of the metal emission lines relative to the bremsstrahlung continuum is also affected by details of the emission measure distribution at high temperatures, where metals are generally fully ionized and contribute little overall line emission.
Another demonstration of the spectral changes associated with the flare is provided by the iron K-shell line emission, which is sensitive to the hottest plasma. The He-like Fe xxv line complex near 1.86 Å has an emissivity that peaks near 60 MK, while the H-like Fe xxvi line at 1.75 Å has an emissivity that peaks at temperatures somewhat above 100 MK. There is very little emission in the He-like feature and none detected in the H-like feature during the pre-flare section of the observation. But the iron lines get significantly brighter during the flare and maintain significant emission levels during the post-flare phase as well. Not only do the iron features increase in overall intensity during the flare, but the relative strength of the H-like feature compared to the He-like feature also evolves in the sense expected from the temperature changes seen in the apec model fitting to the entire spectrum.
3.3 Density-Sensitive Emission Line Ratios
The emission lines in the spectrum are relatively weak, but we are able to analyze the strengths of two important helium-like line complexes and use them as plasma diagnostics. Specifically, the forbidden-to-intercombination line ratios of helium-like ions are sensitive to density, as collisions de-populate the metastable upper level 3S of the forbidden line and populate the upper level 3P of the intercombination line (Gabriel & Jordan, 1969). Thus higher densities decrease the forbidden-to-intercombination () ratio (with different critical densities for each element). This evidence for high densities is seen in some accreting T Tauri stars, but not in naked T Tauri or magnetically active main-sequence stars (Kastner et al., 2002; Telleschi et al., 2007, and references therein).
We measured the line intensities by first fitting the continuum near each line complex, and once the continuum level was established, fitting the line complex itself with a three-Gaussian profile model on top of the best-fit continuum level. The adjustable parameters of the three-Gaussian model are an overall normalization and the ratios and , where represents the flux in the resonance line. The ratios for Si xiii and S xv are and , respectively. None of the lower atomic number elements have enough signal-to-noise in their helium-like emission complexes for a measurement to be made.
For the Si xiii complex, the forbidden line is blended with the Lyman- line of Mg xii. Based on the measured Lyman- flux of Mg xii and the relative emissivities of the two components of the Lyman series in the apec model, we can attribute up to 20% of the measured flux in this feature to the Mg line. This makes the ratio . The models predict –2.5, with the largest line-ratio values (the “low-density limit”) expected for all electron densities less than or equal to a certain limiting value.555The low-density limit refers to the limiting (high) value of the ratio that holds when the density is low enough that collisional excitation out of the metastable excited state of the forbidden line is unimportant compared to spontaneous emission to the ground state. We give a range of values for the low-density limit for each element. These represent the range of values found from PrismSpect (MacFarlane et al., 2004) calculations, from Blumenthal et al. (1972), and from Porquet & Dubau (2000). If the actual electron density were much above the low-density limit, then the forbidden line would be weakened and the ratio would be reduced. The 68% lower confidence limit on the ratio from our data is 2.1, which limits the density to less than 4– cm-3, depending on the model of that is employed. The MEG and HEG measurements of the line complex and the theoretical models from which we derive the upper limit on the density are shown in Figure 11.


For S xv the forbidden-to-intercombination ratio we measure is consistent with the low-density limit for that complex of to 2.1. The 68% lower confidence bound on for S xv corresponds to a density of cm-3 (which represents an upper limit to the density). That the helium-like complexes on DoAr 21 have strong forbidden lines, consistent with being in the low-density limit, is in marked contrast to altered ratios in accreting classical T Tauri stars (CTTS). However, the altered ratios in CTTS are generally seen in lower Z elements’ He-like complexes, such as Ne ix and O vii, which have lower critical densities than Si xiii. The lower Z features seen in those CTTS, which are at longer wavelengths, are not visible in the Chandra spectrum of DoAr 21 because of the large amount of interstellar attenuation. Nonetheless, the available density diagnostics for the X-ray emitting plasma of DoAr 21 are completely consistent with those seen for active, non-accreting coronal sources such as weak-lined T Tauri (WTTS) and ZAMS stars. Specifically, the upper limit we find for from the Si xiii complex is slightly lower than the densities in the accreting T Tauri star TW Hya, where is found from the Ne ix complex (Kastner et al., 2002), and our upper limit is also consistent with values orders of magnitude lower than that, typical of coronal emission seen in RS CVn stars.
4 Discussion
Our X-ray observations show DoAr 21 to be a very active, hard, coronal source, with a large X-ray luminosity and flare rate. At the same time, our new infrared observations of DoAr 21 show the presence of extended, irregularly distributed circumstellar material. In light of this combination, we now consider the relationship between DoAr 21’s radiation and its circumstellar environment, and what it can tell us about DoAr 21’s evolutionary state and more generally about disk evolution around young stars.
Much of what we can learn from these data rests on where exactly the circumstellar material is located, and how it is related to DoAr 21. Is it the remnant of a disk that is in the final stages of being cleared out? Or is it nearby but not necessarily gravitationally-bound material that is illuminated by DoAr 21 as it emerges from or passes through the cloud?
We divide the discussion into two major parts. First, we consider the emission mechanism and energetics of the observed infrared emission (including the H2 and PAH emission) from the circumstellar material; as a corollary to this we evaluate further literature data bearing on DoAr 21’s level of stellar activity, and we use it to estimate the far-ultraviolet (FUV) radiation field. We then discuss possible origins for this circumstellar material, focusing in particular on whether or not it is a disk, i.e. gravitationally bound, centrifugally supported material.
4.1 Energetics and excitation of the circumstellar material
The most surprising result from the new observations presented here is the large spatial extent of the mid-infrared emission from DoAr 21, which is puzzling to find around a cool star, and one with a very low millimeter flux. What this discovery has in common with the previous surprises about DoAr 21—the detections of PAH and H2 emission—is that all of these observations are more commonly associated with more luminous, hotter stars. Here we explore whether it is possible to construct a model that explains all of the data, and we focus in particular on trying to understand the influence of the UV and X-ray emission from DoAr 21 on its circumstellar material. Because FUV radiation is important for radiative excitation of both H2 and PAH emission, we first discuss the FUV radiation field near DoAr 21.
4.1.1 The FUV radiation field near DoAr 21
The ultraviolet flux from DoAr 21 is poorly known. It was not detected by IUE (Valenti et al., 2003); examination of the archived IUE spectrum places a rough upper limit of erg cm-2 s-1 at –3200 Å. Given the large extinction to DoAr 21 (roughly 13 magnitudes at given our adopted visual extinction), however, the star could have an ultraviolet flux that is several orders of magnitude above its photospheric flux and it would not have been detected by IUE. Given this situation, we take two approaches to estimating the level of UV radiation in the vicinity of DoAr 21. First we consider the UV background in the region due to the nearby B2 star HD 147889. Then we use the available data on DoAr 21’s chromospheric and coronal activity to estimate the UV emission from its transition region.
The B2 V star HD 147889, at a projected distance of 0.4 pc from DoAr 21, is responsible for exciting PAH and H2 emission from much of the surrounding nebulosity (Habart et al., 2003). To determine the UV flux from HD 147889 arriving at the position of DoAr 21 and its surroundings, we integrated the flux from a synthetic spectrum based on a spherical, hydrostatic, class (ii) NLTE model atmosphere from Aufdenberg et al. (1999) with K and , assuming for HD 147889 and a distance of 0.4 pc between the two stars (Liseau et al., 1999). At this distance, the ultraviolet flux reaching DoAr 21 from HD 147889 (assuming no attenuation) is roughly 0.75 erg cm-2 s-1 in the bandpass 6.0–13.6 eV (–2066 Å). This corresponds to , where is the flux in this wavelength interval expressed in units of a mean interstellar radiation field of erg cm-2 s-1 (Habing, 1968)666This is the same quantity referred to as by Nomura & Millar (2005) and similar to the quantity used by Habart et al. (2003). In contrast, the FUV field from DoAr 21’s photosphere (estimated using a Kurucz model atmosphere and the stellar parameters given above) is at a distance of 10 AU from the star and falls with distance from DoAr 21. As noted above, however, given the high level of activity from DoAr 21, there is likely to be significant UV emission from the transition region.
To estimate the FUV flux from DoAr 21, we use as a template HD 283572 (V987 Tau), a weak-lined T Tauri star with a similar mass, effective temperature, and X-ray properties. HD 283572 is a single G5 star in the Taurus-Auriga star-forming region, and it has an X-ray luminosity of erg s-1 in the 0.3–10 keV band (Telleschi et al., 2007, scaled to the 129 pc distance measured from VLBA parallax by Torres et al. 2007). DoAr 21’s luminosity in this energy band is – erg s-1 (Table 2), taking the range from pre-flare to peak flare values. HD 283572 is near DoAr 21 on the HR diagram, although with a slightly hotter photospheric temperature and older inferred age; it is the second blue square from the left in Figure 1. It has no evidence for circumstellar dust (Furlan et al., 2006; Kundurthy et al., 2006) or H2 (Bary et al., 2003). It shows a hard, flaring X-ray spectrum (Favata, Micela, & Sciortino, 1998); fitting of the spectrum yields a temperature distribution similar to what we find for DoAr 21 (Telleschi et al., 2007). Like DoAr 21, it shows strong radio emission (Phillips, Lonsdale, & Feigelson, 1991).
These similarities make HD 283572 a good template to compare with DoAr 21, along with the crucial difference: it has a relatively low mag (Furlan et al., 2006). Thus, the FUV emission is not attenuated nearly as much as for DoAr 21, and the star was clearly detected by IUE. We integrated the de-reddened FUV flux in the co-added HD 283572 IUE spectrum (Valenti, Johns-Krull, & Linsky, 2000) in the range –2066 Å. The Ly line is clearly contaminated by geocoronal emission, and in any case would be strongly absorbed by interstellar H I; we rejected the flux from –1232 Å. Since the –1150 Å flux was not observed by IUE, we used the results of Alexander, Clarke, & Pringle (2005), who calculated UV spectra using detailed differential emission measure distributions from Brooks et al. (2001) for several T Tauri stars and found that the –1150 Å flux was roughly 1/6 of the –2000 Å flux. Thus, we scaled the de-reddened IUE 1150–2066 Å flux by 1.2 to estimate the flux in the full 912–2066 Å interval. We used the measured distances of HD 283572 and DoAr 21 (both with high-quality VLBA parallaxes) to determine the scaling between flux and luminosity for both stars. Finally, we scaled the HD 283572 FUV luminosity by the two stars’ relative values to estimate the DoAr 21 FUV luminosity, assuming that the FUV luminosity would be directly proportional to the X-ray luminosity.
Based on this analysis, we find – erg s-1. However, this analysis does not account for flux in the Ly line, which can be very strong in stars with active chromospheres. We estimated the Ly flux using the scaling relations between Ly and X-ray surface flux derived by Wood et al. (2005), who measured Ly from a sample of nearby late-type stars at high spectral resolution with STIS on HST, and thus were able to remove geocoronal emission and correct for interstellar absorption. The range of X-ray fluxes from DoAr 21 gives a range of Ly surface fluxes of 0.8– erg cm-2 s-1, and thus a total – erg s-1. We caution, however, that there is only one star (Speedy Mic) in the Wood et al. (2005) sample with an X-ray surface flux as large as that from DoAr 21, and so the scaling relations are not well-constrained in this regime.
Under these assumptions, we estimate that the value produced by DoAr 21’s FUV flux is in the range of 470–1100 at 11 (134 AU) from the star, the distance of the bright ridge in our images. Thus, the estimated FUV flux from the star is equal to or somewhat greater than the external FUV flux at this distance. The total FUV flux (from the combination of DoAr 21’s transition region and the B2 star background) at the position of the bright ridge is then –1600; the internal and external FUV fluxes become equal at 130–210 AU from DoAr 21. If there is any attenuation of the external FUV flux in the pc between HD 147889 and DoAr 21, then DoAr 21’s contribution to the total flux is even more dominant.
Having estimated the FUV flux near DoAr 21, we can now examine the effect this flux would have on nearby material. In the sections below, we will examine in turn the continuum (dust) emission, the PAH emission, and the H2 emission. Consistent with the FUV flux estimates above, we will show that the emission shows signatures of being excited from the inside out, i.e. by DoAr 21 rather than externally by HD 147889. Before turning to a discussion of the details of each type of emission, we close this section with a simple check of the energy balance in the circumstellar environment. We measured the flux from the circumstellar material by taking the fluxes in the largest aperture listed in Table 1 and subtracting the fluxes in the smallest aperture to remove the stellar contribution. Integrating from 10 µm to 20 µm, we find the luminosity of this material to be roughly erg s-1, the same order of magnitude as our estimate of . Given the uncertainties in our flux estimate and the complexities of the various heating, cooling, and emission processes in the environment we do not suggest that there should be precise agreement here, but the order-of-magnitude agreement does indicate that DoAr 21 is a plausible source for powering the observed emission, which we now examine in more detail.
4.1.2 Dust emission
In order to study the continuum emission excess from DoAr 21, which we here assume arises from thermal emission from dust grains, we need wavelength regions without significant spectral features. The spectrum taken by Hanner et al. (1995) shows that the region encompassed by the 10.4 µm filter from our Gemini observations is free of emission or absorption features; in particular, there is no evidence of a silicate feature. While we do not have a corresponding spectrum in the 18.3 µm region, this part of the spectrum generally has not shown significant features in Spitzer IRS spectra of other young stars (Geers et al., 2006). Some galaxies and star-forming regions with PAH emission do show features at 17.8 µm and 18.9 µm, albeit on top of a significant continuum (Sellgren, Uchida, & Werner, 2007). We take this spectral region to sample primarily continuum emission; if there is a contribution from some PAH emission in this bandpass, the effect would be to raise the dust temperatures derived below.
Using our Gemini images, we integrated the flux in these two bandpasses in a region that is off the stellar position and thus probes only circumstellar flux. This yielded fluxes of 197 and 603 mJy at 10.4 and 18.3 µm, respectively. A single-temperature blackbody fit to these two fluxes yields a temperature estimate of roughly 215 K for the emitting material. While this estimate is obviously an oversimplification of the actual situation, the general result of a steeply-rising flux from 10–18 µm is robust, indicating that the emitting material has a temperature in the hundreds of degrees K. For comparison, blackbody grains that have reached thermal equilibrium with the star’s radiation field, given DoAr 21’s luminosity of 11.7 , would have a temperature of 44 K at 135 AU (11) from the star and 31 K at 270 AU from the star. At these temperatures, the 18.3 µm to 10.4 µm flux ratio would be 105–107, rather than the observed value of .
While the derived dust temperature is far out of equilibrium, it is quite consistent with the expected behavior for very small grains (VSGs) excited by UV photons (Puget & Leger, 1989). Grains with radii of a few nm can be transiently heated to temperatures of several hundred K by single UV photons, and an ensemble of such grains can contribute significant infrared emission. Given that such small grains may form a continuum of sizes with PAH molecules (Tielens, 2008), it is perhaps not surprising to find them around DoAr 21. Nevertheless, it provides additional evidence for the importance of the FUV radiation in exciting the circumstellar material, and it is another respect in which DoAr 21’s environment is different from a typical circumstellar disk.
4.1.3 PAH emission
We have presented our new images in the 8.6 and 11.3 µm PAH filters above; here we briefly recap existing published and archival PAH data for DoAr 21.
Figure 6 shows the mid-infrared spectrum of DoAr 21 from Hanner et al. (1995) along with the model photosphere. The data show a clear emission feature at µm, attributed by Hanner et al. (1995) to emission from PAHs. The data also show a rising slope shortward from µm to where the spectrum ends at 7.9 µm, consistent with the presence of a 7.7 µm PAH emission feature.
DoAr 21 was also observed by ISO with the circularly-variable filter (CVF) on ISOCAM, yielding a –80 spectrum from 5.1–16.6 µm of DoAr 21 and its surroundings with 6″ pixels. These data were reprocessed by Boulanger et al. (2005) as part of the final reprocessing of all ISOCAM CVF data, and we retrieved the reprocessed data from the ISO archive. The data show a strong point source at the position of DoAr 21, as well as a bright ridge of emission located 30″–90″ NE of DoAr 21 and running NW–SE; this ridge is clearly visible in the Spitzer 24-µm image (Fig. 3; see also Fig. 3 of Padgett et al. 2008 for a larger view) and can also be seen faintly in the 2MASS K-band images. All pixels in the ISOCAM 33 x 33 field of view show a rich PAH spectrum, including emission features at 6.2, 7.7, 8.6, 11.3, and 12.7 µm.
Unfortunately, it is not possible to determine a reliable spectrum for DoAr 21 itself from these data. Due to internal reflections in ISOCAM when used with the CVF, the spectrum of DoAr 21 is contaminated by “ghosts”, reflections of stray light from elsewhere in the field of view (Okumura et al., 1998). This is revealed by sharp discontinuities in the spectrum around 9 µm, the transition wavelength between CVF1 and CVF2. The ghosts are significantly worse in CVF2, and this discontinuity (which is clearly present in a spectrum extracted at the position of DoAr 21) is a signature of stray light contamination (Boulanger et al., 2005). We suspect that the contamination arises from the bright ridge of emission to the NE of DoAr 21, which is of the same order of magnitude in brightness at these wavelengths as DoAr 21 itself. Because the background emission is diffuse and spatially variable, and the ghost size and strength are functions of wavelength, it is not possible to reconstruct the uncontaminated spectrum of DoAr 21 from these data.
One of the most striking features of our new PAH-filter images of DoAr 21 is the spatial variation of the 11.3 µm emission, with similar variations seen at 18.3 µm. The emission does not decrease smoothly with distance in the region near the star, but rather it is significantly brighter in a knot and partial arc beginning roughly 11 to the north and west of the star. In contrast, the 8.6 µm emission is much smoother, with about the same brightness in the region near the star as in the region that appears as a bright arc in the 11.3 µm image. Thus, it appears that the [8.6]/[11.3] ratio may be higher near the star. However, the 8.6 µm emission is much fainter overall than the 11.3 µm emission, and the star is brighter, so it may be that any variation in the fainter 8.6 and 10.4 µm emission blends in with the wings of the stellar PSF.
If the apparent change in the [8.6]/[11.3] ratio is real, it is a useful diagnostic of the ionization state of PAH molecules; in laboratory spectra of PAH molecules, the 11.3 µm CH out-of-plane bending mode weakens considerably in ionized PAHs while the 8.6 µm CH in-plane bending mode strengthens somewhat (Allamandola, Hudgins, & Sandford, 1999). In astrophysical sources, a decrease in the [8.6]/[11.3] ratio with distance from a central ionizing source has been observed in NGC 1333 (Joblin et al., 1996) and in the Orion Bar (Galliano et al., 2008).
Applying this interpretation to DoAr 21 leads to the conclusion that a significant fraction of the PAH molecules within about 1″ of the star are ionized, suppressing the [8.6]/[11.3] ratio in this region. This would indicate that DoAr 21, not HD 147889, is the dominant source of FUV flux in its circumstellar environment, consistent with our estimates above of the relative FUV fluxes (Sec. 4.1.1). The first ionization potential for typical PAH molecules is 6–8 eV (Weingartner & Draine, 2001b), and thus there must be significant flux at energies eV near the star.
As noted above, it may be that the radial variation seen in the bright 11.3 µm emission is simply difficult to detect in the fainter 8.6 µm emission due to the low surface brightness. One piece of evidence in favor of this interpretation comes from comparison of the different continuum wavelength bands. Since both the 10.4 and 18.3 µm bands are dominated by continuum emission from very small grains, they should show the same spatial variation. However, the bright 18.3 µm emission shows the same radial variation as the bright 11.3 µm emission, while the fainter 10.4 µm emission apparently does not, which might suggest that it is not seen simply due to low surface brightness, and that a similar effect might be present at 8.6 µm. If it is the case that the same radial variation is present in all bands, then it would represent a real change in surface density of material, with less material present near DoAr 21, perhaps due to photoevaporation. In either case, the azimuthal distribution of material around DoAr 21 is clearly asymmetric (Fig. 5).
While there is a sharp increase in the 11.3 µm emission at roughly 11 from the star, the brightness of this emission declines with radial distance beyond that point. The decline is roughly consistent with a falloff proportional , which is what would be expected from a uniform PAH and small grain surface density with declining excitation due to geometric dilution of the exciting radiation. Thus, the true extent of the circumstellar material may be much greater than that shown in our images, as already suggested by the HST and near-infrared images (Sec. 2.3.2).
4.1.4 H2 emission
While we did not make any observations of H2 emission, the analysis of the VSG and PAH emission in the preceding sections bears directly on the interpretation of previous H2 observations, which we discuss here. Given the surprisingly large spatial extent of the emission seen in our images, we pay particular attention to what constraints existing data put on the spatial distribution of the H2 emission.
As noted above, Bary et al. (2002, 2003) detected emission in the H2 1–0 S(1) line at µm from DoAr 21. Their slit width was 08 and the seeing was approximately 14 (Bary et al., 2002). In their nod-differenced images, they found no evidence of any extension of the emission along the E-W slit beyond the 14 seeing disk. From the resolved velocity width of the line, they also argued that the gas must reside in a rotating circumstellar disk.
Bitner et al. (2008) observed DoAr 21 in the 0–0 S(2) pure rotational transition of H2 at µm. They detected emission in one observation using a 14 N-S slit with 14 seeing on the IRTF, but they did not detect it in a subsequent observation with a 054 E-W slit with 05 seeing on Gemini.777FWHM seeing profiles and slit orientations are from M. Bitner, personal communication. The stated slit orientations are the direction of the long dimension of the slit, i.e. the direction in which any extended emission would be detected.
The Bitner et al. (2008) observations suggest that the S(2) H2 emission is not uniformly distributed around the star and/or is time-variable. If we attribute the difference between the two observations solely to the spatial distribution of material, the data imply that the emitting gas lies primarily at an angular separation greater than 025 (30 AU), and that it may be more concentrated to the N and/or S of the star. Bitner et al. (2008) detected larger fluxes with the wider IRTF slit than with the narrower Gemini slit for four out of the five sources observed with both telescopes, suggesting that spatially-extended emission for the pure rotational transitions is not uncommon. We note, however, that a slit at any orientation will intercept flux from a disk at all disk radii (though not all azimuths), so azimuthally-symmetric emission from gas in a disk, even at large radii, should contribute some flux even in the Gemini slit. We discuss this point further in Sec. 4.2, where we propose a possible geometry for the emitting material that is consistent with all the data.
The suggestion that the H2 S(2) emission may lie preferentially to the N or S, combined with the emission geometry seen in our PAH images, suggests that the H2 and PAH emission could be coincident, and other observations suggest that this is not an uncommon occurrence. This is perhaps unsurprising, given that both molecules are excited by UV photons. In the Orion Bar PDR, the H2 1–0 S(1) emission and 3.3 µm PAH emission are similarly distributed along the edge of the bar facing the ionizing O stars.888While to our knowledge there is not a similar map of the 11.3 µm line in the Orion Bar, the 3.3 µm PAH line is strongest in neutral PAHs and in general is strongly correlated with the 11.3 µm line (Hony et al., 2001). Closer to DoAr 21, Gómez et al. (2003) and Habart et al. (2003) conducted ground-based narrow-band imaging, showing that the SW edge of the bright bar lying NE of DoAr 21 (seen in both the Spitzer and ISO images) is also bright in the H2 1–0 S(1) line. Further, Habart et al. (2003) show that the PAH emission seen by ISOCAM at –8.5 µm in this region correlates very well in strength and position (albeit with modest spatial resolution) with the H2 1–0 S(1) emission seen in the ground-based images, and with the H2 0–0 S(3) emission seen by the ISO SWS.
An alternate interpretation of the Bitner et al. (2008) observations is that the emission is time-variable and was below the detection threshold at the time of the Gemini observation. The upper limit in the Gemini observation is erg cm-2 s-1, a factor of 2.6 below the flux level of the IRTF detection.999This limit is determined using the line width of 5.6 km s-1 measured in the IRTF observations (M. Bitner, personal communication), and thus it is slightly lower than the limit given in Bitner et al. (2008) based on an assumed line width of 10 km s-1. The X-ray flux level from DoAr 21 is seen to vary by a factor of three on short timescales (Fig. 10); if this translates into a corresponding variation in the FUV exciting the H2 emission, then that emission could vary by similar factors. However, if we attribute the difference between the two observations solely to variability, this hypothesis would require that the Bitner et al. (2008) detection happened to coincide with the peak of a flare, and that the H2 flux in the Gemini observation is just below the detection threshold. DoAr 21 has a relatively high X-ray flare rate of about one per day (Imanashi et al., 2002), but the fraction of time the X-ray flux is more than a factor of 2.6 above the quiescent level is small, probably less than an hour per day based on available data.
4.1.5 Photometric and Polarimetric Variability
Multiple measurements exist at wavelengths from 0.39 µm () through 4.8 µm (). Variability is seen at all wavelengths. The range at band in 15 measurements is 0.33 magnitudes, with variations on timescales of less than one day, but with no apparent periodicity (Bouvier et al., 1988). Substantial variability is seen in the ultraviolet; in two observations separated by less than an hour, Bouvier et al. (1988) observed a brightening of 0.97 magnitudes in , while brightened by 0.03 magnitudes and faded by 0.02 magnitudes. Two observations separated by 3 hours on the following night showed a similar variation, with brightening by 0.42 magnitudes while and faded by 0.04 and 0.05 magnitudes, respectively.101010Bouvier et al. (1988) do not give error bars on individual measurements. They quote typical errors of 0.09, 0.06, and 0.04 mags for , , and for a star; DoAr 21 is . Observations of other stars with similar magnitudes observed during the same nights as the flares on DoAr 21 do not show magnitudes that are substantially different from the mean values for those stars, suggesting that the observed changes at in DoAr 21 are real, and not photometric errors. Such a large increase in the UV emission without a concurrent increase in cannot be due to rotational modulation (either of hot or cool spots), since that would increase the flux in all bands (e.g., Rydgren & Vrba, 1983). These -band brightenings are similar to flares seen on active main-sequence stars in that they are much brighter at than at (Fernández et al., 2004). We note that both of these brightening events occur when the star is at the faint end of the observed range, i.e. they are brightenings toward the mean value rather than above it. This may simply indicate that the star is flaring much of the time and that the observed mean value in the data of Bouvier et al. (1988) is characteristic of the flares rather than the photosphere; this is consistent with the fit to the SED (Fig. 2). The and magnitudes are positively correlated with each other (with a larger amplitude at ), but neither the or magnitudes nor the color is correlated with .
The bluest observed color for DoAr 21 in the photometry of Bouvier et al. (1988) is , observed on two consecutive nights. Using our adopted extinction, the de-reddened color is . Interestingly, the only other stars in the Bouvier et al. (1988) sample that show excursions to such blue values are classical T Tauri stars, though the availability of well-sampled time series and photometry for some of the most active WTTS (e.g., HD 283572) is limited. On DoAr 21, where we see no evidence of accretion, the -band excess probably signals Balmer-line and continuum emission resulting from extreme chromospheric activity and flaring, as seen on late-type flare stars (e.g., Lacy, Moffett, & Evans, 1976). Flares from such stars have a mean of (Moffett, 1974), consistent with the bluest color seen from DoAr 21.
DoAr 21’s -band emission is polarized at % (Martin et al., 1992). The large visual extinction toward DoAr 21 suggests that this could be attributed to interstellar polarization from overlying cloud material not closely associated with the star. However, the polarization is variable both in amplitude and in position angle (Jensen et al., 2004). Since a cloud far in the foreground would not be expected to change on short timescales, this variability suggests a circumstellar origin for DoAr 21’s polarization; this is also quite consistent with the observed asymmetry of the circumstellar material, as scattering off an asymmetric distribution will give a net polarization in the unresolved light. Given the discovery reported here that the circumstellar material around DoAr 21 is quite extended (Sec. 2.3.2), the observed variation in polarization percentage could be due to measuring with different aperture sizes that include different amounts of the extended emission: the percentage polarization measured by Jensen et al. (2004) in a 43-diameter aperture is smaller than that measured by Martin et al. (1992) in a 78 aperture.
4.2 A Disk or Not?
What is strikingly clear from the observations presented above is that the high-energy emission from DoAr 21 has strong interactions with material in its circumstellar environment, even on scales of hundreds of AU. What is less clear, however, is the relationship of the observed material to DoAr 21, and specifically to what extent the extended emission is related to any orbiting, bound circumstellar (or circumbinary) disk that DoAr 21 has or once had.
The definitive answer to this will await further, higher-resolution observations, in particular spatially- and velocity-resolved mapping of the H2 emission. Here, we close the discussion with an examination of evidence for and against a Keplerian disk around DoAr 21.
One of the primary arguments that Bary et al. (2002) made for the H2 emission arising from a disk is that extended, non-disk material would have a narrower line width than the 9 km s-1 FWHM width they observed for DoAr 21’s 1–0 S(1) emission. While we examine this line width more quantitatively below, we first note that DoAr 21 has the narrowest H2 line of any of the detections of H2 from T Tauri stars and Herbig Ae/Be stars at both 1–0 S(1) (Bary et al., 2003; Itoh et al., 2003; Takami et al., 2004; Ramsay Howat & Greaves, 2007; Bary et al., 2008; Beck et al., 2008) and 0–0 S(2) (Bitner et al., 2008).
To interpret the line width, we must take into account the fact that the observed line width is the convolution of the intrinsic line width with the instrumental profile. The Bary et al. (2002) observations had a FWHM spectral resolution of 5 km s-1. Assuming Gaussian profiles for both the spectral response of the instrument and the observed line, the intrinsic line width is then 7.5 km s-1. If interpreted solely as a thermal line width, this would imply a kinetic temperature of 2450 K. Bary et al. (2002) do not quote an uncertainty for the measured line width; assuming a 1 km s-1 total uncertainty for the deconvolved line width (reflecting some uncertainty in both the measured line width and the spectral resolution), the range of derived kinetic temperatures is then 1700–3300 K. The lower end of this temperature range is quite consistent with temperatures generally found for 1–0 S(1) emitting gas. For example, Bary et al. (2008) quote a standard thermal excitation temperature of 2000 K. Beck et al. (2008) observed extended H2 around several T Tauri stars, and from the ratios of several lines they derive LTE temperatures of 1800–2300 K for H2 around T Tauri stars. Herczeg et al. (2004) model the fluorescent H2 emission from TW Hya’s disk and find kinetic temperatures of K for the H2. While the gas in some of those sources may be shock-heated, which is unlikely for DoAr 21, these observations show that H2 can survive and emit strongly at the temperatures necessary to explain the observed line width in DoAr 21. Similarly, the models of Nomura & Millar (2005) and Nomura et al. (2007) predict that the bulk of the H2 1–0 S(1) emission from disks irradiated by X-rays and UV comes from gas with temperatures of 1000–2000 K, and similar results are found in models of PDRs (Allers et al., 2005). Collisional dissociation of H2 at these temperatures is insignificant (Martin, Schwarz, & Mandy, 1996). Thus, the H2 temperature necessary to explain DoAr 21’s observed line width solely with thermal broadening is consistent both with theoretical expectations and with observations of other sources.
Theoretical models show that it is plausible that DoAr 21 can heat gas to these temperatures at large distances from the star. The FUV flux that we estimate for DoAr 21 combined with HD 147889 (Sec. 4.1.1) corresponds to –1600 at a distance of 130 AU (11) from DoAr 21, the location of the bright PAH emission ridge. This is similar to the FUV flux in the Nomura & Millar (2005) models at radii of –100 AU, and thus we might expect conditions at 130 AU from DoAr 21 to be similar to those at 40–100 AU in the models. This range of radii extends beyond the AU distance at which the H2 1–0 S(1) emission peaks in those models, but it is also the case that DoAr 21 has an X-ray luminosity that is 50 times larger and an X-ray spectrum that is much harder than that assumed in these models (which base their assumed X-ray emission on that of TW Hya), thus contributing an additional source of heating. Thus, while the models do not apply directly to DoAr 21, plausible scaling from them suggests that H2 at AU from DoAr 21 could have K, necessary to produce the observed line width with thermal motions, and could emit at the observed level, since the predicted H2 flux in both the 1–0 S(1) and pure rotational lines in these models is similar to that observed for DoAr 21.
To summarize this part of the discussion, the primary argument of Bary et al. (2002) for the presence of a disk around DoAr 21 is essentially that the only way to produce the observed H2 1–0 S(1) line width is from rotation in a disk. However, we have shown that the observed width is a plausible thermal line width for H2 illuminated with a strong FUV and X-ray flux, and that the flux from DoAr 21 is sufficient to produce the necessary heating at distances of AU from the star, consistent with the position of the observed PAH and VSG emission. While the match between this expected thermal broadening and the observed line width does not rule out the gas also having some bulk motion, for example from rotation in a disk, it does show that rotation is not required to explain the data. Indeed, the observed line width sets some significant limits on the of the gas. The expected Keplerian velocity of gas orbiting a 2.2 star at 130 AU is 3.8 km s-1. Given the uncertainties in the range of possible temperatures for the emitting gas, such an orbital velocity is likely allowed by the data for any . Orbiting gas at significantly smaller radii, however, would require values of significantly less than one.
As noted above, the two measurements of H2 from DoAr 21 by Bitner et al. (2008) gave different results, suggesting that the bulk of the 0–0 S(2) emitting gas lies to the north or south of the star. However, the 5.6 km s-1 FWHM of the S(2) line suggests that this gas is not coincident with the gas detected by Bary et al. (2002) in the 1–0 S(1) line. In general the S(2) line traces cooler gas, so the Bitner et al. (2008) observations may be tracing gas that is somewhat farther from DoAr 21 than the Bary et al. (2002) observations.
We have presented above a large body of data on DoAr 21, some of it seemingly contradictory. To conclude this discussion, we present here a broad picture of DoAr 21’s circumstellar environment. This is not the only possible scenario, but we suggest that it is consistent with all of the available data, and it is testable with future observations. In this scenario, DoAr 21 no longer possesses any substantial orbiting circumstellar material, either in the form of gas or dust. Either the system never had much of a disk (possibly as the result of the formation of the binary companion), or the extreme FUV and X-ray luminosity have photoevaporated the disk. The excess infrared emission, as well as the H2 emission, comes from the extended material seen in our Gemini images, at hundreds of AU from the star. This material may be molecular cloud material that is not directly associated with the formation of DoAr 21; DoAr 21 may simply have moved into the vicinity of this gas because of its motion through the cloud, as we discuss further below. The FUV flux from DoAr 21 has created a small-scale PDR in this nearby gas, exciting the observed H2, PAH, and VSG emission. As in models of PDRs (Allers et al., 2005), the 1–0 S(1) emission is at the edge of the PDR and extends farther into the ionized region, explaining why Bary et al. (2002) detect some emission in an E-W slit that does not intersect the bright ridge to the north, but Bitner et al. (2008) do not detect emission in a transition that traces cooler gas.111111While the bright spot 11 to the N lies outside the slit used by Bary et al. (2002), if we assume a Gaussian profile for the seeing with 14 FWHM, then roughly 12% of the flux of a point source 11 away from the star would fall within the slit, so the northern ridge could still make some contribution to the observed flux.
One major testable prediction of this scenario is the spatial distribution of H2 emission. This could be mapped with narrow-band filters, or (ideally) with an integral-field spectrograph that would also measure the line widths and line ratios to probe the physical conditions in the emitting gas. For example, observations of both the S(1) 1–0 and the S(1) 2–1 lines would probe whether the gas is predominantly thermally excited or pumped by FUV photons.
Spatially-unresolved observations at high spectral resolution should detect more flux in a N–S slit than in an E–W one; making observations close in time with different slit orientations would help determine whether time variability or spatial distribution is more important. Given that PDR models predict that 1–0 S(1) emission is spread over a range of emitting temperatures, the 1–0 S(1) line measured in a N–S slit may have a stronger flux and a somewhat narrower width than the line observed by Bary et al. (2002) as it may sample both hotter and cooler gas. In contrast, if there is a Keplerian disk that produces the 1–0 S(1) emission, as suggested by Bary et al. (2002), then closely-spaced observations with different slit orientations should produce the same flux and line width, and mapping of the line emission should show it closely associated with the stellar position of DoAr 21.
The proper motion of DoAr 21 provides an interesting, though admittedly speculative, piece of circumstantial evidence in favor of the hypothesis that DoAr 21 is illuminating ambient cloud material rather than a circumstellar disk. Loinard et al. (2008) measure a proper motion of mas yr-1 for DoAr 21. This proper motion in RA is significantly different from the mean proper motion for Oph members of mas yr-1 (Mamajek, 2008), and yet there is ample evidence from the measured distance, luminosity, Li absorption, and X-ray properties that DoAr 21 is a young star associated with the cloud. Mamajek (2008) gives proper motions for 38 candidate Oph members. Not counting the three stars that Mamajek rejects as non-members, the only star with an RA proper motion as discrepant from the mean as DoAr 21’s motion is GSS 20 (ROX 7), which Wilking et al. (2005) flag as “dwarf?”, i.e. a possible non-member.
If the mean Oph proper motion is representative of the space motion of the gas near DoAr 21, then DoAr 21 has a tangential motion of mas yr-1 ( km s-1) westward relative to the gas. This is consistent with the fact that there is less material visible to the east of DoAr 21 (Fig. 4) than in other directions. At this velocity, DoAr 21 would have been 1″ to the east just 60 years ago, and could have photoevaporated or ionized much of the material in its vicinity, just as it appears to be doing now in the region within 100 AU of the star. Such a high velocity relative to the ambient gas would be unusual, given the typical 1–2 km s-1 velocity dispersions of young associations, but not unheard of. One example is the high-velocity young star PV Cep (Goodman & Arce, 2004), which is moving at km s-1 relative to its local cloud.
To close, we note that the strong PAH emission at large distances from DoAr 21, and the implied strength of the FUV flux needed to excite it, lends empirical support to the hypothesis of Alexander, Clarke, & Pringle (2005) that there may be significant FUV flux from T Tauri stars even after accretion has ceased. Such a flux might enable photoevaporation to disperse outer disks on a short timescale even after accretion from the inner disk ceases.
5 Conclusions
We have presented a variety of new data on DoAr 21 in an attempt to understand its circumstellar environment and the influence of high-energy radiation on it. High-resolution mid-infrared images show PAH and very small grain emission in an irregular distribution over hundreds of AU from the star, with little emission from the inner 100 AU where a circumstellar disk might lie. A new high-resolution X-ray grating spectrum from Chandra reveals a very luminous, hard corona, dominated by plasma at temperatures up to K; neither this spectrum nor new high-resolution optical spectra show any evidence for accretion. The inferred FUV radiation from the transition region of DoAr 21 is strong enough to excite the observed PAH, VSG, and H2 emission, creating a small-scale PDR around DoAr 21. This strong radiation may also have played a role in removing any disk from around DoAr 21, despite its young age.
References
- Alexander, Clarke, & Pringle (2005) Alexander, R. D., Clarke, C. J., & Pringle, J. E. 2005, MNRAS, 358, 283
- Allamandola, Hudgins, & Sandford (1999) Allamandola, L. J., Hudgins, D. M., & Sandford, S. A. 1999, ApJ, 511, L115
- Allers et al. (2005) Allers, K. N., Jaffe, D. T., Lacy, J. H., Draine, B. T., & Richter, M. J. 2005, ApJ, 630, 368
- Anders & Grevesse (1989) Anders, E. & Grevesse, N. 1989, Geochim Cosm. Acta, 53, 197
- André et al. (1990) André, P., Montmerle, T., Feigelson, E. D., & Steppe, H. 1990, A&A, 240, 321
- André et al. (1992) André, P., Deeney, B. D., Phillips, R. B., & Lestrade, J. 1992, ApJ, 401, 667
- Argiroffi et al. (2004) Argiroffi, C., Drake, J. J., Maggio, A., Peres, G., Sciortino, S., & Harnden, F. R. 2004, ApJ, 609, 925
- Aufdenberg et al. (1999) Aufdenberg, J. P., Hauschildt, P. H., & Baron, E. 1999, MNRAS, 302, 599
- Bary et al. (2002) Bary, J. S., Weintraub, D. A., & Kastner, J. H. 2002, ApJ, 576, L73
- Bary et al. (2003) Bary, J. S., Weintraub, D. A., & Kastner, J. H. 2003, ApJ, 586, 1136
- Bary et al. (2008) Bary, J. S., Weintraub, D. A., Shukla, S. J., Leisenring, J. M., & Kastner, J. H. 2008, ApJ, 678, 1088
- Beck et al. (2008) Beck, T. L., McGregor, P. J., Takami, M., & Pyo, T.-S. 2008, ApJ, 676, 472
- Bitner et al. (2008) Bitner, M. A., et al. 2008, ApJ, 688, 1326
- Blumenthal et al. (1972) Blumenthal G.R., Drake G.W.F., Tucker W.H., 1972, ApJ, 172, 205
- Bontemps et al. (2001) Bontemps, S., et al. 2001, A&A, 372, 173
- Boulanger et al. (2005) Boulanger, F., et al. 2005, A&A, 436, 1151
- Bouvier & Appenzeller (1992) Bouvier, J. & Appenzeller, I. 1992, A&AS, 92, 481
- Bouvier et al. (1988) Bouvier, J., Bertout, C., & Bouchet, P. 1988, A&AS, 75, 1
- Brooks et al. (2001) Brooks, D. H., Costa, V. M., Lago, M. T. V. T., & Lanzafame, A. C. 2001, MNRAS, 327, 177
- Buser & Kurucz (1992) Buser, R., & Kurucz, R. L. 1992, A&A, 264, 557
- Canizares et al. (2005) Canizares C.R., et al., 2005, PASP, 117, 1144
- Casanova et al. (1995) Casanova, S., Montmerle, T., Feigelson, E. D., & Andre, P. 1995, ApJ, 439, 752
- Cash (1979) Cash, W. 1979, ApJ, 228, 939
- Chapman et al. (2008) Chapman, N. L., Mundy, L. G., Lai, S.-P., & Evans, N. J., II 2008, arXiv:0809.1106
- Chini et al. (1977) Chini, R., Elsaesser, H., Hefele, H., & Weinberger, R. 1977, A&A, 56, 323
- Chini (1981) Chini, R. 1981, A&A, 99, 346
- Churazov et al. (1996) Churazov, E., Gilfanov, M., Forman, W., & Jones, C. 1996, ApJ, 471, 673
- Cieza et al. (2007) Cieza, L., et al. 2007, ApJ, 667, 308
- Cieza et al. (2008) Cieza, L. A., Swift, J. J., Mathews, G. S., & Williams, J. P. 2008, ApJ, 686, L115
- Cohen et al. (1999) Cohen, M., Walker, R. G., Carter, B., Hammersley, P., Kidger, M., & Noguchi, K. 1999, AJ, 117, 1864
- D’Antona & Mazzitelli (1997) D’Antona, F., & Mazzitelli, I. 1997, Memorie della Societa Astronomica Italiana, 68, 807
- Dolidze & Arakelyan (1959) Dolidze, M. V. & Arakelyan, M. A. 1959, Soviet Ast., 3, 434
- Draine (2003) Draine, B. T. 2003, ARA&A, 41, 241
- Drake et al. (2009) Drake, J. J., Ercolano, B., Flaccomio, E., & Micela, G. 2009, arXiv:0905.1690
- Favata, Micela, & Sciortino (1998) Favata, F., Micela, G., & Sciortino, S. 1998, A&A, 337, 413
- Feigelson & Montmerle (1985) Feigelson, E. D. & Montmerle, T. 1985, ApJ, 289, 19
- Feigelson & Montmerle (1999) Feigelson, E. D. & Montmerle, T. 1999, ARA&A, 37, 363
- Feigelson, Garmire, & Pravdo (2002) Feigelson, E. D., Garmire, G. P., & Pravdo, S. H. 2002, ApJ, 572, 335
- Fernández et al. (2004) Fernández, M., et al. 2004, A&A, 427, 263
- Furlan et al. (2006) Furlan, E., et al. 2006, ApJS, 165, 568
- Gabriel & Jordan (1969) Gabriel, A. H., & Jordan, C. 1969, MNRAS, 145, 241
- Gagné et al. (2004) Gagné M., Skinner S. L., Daniel K. J., 2004, ApJ, 613, 393
- Galliano et al. (2008) Galliano, F., Madden, S. C., Tielens, A. G. G. M., Peeters, E., & Jones, A. P. 2008, ApJ, 679, 310
- Geers et al. (2006) Geers, V. C., et al. 2006, A&A, 459, 545
- Gómez et al. (2003) Gómez, M., Stark, D. P., Whitney, B. A., & Churchwell, E. 2003, AJ, 126, 863
- Goodman & Arce (2004) Goodman, A. A., & Arce, H. G. 2004, ApJ, 608, 831
- Gorti & Hollenbach (2009) Gorti, U., & Hollenbach, D. 2009, ApJ, 690, 1539
- Güdel & Telleschi (2007) Güdel M., Telleschi A., 2007, A&A, 474, 25
- Habart et al. (2003) Habart, E., Boulanger, F., Verstraete, L., Pineau des Forêts, G., Falgarone, E., & Abergel, A. 2003, A&A, 397, 623
- Habing (1968) Habing, H. J. 1968, Bull. Astron. Inst. Netherlands, 19, 421
- Hanner et al. (1995) Hanner, M. S., Brooke, T. Y., & Tokunaga, A. T. 1995, ApJ, 438, 250
- Haro (1949) Haro, G. 1949, AJ, 54, 188
- Herczeg et al. (2004) Herczeg, G. J., Wood, B. E., Linsky, J. L., Valenti, J. A., & Johns-Krull, C. M. 2004, ApJ, 607, 369
- Herczeg et al. (2006) Herczeg, G. J., Linsky, J. L., Walter, F. M., Gahm, G. F., & Johns-Krull, C. M. 2006, ApJS, 165, 256
- Hidajat (1961) Hidajat, B. 1961, Contributions from the Bosscha Observatory, 11, 1
- Hony et al. (2001) Hony, S., Van Kerckhoven, C., Peeters, E., Tielens, A. G. G. M., Hudgins, D. M., & Allamandola, L. J. 2001, A&A, 370, 1030
- Houck & Denicola (2000) Houck, J. C., & Denicola, L. A. 2000, Astronomical Data Analysis Software and Systems IX, 216, 591
- Igea & Glassgold (1999) Igea, J. & Glassgold, A. E. 1999, ApJ, 518, 848
- Imanashi et al. (2002) Imanishi K., Tsujimoto M., Koyama K., 2002, ApJ, 572, 300
- Itoh et al. (2003) Itoh, Y., Sugitani, K., Ogura, K., & Tamura, M. 2003, PASJ, 55, L77
- Jensen et al. (2004) Jensen, E. L. N., Mathieu, R. D., Donar, A. X., & Dullighan, A. 2004, ApJ, 600, 789
- Joblin et al. (1996) Joblin, C., Tielens, A. G. G. M., Geballe, T. R., & Wooden, D. H. 1996, ApJ, 460, L119
- Kastner et al. (2002) Kastner, J. H., Huenemoerder, D. P., Schulz, N. S., Canizares, C. R., & Weintraub, D. A. 2002, ApJ, 567, 434
- Kastner et al. (2004) Kastner, J. H., Huenemoerder, D. P., Schulz, N. S., Canizares, C. R., Li, Jingqiang, & Weintraub, D. A. 2004, ApJ, 605, 49
- Keenan & McNeil (1989) Keenan, P. C., & McNeil, R. C. 1989, ApJS, 71, 245
- Koerner et al. (2000) Koerner, D. W., Jensen, E. L. N., Cruz, K. L., Guild, T. B., & Gultekin, K. 2000, ApJ, 533, L37
- Koyama et al. (1994) Koyama, Katsuji, Maeda, Yoshitomo, Ozaki, Masanobu, Ueno, Shiro, Kamata, Yuichi, Tawara, Yuzuru, Skinner, Stephen, & Yamauchi, Shigeo 1994, PASJ, 46, 125
- Kundurthy et al. (2006) Kundurthy, P., Meyer, M. R., Robberto, M., Beckwith, S. V. W., & Herbst, T. 2006, AJ, 132, 2469
- Massarotti et al. (2005) Massarotti, A., Latham, D. W., Torres, G., Brown, R. A., & Oppenheimer, B. D. 2005, AJ, 129, 2294
- Lacy, Moffett, & Evans (1976) Lacy, C. H., Moffett, T. J., & Evans, D. S. 1976, ApJS, 30, 85
- Lada & Wilking (1984) Lada, C. J. & Wilking, B. A. 1984, ApJ, 287, 610
- Liseau et al. (1999) Liseau, R., et al. 1999, A&A, 344, 342
- Loinard et al. (2008) Loinard, L., Torres, R. M., Mioduszewski, A. J., & Rodríguez, L. F. 2008, ApJ, 675, L29
- Luhman & Rieke (1999) Luhman, K. L. & Rieke, G. H. 1999, ApJ, 525, 440
- MacFarlane et al. (2004) MacFarlane, J. J., Golovkin, I. E., Woodruff, P. R., Welch, D. R., Oliver, B. V., Mehlhorn, T. A., Campbell, R. B. 2004, in Proceedings of the Third Conference on Inertial Fusion Science and Applications, B. A. Hammel, D. D. Meyerhofer, J. M. ter Vehn, & H. Azechi, eds., Am. Nucl. Soc.
- Maloney et al. (1996) Maloney, P. R., Hollenbach, D. J., & Tielens, A. G. G. M. 1996, ApJ, 466, 561.
- Mamajek (2008) Mamajek, E. E. 2008, Astronomische Nachrichten, 329, 10
- Martin et al. (1992) Martin, P. G., et al. 1992, ApJ, 392, 691
- Martin, Schwarz, & Mandy (1996) Martin, P. G., Schwarz, D. H., & Mandy, M. E. 1996, ApJ, 461, 265
- Martín et al. (1998) Martín, E. L., Montmerle, T., Gregorio-Hetem, J., & Casanova, S. 1998, MNRAS, 300, 733
- McClure (2009) McClure, M. 2009, ApJ, 693, L81
- Moffett (1974) Moffett, T. J. 1974, ApJS, 29, 1
- Montes et al. (1997) Montes, D., Fernandez-Figueroa, M. J., de Castro, E., & Sanz-Forcada, J. 1997, A&AS, 125, 263
- Montmerle et al. (1983) Montmerle, T., Koch-Miramond, L., Falgarone, E., & Grindlay, J. E. 1983, ApJ, 269, 182
- Morrison & McCammon (1983) Morrison R., McCammon D., 1983, ApJ, 270, 119
- Najita, Carr, & Mathieu (2003) Najita, J., Carr, J. S., & Mathieu, R. D. 2003, ApJ, 589, 931
- Nomura & Millar (2005) Nomura, H., & Millar, T. J. 2005, A&A, 438, 923
- Nomura et al. (2007) Nomura, H., Aikawa, Y., Tsujimoto, M., Nakagawa, Y., & Millar, T. J. 2007, ApJ, 661, 334
- Okumura et al. (1998) Okumura, K., Pérault, M., & Longval, Y. 1998, technical report, Ghosts in ISOCAM images (http://www.iso.vilspa.esa.es/users/expl_lib/CAM_list.html)
- Padgett et al. (2008) Padgett, D. L., et al. 2008, ApJ, 672, 1013
- Palla & Stahler (1999) Palla, F., & Stahler, S. W. 1999, ApJ, 525, 772
- Phillips, Lonsdale, & Feigelson (1991) Phillips, R. B., Lonsdale, C. J., & Feigelson, E. D. 1991, ApJ, 382, 261
- Porquet & Dubau (2000) Porquet D.,Dubau J., 2000, A&AS, 143, 495
- Prato (2007) Prato, L. 2007, ApJ, 657, 338
- Preibisch (1999) Preibisch, T. 1999, A&A, 345, 583
- Preibisch et al. (2005) Preibisch, T., et al. 2005, ApJS, 160, 401
- Puget & Leger (1989) Puget, J. L., & Leger, A. 1989, ARA&A, 27, 161
- Ramsay Howat & Greaves (2007) Ramsay Howat, S. K., & Greaves, J. S. 2007, MNRAS, 379, 1658
- Román-Zúñiga et al. (2007) Román-Zúñiga, C. G., Lada, C. J., Muench, A., & Alves, J. F. 2007, ApJ, 664, 357
- Rydgren et al. (1976) Rydgren, A. E., Strom, S. E., & Strom, K. M. 1976, ApJS, 30, 307
- Rydgren & Vrba (1983) Rydgren, A. E., & Vrba, F. J. 1983, ApJ, 267, 191
- Sanz-Forcada, Maggio, & Micela (2003) Sanz-Forcada, J., Maggio, A., & Micela, G. 2003, A&A, 408, 1087
- Schmitt et al. (2005) Schmitt, J. H. M. M., Robrade, J., Ness, J.-U., Favata, F., & Stelzer, B. 2005, A&A, 432, L35
- Sellgren, Uchida, & Werner (2007) Sellgren, K., Uchida, K. I., & Werner, M. W. 2007, ApJ, 659, 1338
- Siess, Dufour, & Forestini (2000) Siess, L., Dufour, E., & Forestini, M. 2000, A&A, 358, 593
- Smith et al. (2001) Smith R. K., Brickhouse N. S., Liedahl D. A., Raymond J. C., 2001, ApJ, 556, L91
- Stapelfeldt et al. (2009) Stapelfeldt, K. R., et al. 2009, in preparation
- Stassun et al. (2006) Stassun, K. G., van den Berg, M., Feigelson, E., & Flaccomio, E. 2006, ApJ, 649, 914
- Stelzer & Schmitt (2004) Stelzer, B. & Schmitt, J. H. M. M. 2004, A&A, 418, 687
- Takami et al. (2004) Takami, M., Chrysostomou, A., Ray, T. P., Davis, C., Dent, W. R. F., Bailey, J., Tamura, M., & Terada, H. 2004, A&A, 416, 213
- Telleschi et al. (2007) Telleschi, A., Güdel, M., Briggs, K. R., Audard, M., & Scelsi, L. 2007, A&A, 468, 443
- Tielens (2008) Tielens, A. G. G. M. 2008, ARA&A, 46, 289
- Torres et al. (2007) Torres, R. M., Loinard, L., Mioduszewski, A. J., & Rodríguez, L. F. 2007, ApJ, 671, 1813
- Valenti, Johns-Krull, & Linsky (2000) Valenti, J. A., Johns-Krull, C. M., & Linsky, J. L. 2000, ApJS, 129, 399
- Valenti et al. (2003) Valenti, J. A., Fallon, A. A., & Johns-Krull, C. M. 2003, ApJS, 147, 305
- Vrba et al. (1993) Vrba, F. J., Coyne, G. V., & Tapia, S. 1993, AJ, 105, 1010
- Vuong et al. (2003) Vuong, M. H., Montmerle, T., Grosso, N., Feigelson, E. D., Verstraete, L., & Ozawa, H. 2003, A&A, 408, 581
- Weingartner & Draine (2001a) Weingartner, J. C., & Draine, B. T. 2001a, ApJ, 548, 296
- Weingartner & Draine (2001b) Weingartner, J. C., & Draine, B. T. 2001b, ApJS, 134, 263
- Weintraub et al. (2000) Weintraub, D. A., Saumon, D., Kastner, J. H., & Forveille, T. 2000, ApJ, 530, 867
- White & Basri (2003) White, R. J., & Basri, G. 2003, ApJ, 582, 1109
- White & Ghez (2001) White, R. J., & Ghez, A. M. 2001, ApJ, 556, 265
- Wilking, Gagné, & Allen (2008) Wilking, B., Gagné, M., & Allen, L. 2008, in Handbook of Star Forming Regions, Vol. 2, ed. B. Reipurth (San Francisco: ASP), pp. 351–380; arXiv:0811.0005
- Wilking et al. (2005) Wilking, B. A., Meyer, M. R., Robinson, J. G., & Greene, T. P. 2005, AJ, 130, 1733
- Wilking et al. (1987) Wilking, B. A., Schwartz, R. D., & Blackwell, J. H. 1987, AJ, 94, 106
- Wood et al. (2005) Wood, B. E., Redfield, S., Linsky, J. L., Müller, H.-R., & Zank, G. P. 2005, ApJS, 159, 118