Eddington ratio governs the equivalent width of Mg II emission line in active galactic nuclei
Abstract
We have investigated the ensemble regularities of the equivalent widths (EWs) of Mg II emission line of active galactic nuclei (AGNs), using a uniformly selected sample of 2092 Seyfert 1 galaxies and quasars at in the spectroscopic data set of Sloan Digital Sky Survey Fourth Data Release. We find a strong correlation between the EW of Mg II and the AGN Eddington ratio (): . Furthermore, for AGNs with the same , their EWs of Mg II show no correlation with luminosity, black hole mass or line width, and the Mg II line luminosity is proportional to continuum luminosity, as expected by photoionization theory. Our result shows that Mg II EW is not dependent on luminosity, but is solely governed by .
1 Introduction
Mg II 2800 is one of the most prominent broad emission lines in the near-ultraviolet spectra of type-1 active galactic nuclei (AGNs, including Seyfert galaxies and quasars). Its equivalent width (EW) is generally in the range of about 10–100Å (Dietrich et al. 2002). Theory shows that as a low-ionization line, Mg II originates from optically thick (i.e. large column density) clouds only that suffer little from radial motions, thus it is valuable in probing the properties of the clouds gravitationally bound in the AGN broad-line region (BLR), and in estimating the virial mass of the central supermassive black holes (e.g. Grandi & Phillips 1979, McLure & Dunlop 2004, Wang et al. 2009).
However, Mg II is highly blended with the Fe II multiplet emission. This complicates accurate Mg II measurement in AGN spectra, and makes a comprehensive study difficult of Mg II using large, homogeneous AGN samples. By composite-spectrum analysis, Dietrich et al. (2002) found a negative correlation between the Mg II EW and the continuum luminosity, similar to the Baldwin (1977) effect first discovered in C IV line. However, except that and some others using small samples (e.g., Grandi & Phillips 1979, Zheng et al. 1992, Espey & Andreadis 1999, Croom et al. 2002), there has been few studies so far on the Mg II properties using a large, homogeneous AGN sample.
Recently, this technical difficulty has been overcome by the availability of the detailed Fe II templates in the wavelength region covered by Mg II (e.g., Tsuzuki et al. 2006; cf. Vestergaard & Wilkes 2001). In this Letter, we explore the regularities of the Mg II EW in the AGN ensemble, by taking advantage of the unprecedented spectroscopic data from the Sloan Digital Sky Survey (SDSS; York et al. 2000) and the new Fe II templates. We find that, at the 0th-order, Mg II luminosity is directly proportional to continuum luminosity; at the 1st-order, the proportional coefficient correlates negatively with the Eddington ratio ().111Eddington ratio () is the ratio between the bolometric and Eddington luminosities. Eddington luminosity (), by definition, is the luminosity at which the gravity of the central source acting on an electron–proton pair (i.e. fully ionized gas) is balanced by the radiation pressure due to electron Thomson scattering. Thus Eddington ratio is different from relative/normalized accretion rate both in meaning and in scope of application; see Dong et al. (2009) for a detailed discussion. For clarification and for the ease of notation, below we use or alternately. Throughout this paper, we use a cosmology with =70 km s-1 Mpc-1, =0.3 and =0.7.
2 Sample and Data analysis
We use the UV sample of 2092 Seyfert 1 galaxies and quasars of Dong et al. (2009), selected from the spectral data set of the SDSS Fourth Data Release (Adelman-McCarthy et al. 2006). Sample definition and data analysis methods are described in detail in that work. Briefly, we select quasars with both the H and Mg II present in the SDSS spectra and with continuum and emission lines suffering little from the contamination of the host-galaxy starlight. The criteria are: (a) , (b) the median signal-to-noise ratio (S/N) per pixel, and (c) the rest-frame absorption-line EWs of Ca K (3934Å), Ca H + H (3970Å) and H (4102Å) . The H BLR has been extensively studied using reverberation mapping for about forty type-1 AGNs, and the black hole mass formalisms based on single-epoch H are well calibrated with reverberation mapping data (Peterson et al. 2004, Bentz et al. 2006, Bentz et al. 2009). Thus the presence of H in our sample is helpful to double check the findings in this Letter (see §4).
As described in Dong et al. (2009), the SDSS spectra are corrected for Galactic extinction and the Mg II emission is separated from AGN continuum, Balmer continuum and the Fe II multiplets. Then the broad components of the Mg II doublet lines are each modeled with a truncated 5-parameter Gauss-Hermite series profile (see also Salvainder et al. 2007). The narrow component of each line is fitted with a Gaussian. In the fitting, the narrow component is constrained as follows: FWHM and flux per cent of the total Mg II flux (Wang et al. 2009; cf. Wills et al. 1993). UV Fe II is modeled with the tabulated semiempirical template generated by Tsuzuki et al. (2006) based on their measurements of I ZW 1; in the wavelength region covered by the Mg II emission, this template uses the calculation with the CLOUDY photoionization code (Ferland et al. 1998).
All the data used in this Letter are presented in Dong et al. (2009). The detailed fitting results are available online for the decomposed spectral components (continuum, Fe II multiplets and other emission lines).222Available at http://staff.ustc.edu.cn/~xbdong/Data_Release/ell_effect/, together with auxiliary code to explain and demonstrate the fitting and the parameters. We compared the Mg II parameter values fitted by our fitting method with those by the methods of McLure & Dunlop (2004) and Salviander et al. (2007). Our results are well consistent with those obtained by Salviander et al., and roughly consistent with those obtained by McLure & Dunlop (Wang et al. 2009; cf. Salviander et al. 2007).
We estimate the measurement uncertainties of the parameters using a bootstrap method (Wang et al. 2009; cf. Dong et al. 2008). The estimated typical 1 relative errors are 10% and 8%, respectively, for the fluxes of broad Mg II and H; 20% and 15%, respectively, for the FWHM of broad Mg II and H; 8% and 5%, respectively, for the slope and normalization of the local continua. According to standard propagation of errors, the formal 1 error of Mg II EW (in log-scale) is typically 0.05 dex. We must note that the thus estimated errors still do not account for the uncertainties caused by Fe II template mismatch, etc., and that it is almost impossible to pin down the real measurement errors for individual objects. Hence we waive the analysis on the intrinsic scatter of the relations of interest in this Letter.
We calculate the black hole masses, , based on the Mg II FWHM and the monochromatic luminosity (3000Å) using the formalism of McLure & Dunlop (2004). The small discrepancy of the fitted Mg II parameters between our method and the method of McLure & Dunlop (2004) has no significant effect on our conclusions (see also §4). The Eddington ratios are calculated assuming a bolometric luminosity correction (McLure & Dunlop 2004). The mean and standard deviation (computed in log-space) of Mg II FWHM are 3200 and 0.18 dex; , ergs s-1 and 0.31 dex; , and 0.42 dex; , 0.39 and 0.38 dex.
3 Results
3.1 Correlations of Mg II EW with other quantities
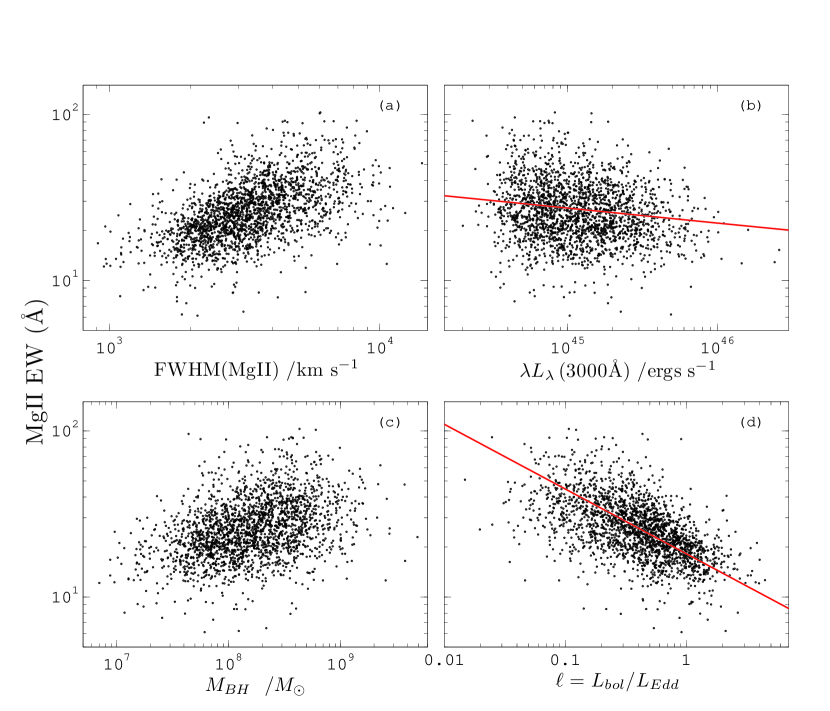
We use the Spearman rank method to perform bivariate correlation analysis of Mg II EW with Mg II FWHM, , and . The results are summarized in Table 1 (top panel), giving the Spearman coefficient () and the two-tailed probability () that a correlation is not present. The strongest correlation of Mg II EW is with () which is a combination of Mg II FWHM and as . The correlation of Mg II EW with another combination, (), is much weaker (). The correlation with FWHM () is slightly weaker than that with , while the correlation with is weak (). These correlations are illustrated in Fig. 1.
We must note that because the SDSS spectroscopical survey is magnitude-limited, Mg II FWHM, , and in our sample correlate one with another apparently. The apparent (likely not intrinsic) correlation between and is further enhanced by the correlation of their measurement errors, because both and are constructed from Mg II FWHM and . The Spearman correlation coefficients () of with Mg II FWHM, and are , and , respectively.
In light of the serious inter-dependence among these four quantities, the correlations of Mg II EW with the first three quantities is probably only the secondary effect of the strongest (thus presumably intrinsic) correlation with . To test this possibility, we perform partial Spearman rank correlation analysis (Kendall & Stuart 1979). The results are summarized in Table 1. When controlling for , none of the correlations of Mg II EW with FWHM, or is significant at ; yet controlling for these three quantities, the correlation of Mg II EW with is still significant with . This fact suggests that is the sole parameter, at least among the four, that governs the EW of Mg II.
From Fig. 1 there appears a linear relation between Mg II EW and in log–log scale. We perform linear regression, treating as the independent variable, and find:
| (1) |
The errors on the fit parameters are purely statistical, and the actual uncertainty could be somewhat larger (cf. §2).
3.2 The dependence of Mg II EW: not on luminosity, but on Eddington ratio only
As suggested by the above partial correlation tests, the Mg II EW likely does not depend on the continuum luminosity or black hole mass, but on only as in Eqn. 1. That is, (1) the emission-line luminosity, , is directly proportional to the continuum luminosity at a fixed , while (2) the proportional coefficient is different for objects with different .
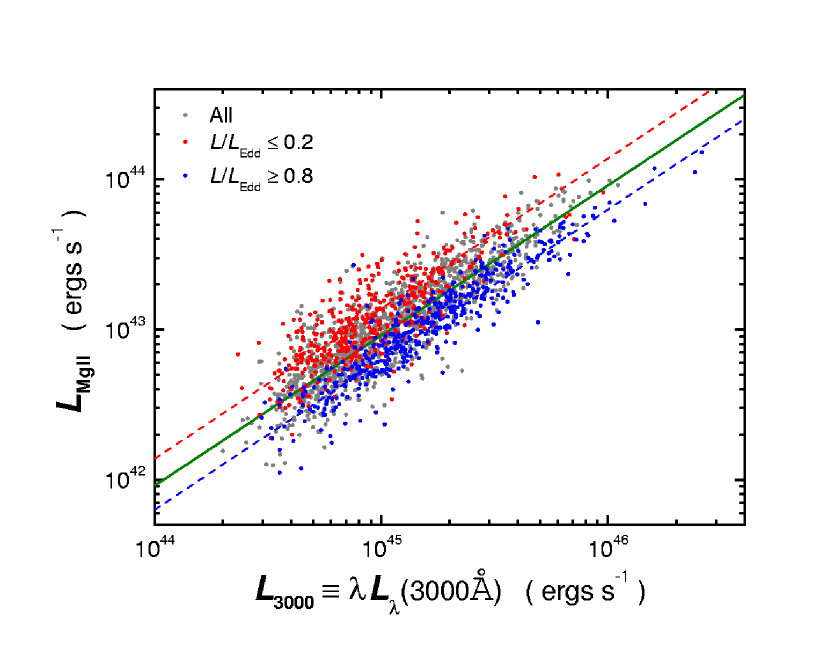
To further investigate the Mg II EW– relation, we take an alternative approach to analyze this problem. In Fig. 2 we plot the distribution of versus using the objects in our sample, with the 433 objects of (high- subsample) denoted in blue and the 456 objects of (low- subsample) in red. It is evident that the objects of the high- subsample are systematically smaller than those of the low- subsample in at any given . We perform linear regression in log scale with being taken as the independent variable, according to
| (2) |
We fit the relation for the full sample, the high- and low- subsamples, and the intermediate- subsample with , respectively, with and without being fixed to be 1. The results are summarized in Table 2. The low- subsample has 456 objects clustering mostly in a narrow range of luminosity, yet with a fairly large dynamical range in of about 1 order of magnitude. The fit with being an additional free parameter for this subsample is not statistically guaranteed according to -test. Thus in Table 2 we list only the fitting result with fixed to be 1. Instead, we select the subsample of 299 objects with and perform the fitting. The results are listed in Table 2 too.
The best-fit values for the high- and intermediate- subsamples are well consistent with 1 within 1. For the subsample, the best-fit is consistent with 1 within 1.5. As Mg II EW is equivalent to , such a direct proportional relation between and means that the Mg II EW does not depend on luminosity.
The mean values of of the full sample, the high-, intermediate-, and low- subsamples are , 0.08, , and , respectively. The coefficients () of these best-fit proportion () relations are consistent with the predictions of Eqn. 1.
The best-fit () for the full sample is significantly lower than 1, which means an apparent dependence of Mg II EW on luminosity for the full sample, as illustrated in Fig.1. However, this can be naturally explained by the selection effect mentioned in §3.1: high- (and thus small-EW) objects dominate the high-luminosity end while low- (and thus large-EW) objects tend to cluster in the low-luminosity end, which is clearly displayed in Fig. 2. As a demonstration (see also §4), in the panel b of Fig. 1 we over-plot the inferred Mg II EW– relation, the Baldwin effect, that corresponds to the fitted relation where .
4 Discussions and conclusions
To check possible effects of black hole estimation on the above correlations, we re-examine the above correlation tests by calculating using all the other available formalisms based on broad H and Mg II lines (see a compilation of the formalisms in McGill et al. [2008] and the formalisms in Wang et al. [2009] and Vestergaard & Osmer [2009]). All the tests give similar results to those listed in Table 1 (top panel). This is mainly because the dynamical range covered by our sample is not large (dex), and the various formalisms based on single-epoch H or Mg II have only subtle differences one from another (Wang et al. 2009). In the bottom panel of Table 1, we also list the results using the FWHM of broad H, the luminosity (5100Å), the black hole masses calculated with the formalism presented in Collin et al. (2006, their Eqn. 7) and the Eddington ratios assuming (5100Å).
Considering the fairly narrow dynamical range of ( dex in log-scale) and the measurement errors, such a significant correlation between Mg II EW and is surprising, suggesting a rather tight intrinsic relationship between them. More importantly, Mg II EW is likely to be intrinsically solely dependent on but not on continuum luminosity. The dynamical range of the Mg II EW of the objects in our sample is similar to that of the composite spectra of Dietrich et al. (2002). They reported a Baldwin effect of Mg II as . This slope is exactly consistent with our value (0.91; see Table 2 and Fig. 1b) for the full sample, which is likely due to the selection effect discussed above. However, the range of our is ergs s-1 whereas that of Dietrich et al. (2002) is ergs s-1 (converted from (1450Å) by assuming ). Our sample lacks objects of relatively low luminosity. Thus, if our above finding holds for the AGN ensemble in the full luminosity range as in Dietrich et al. (2002), then the classical Baldwin effect of Mg II is purely a secondary effect of the EW– relation in combination with the selection effect inherent in any flux-limited sample (see the analysis in the last paragraph of §3.2).
It is intriguing to understand the EW– relation as expressed in Eqn. 1 (and Table 2; cf. Baskin & Laor 2004, Bachev et al. 2008). First of all, the fact that the Mg II luminosity is directly proportional to continuum luminosity is just as expected from the photoionization theory. Second, in the photoionization picture (Osterbrock & Ferland 2006), the emission-line EW is dependent mainly on two parameters, the shape of the AGN continuum and the covering factor of the line-emitting clouds, thus the fact that the proportional coefficient is different for different suggests that either the continuum shape or the covering factor or both is dependent on .
Zheng & Malkan (1993) and others have proposed a model in which systematic variation in the ionizing continuum shape with luminosity explains the Baldwin Effect, via the softening of the accretion disk spectrum with increasing black hole mass. More recently, Korista et al. (1998) generated grids of photoionization models to demonstrate this relationship quantitatively, and additionally invoked variations in gas metallicity with luminosity to explain the peculiar weakness of the Baldwin Effect in N V 1240. The phenomenological model of Korista et al. relating ionizing continuum shape and gas metallicity with quasar luminosity (or ) generally explains the Baldwin Effect in almost all emission lines (cf. Dietrich et al. 2002). The remaining question is the underlying physical link between the shape of the ionizing continuum and the fundamental parameters of the accretion process such as and normalized accretion rate (i.e. , as the accretion rate is not an observable), which is still not clear (see, e.g., §6 of Dietrich et al. 2002). There are observational reports that the ratio of the X-ray to the bolometric/optical luminosity correlates negatively with (Vasudevan & Fabian 2007, Kelly et al. 2008). This might account for the Mg II EW– relation as follows: as increases, the ratio of the X-ray to UV photons decreases, i.e., the heating of the H I∗ region weakens and thus the Mg II EW decreases. We will use other emission lines such as Fe II to explore this issue in a following paper (Dong et al. 2009).
Alternatively, we propose a physical model involving cloud properties (effectively the covering factor). The details of the model are to be presented in the following paper (Dong et al. 2009); here we only present a brief description. As described in §1, Mg II line originates only from a thin transition layer in the partially ionized H I∗ region of the ionization-bounded (high-) clouds (see Collin-Souffrin et al. [1986] for the details). On the other hand, because low- clouds are not massive enough to balance the radiation pressure force that is boosted due to photoelectric absorption as large as by about one or more orders of magnitude, they are blown out of the AGN BLR even at small . (see Marconi et al. 2008, 2009; also Fabian et al. 2006, but cf. Netzer 2009). According to the photoionization calculation of Fabian et al. (2006, see their Fig. 1), for dust-free clouds of cm-2 with photoionization parameter , the lower limit of the column density of the clouds that can survive in the BLR is approximately proportional to , as cm-2; for dusty clouds, cm-2. That is, the higher the of an AGN is, the larger is the fraction of high- clouds that are accumulated in the BLR. So, for Mg II line, it is the ionization-bounded clouds gravitationally bound in the BLR that emit it predominantly. Thus, in the AGN ensemble, as increases, the number of the clouds that emit Mg II efficiently, in other words, the effective covering factor, decreases, and so does the Mg II EW. Thus the model explains the EW– relation naturally. The distinguishing of the two models requires detailed photoionization modeling, which is beyond the scope of this Letter.
References
- Adelman-McCarthy et al. (2006) Adelman-McCarthy, J. K., et al. 2006, ApJS, 162, 38
- Bachev et al. (2004) Bachev, R., Marziani, P., Sulentic, J. W., Zamanov, R., Calvani, M., & Dultzin-Hacyan, D. 2004, ApJ, 617, 171
- Baldwin (1977) Baldwin, J. A. 1977, ApJ, 214, 679
- Baskin & Laor (2004) Baskin, A., & Laor, A. 2004, MNRAS, 350, L31
- Bentz et al. (2006) Bentz, M. C., Peterson, B. M., Pogge, R. W., Vestergaard, M., & Onken, C. A. 2006, ApJ, 644, 133
- Bentz et al. (2009) Bentz, M. C., Peterson, B. M., Netzer, H., Pogge, R. W., & Vestergaard, M. 2009, ApJ, 697, 160
- Collin-Souffrin et al. (1986) Collin-Souffrin, S., Joly, M., Pequignot, D., & Dumont, S. 1986, A&A, 166, 27
- Collin et al. (2006) Collin, S., Kawaguchi, T., Peterson, B. M., & Vestergaard, M. 2006, A&A, 456, 75
- Croom et al. (2002) Croom, S. M., et al. 2002, MNRAS, 337, 275
- Dietrich et al. (2002) Dietrich, M., Hamann, F., Shields, J. C., Constantin, A., Vestergaard, M., Chaffee, F., Foltz, C. B., & Junkkarinen, V. T. 2002, ApJ, 581, 912
- Dong et al. (2008) Dong, X., Wang, T., Wang, J., Yuan, W., Zhou, H., Dai, H., & Zhang, K. 2008, MNRAS, 383, 581
- Dong et al. (2009) Dong, X., Wang, J., Wang, T., Wang, H., Fan, X., Zhou, H., & Yuan, W. 2009, arXiv:0903.5020 (submitted to ApJ)
- Espey & Andreadis (1999) Espey, B., & Andreadis, S. 1999, Quasars and Cosmology, 162, 351
- Fabian et al. (2006) Fabian, A. C., Celotti, A., & Erlund, M. C. 2006, MNRAS, 373, L16
- Ferland et al. (1998) Ferland, G. J., Korista, K. T., Verner, D. A., Ferguson, J. W., Kingdon, J. B., & Verner, E. M. 1998, PASP, 110, 761
- Grandi & Phillips (1979) Grandi, S. A., & Phillips, M. M. 1979, ApJ, 232, 659
- Kelly et al. (2008) Kelly, B. C., Bechtold, J., Trump, J. R., Vestergaard, M., & Siemiginowska, A. 2008, ApJS, 176, 355
- Kendall & Stuart (1979) Kendall, M., & Stuart, A. 1979, The advanced theory of statistics. Vol.2: Inference and relationship, London: Griffin, 1979, 4th ed.
- Korista et al. (1998) Korista, K., Baldwin, J., & Ferland, G. 1998, ApJ, 507, 24
- Marconi et al. (2008) Marconi, A., Axon, D. J., Maiolino, R., Nagao, T., Pastorini, G., Pietrini, P., Robinson, A., & Torricelli, G. 2008, ApJ, 678, 693
- Marconi et al. (2009) Marconi, A., Axon, D. J., Maiolino, R., Nagao, T., Pietrini, P., Risaliti, G., Robinson, A., & Torricelli, G. 2009, ApJ, 698, L103
- McGill et al. (2008) McGill, K. L., Woo, J.-H., Treu, T., & Malkan, M. A. 2008, ApJ, 673, 703
- McLure & Dunlop (2004) McLure, R. J., & Dunlop, J. S. 2004, MNRAS, 352, 1390
- Netzer (2009) Netzer, H. 2009, ApJ, 695, 793
- Osterbrock & Ferland (2006) Osterbrock, D. E., & Ferland, G. J. 2006, Astrophysics of gaseous nebulae and active galactic nuclei, 2nd. ed. (Sausalito, CA, University Science Books)
- Peterson et al. (2004) Peterson, B. M., et al. 2004, ApJ, 613, 682
- Salviander et al. (2007) Salviander, S., et al., 2007, ApJ, 662, 131
- Tsuzuki et al. (2006) Tsuzuki, Y., Kawara, K., Yoshii, Y., Oyabu, S., Tanabé, T., & Matsuoka, Y. 2006, ApJ, 650, 57
- Vasudevan & Fabian (2007) Vasudevan, R. V., & Fabian, A. C. 2007, MNRAS, 381, 1235
- Véron-Cetty et al. (2004) Véron-Cetty, M.-P., Joly, M., & Véron, P. 2004, A&A, 417, 515
- Vestergaard & Wilkes (2001) Vestergaard, M., & Wilkes, B. J. 2001, ApJS, 134, 1
- Vestergaard & Osmer (2009) Vestergaard, M., & Osmer, P. S. 2009, ApJ, 699, 800
- Wang et al. (2009) Wang, J.-G., Dong, X.-B., Wang, T.-G., Ho, L. C., Yuan, W., Wang, H., Zhang, K., Zhang, S., & Zhou, H. 2009, submitted to ApJ
- York et al. (2000) York, D. G. et al. 2000, AJ, 120, 1579
- Zheng et al. (1992) Zheng, W., Fang, L.-Z., & Binette, L. 1992, ApJ, 392, 74
- Zheng & Malkan (1993) Zheng, W., & Malkan, M. A. 1993, ApJ, 415, 517
| FWHM | (; FWHM) b bfootnotemark: | (; ) b bfootnotemark: | (; ) b bfootnotemark: | (FWHM; ) b bfootnotemark: | (; ) b bfootnotemark: | (; ) b bfootnotemark: | ||||
|---|---|---|---|---|---|---|---|---|---|---|
| c cfootnotemark: | 0.55 | 0.18 | 0.38 | 0.59 | 0.23 | 0.57 | 0.48 | 0.05 | 0.02 | 0.00 |
| c cfootnotemark: | 1e-38 | 6e-16 | 1e-38 | 1e-38 | 1e-38 | 1e-38 | 1e-38 | 0.03 | 0.3 | 0.8 |
| d dfootnotemark: | 0.49 | 0.22 | 0.27 | 0.55 | 0.28 | 0.51 | 0.49 | 0.07 | 0.02 | 0.04 |
| d dfootnotemark: | 1e-38 | 8e-25 | 1e-38 | 1e-38 | 1e-38 | 1e-38 | 1e-38 | 0.001 | 0.5 | 0.07 |
| Sample | aa For every (partial) correlation, we list the Spearman rank correlation coefficient () and the probability of the null hypothesis ( ) for the 2092 objects in the sample. | ||
|---|---|---|---|
| Full | 2092 | b bfootnotemark: | |
| Full | 2092 | 1 c cfootnotemark: | |
| 433 | |||
| 433 | 1 c cfootnotemark: | ||
| 1203 | |||
| 1203 | 1 c cfootnotemark: | ||
| 456 | 1 c cfootnotemark: | ||
| 299 | |||
| 299 | 1 c cfootnotemark: |