A Corona Australis cloud filament seen in NIR scattered light
Abstract
Context. Dust emission and scattering provide tools for the study of interstellar clouds. Detailed knowledge of grain properties is essential for correct analysis of these observations. However, dust properties are suspected to change from diffuse to dense regions. The changes could affect our interpretation of observations from large scales (e.g., clump mass spectra) down to the structure of individual cores.
Aims. We study a northern part of the Corona Australis molecular cloud that consists of a filament and a dense sub-millimetre core inside the filament. Our aim is to measure dust temperature and sub-mm emissivity within the region. We also look for confirmation that near-infrared (NIR) surface brightness can be used to study the structure of even very dense clouds.
Methods. We extend our previous NIR mapping south of the filament. The dust colour temperatures are estimated using Spitzer 160 m and APEX/Laboca 870 m maps. The column densities derived based on the reddening of background stars, NIR surface brightness, and thermal sub-mm dust emission are compared. A three dimensional toy model of the filament is used to study the effect of anisotropic illumination on near-infrared surface brightness and the reliability of dust temperature determination.
Results. Relative to visual extinction, the estimated emissivity at 870 m is . This is similar to the values found in diffuse medium. A significant increase in the sub-millimetre emissivity seems to be excluded. In spite of saturation, NIR surface brightness was able to accurately pinpoint, and better than measurements of the colour excesses of background stars, the exact location of the column density maximum. Both near- and far-infrared data show that the intensity of the radiation field is higher south of the filament.
Key Words.:
ISM: Structure – ISM: Clouds – Submillimeter – Infrared: ISM – dust, extinction – Scattering – Techniques: photometric1 Introduction
The column densities of dense molecular clouds can be estimated in several ways. Because the dust can usually assumed to be well mixed with the gas, dust can be used as a tracer of cloud structure. The available tools are based on dust extinction, thermal dust emission, and light scattering.
Extinction can be traced with star counts. However, in the NIR regime and for dense clouds it is more common to make use of the reddening that takes place when the light from background stars travels through a dust cloud. The method is useful particularly in NIR because, at those wavelengths, the variation in the intrinsic colours of background stars is small, the NIR extinction curve is relatively insensitive to changes in the dust populations, and the lower optical depths allow studies of clouds with visual extinctions up to . The reliability can be further increased by using several NIR bands, the combination of J-, H-, and K-bands being the most common one (e.g., Lombardi & Alves Lombardi2001 (2001), Lombardi Lombardi2009 (2009)).
A complementary tool is provided by thermal dust emission at far-IR and millimetre wavelengths. The emission is optically thin and, therefore, capable of probing higher densities than what are accessible by observations of background stars. The conversion between intensity and column density requires knowledge of dust temperature and dust emissivity. The colour temperature can be estimated from observations of two or more wavelengths. However, there are always temperature variations along the line-of-sight and, because warm dust produces much stronger signal than cold dust, the derived colour temperature can be significantly higher than the actual temperature of the bulk of dust. The problem is acerbated in pre-stellar cores where FIR observations can completely ignore the cold core where the temperature can be below 10 K or, at the very centre, even close to 6 K (Crapsi et al. Crapsi2007 (2007); Harju et al. Harju2008 (2008)). In geometrically simple cases, modelling can be used to estimate the temperature variations and to correct the column density estimates accordingly (e.g., Stamatellos et al. Stamatellos2007 (2007))
Dust emissivity and the spectral index appear to vary from region to region (Cambrésy et al. Cambresy2001 (2001), del Burgo et al. delBurgo2003 (2003), Dupac et al. Dupac2003 (2003); Kramer et al. Kramer2003 (2003), Stepnik et al. Stepnik2003 (2003); Lehtinen et al. Lehtinen2004 (2004), Lehtinen2007 (2007); Ridderstad et al. Ridderstad2006 (2006)). The variations are attributed to either grain growth (Ossenkopf & Henning ossenkopf1994 (1994), Krugel & Siebenmorgen Krugel1994 (1994)) or physical changes in the grain material itself (e.g., Mennella et al. Mennella1998 (1998), Boudet et al. Boudet2005 (2005)). Like temperature variations, changes in grain emissivity should be correlated with density and, therefore, might cause systematic errors in, for example, core mass spectra and the estimated structure of pre-stellar cores.
With deep NIR observations one can detect the surface brightness that is caused when dust grains scatter photons originating in the general interstellar radiation field. Both numerical modelling and first observational studies suggest that also the phenomenon can be used for quantitative study of cloud structure (Padoan et al. Padoan2006 (2006); Juvela et al. Juvela2006 (2006), Juvela2008 (2008); Nakajima et al. Nakajima2008 (2008)). The method works best when visual extinction is above a few magnitudes but below . The lower limit is set by what is observationally feasible and the upper limit by the saturation of the NIR signal at high optical depths. In the absence of strong local radiation sources, the reliability of the method appears to be comparable to the other methods listed above. However, because the surface brightness is observed in NIR, the obtained resolution is higher, potentially even of the order of one arc second.
We continue the study of the northern filament of the Corona Australis cloud. In previous paper Juvela et al. (Juvela2008 (2008)), we carried out comparison between two column density estimators, one based on observations of background stars and one on the scattered light. In this paper, we present new observations that extend the previous NIR mapping south of the Corona Australis filament. We have also mapped the region at 870 m using the Laboca instrument on the APEX telescope. The morphology of the sub-millimeter map is compared with FIR and NIR observations. With the aid of Spitzer 160 m data, we estimate the dust emissivity at 870 m. A three-dimensional radiative transfer model is used to study the effects of asymmetric illumination and the differences that may exist between the colour temperature estimates and the true dust temperature.
2 Observations
2.1 Near-infrared observations
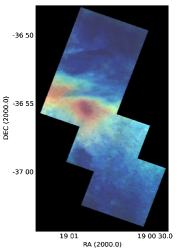
A composite image of the near-infrared J-, H-, and Ks-band data is shown in Fig. 1. The northern part of the field, some in size, was observed in August 2006 using the SOFI instrument on the NTT telescope. Those data cover the densest part of the filament and, in the north, extend to an area where the estimated visual extinction is . These observations were described in Juvela et al. Juvela2008 (2008).
Further SOFI observations were made in June 2007. The new data consist of two, partially overlapping fields. These extend the original mapping south of the centre of the filament. As previously, the observations were carried out as ON-OFF measurements so that the faint surface brightness could be recovered. Three OFF fields were selected based on IRAS images and 2MASS extinction maps from regions of low cirrus contamination. In order to minimize the effect of sky variations, observations of ON- and OFF-fields were interleaved in a sequence of OFF – ON-2 – ON-1 . The OFF-field was varied between observation blocks to average out any faint background gradients that might exist in the OFF-fields. Each observed frame was an average of six 5 second exposures, corresponding to an integration time of 30 seconds. After each sequence, the telescope returned to the OFF-position, and, at the end of the observation block, took six 5 second exposures of the OFF-field. The total integration times for each ON-field was 26 minutes in J, 37.5 minutes in H, and 97.5 minutes in Ks band (see Table 1). The observations were calibrated to 2MASS scale by using photometry of ten selected stars in each individual frame. Their average was used to correct the observed fluxes to above the atmosphere. The two ON-fields were mosaiced together using the overlapping area. To have the same signal in the overlapping area, this required an additional small correction to ON-1 frame. The overlapping area between the 2006 and 2007 observations, slightly more than in size, was used for the final adjustment of the new surface brightness measurements.
| Field | centre position | (J) | (H) | (Ks) | |
| (J2000) | (min) | (min) | (min) | (mag) | |
| ON-1 | , | 26 | 37.5 | 97.5 | – |
| ON-2 | , | 25.5 | 37.5 | 97.5 | – |
| OFF-1 | , | 11 | 16 | 35 | 0.45 |
| OFF-2 | , | 12 | 16 | 35 | 0.35 |
| OFF-3 | , | 5.5 | 8 | 35 | 0.33 |
2.2 Sub-millimeter and far-infrared data
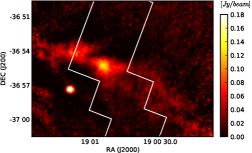
The Corona Australis filament was mapped with APEX/Laboca at 870 m. The first observations were carried out in November 2007. However, the weather conditions were not optimal and, additionally, some detector scans were affected by the bright R Corona Australis region that is located some 15 west of our NIR field. In the following, we rely mostly on data gathered in October 2008. Observations consisted of scans 30 in length. These were made mainly in the North-South direction, i.e., perpendicular to the filament. To improve sky noise suppression, the position angle of the scans was varied by up to 30 degrees. The precipitable water vapour content of the atmosphere was 1.2 mm. The observations were reduced using the Boa program, version 1.1111see http://www.astro.uni-bonn.de/boawiki. The atmospheric opacities derived from skydips using Boa are known to be underestimated. Following instructions on the official Laboca web-site, the opacities were scaled up by a factor 1.3.
During observations, Uranus, Neptune, and, as a secondary calibrator, IRAS16293, were observed at regular intervals. The final maps contain one bright millimeter point source, S Cr A, which gives possibility for another check of calibration. The source is a T Tauri star that corresponds to the submillimeter source MMS-7 observed by Nutter et al. (Nutter2005 (2005)) with the SCUBA instrument. At 850 m, their estimate of the source flux was 0.700.02 Jy/beam. Taking into account the difference in the beam size and in the wavelength, our estimate is higher by slightly less than 8%. The 870 m map is shown in Fig. 2.
The area has been mapped in Spitzer guaranteed time programs, at 3.6, 4.5, 5.8, and 8.0 m with the IRAC instrument and at 24, 70, and 160 m with the MIPS instrument. In this paper, we use only the longest wavelength, 160 m, to derive temperatures of the large dust grains that are responsible for the sub-mm signal. The shorter Spitzer wavelengths probe small grain and PAH populations. These should be included in a comprehensive model of the cloud but are not used here, because they are largely independent of the large grain population and, compared with the Laboca data, trace outer cloud layers.
3 Results
3.1 NIR observations
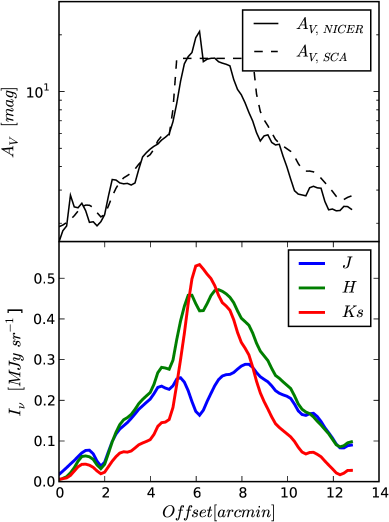
In paper I (Juvela et al. Juvela2008 (2008)), good agreement was found between estimates obtained from the reddening of background stars and from the surface brightness of scattered light. With the new observations, the comparison can be extended to the southern side of the filament. For the background stars, estimates were derived using the NICER method (Lombdardi & Alves. Lombardi2001 (2001)). The surface brightness was converted to using the same method and exactly the same parameters as in paper I. The extinction maps are shown in Fig. 3 while Figure 4 shows North-South profiles of the filament in and scattered surface brightness.
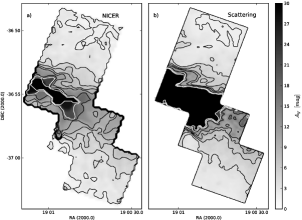
As concluded in paper I, on the northern side (offsets 0–5) the methods give very similar extinction values. Within the filament the surface brightness becomes gradually saturated (see Fig. 1) and the uncertainty of the estimates increases. Therefore, for the surface brightness data, predictions are shown only up to . Within the filament, the density of background stars decreases. This leads to bias also in the NICER estimates, as discussed in Paper I. Furthermore, in the region where the Ks-band surface brightness is completely saturated also no background stars are seen. Therefore, the true peak extinction can be higher than shown by the NICER values.
On the southern side, the surface brightness predicts 20-30% higher extinctions than the colour excesses of the background stars. Compared to the NICER extinction profile, especially in the J- and H-bands, the surface brightness is higher on the southern side of the filament (see Fig. 4, lower frame). This suggests that the intensity of the radiation field would be higher on the southern side of the filament. The conversion between scattered intensity and depends on assumptions of dust properties and the illuminating radiation field. In Paper I, the parameters were fixed using data north of the filament. Therefore, assuming identical dust properties, the difference in the estimates would indicate a similar percentual difference in the intensity of the NIR radiation field. In the K-band the asymmetry is smaller than in the other two bands. This suggests a change in the spectrum of the illuminating radiation although the NIR colour ratio might also be affected by observational uncertainties.
Both the new NIR observations and the existing far-infrared data (see Sect. 3.2) indicate that the intensity of the radiation field increases towards south. In paper I an opposite conclusion was reached on the basis of NIR colours close to the dip in the Ks-band intensity. The intensity ratio J/Ks was found to be higher in the northern part of the dip which, because the cloud is more transparent for Ks-band radiation, would seem to be consistent with most of the illumination coming from that direction. However, the situation may be more complicated and the outcome depends on whether the observed local minimum of K-band surface brightness exactly coincides with the extinction maximum or is shifted away from the direction of stronger illumination. We return to this question in Sect. 4 where we examine the situation with the help of a radiative transfer model.
3.2 Comparison of NIR, far-infrared, and sub-mm emission
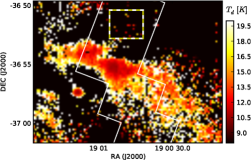
Figure 5 compares the morphology of Cr A filament as seen at different wavelengths. The colour image shows the Ks-band surface brightness that should be well correlated with the true column density up to but which, within the filament, becomes saturated and exhibits a dip at the centre of the filament. In addition to the NIR data, the figure shows Spitzer 160 observations and our Laboca observations at 870 m.
The sub-mm dust emission shows very good correlation with the morphology of NIR emission. At the location of 870 m maximum, the NIR signal is saturated but, based on the ratio of J, H, and Ks intensities, this was already concluded to be the position of the highest column density (Juvela et al. Juvela2008 (2008)). In other words, the dip in the Ks-band image pinpointed the location where the sub-mm emission was going to peak.
In Sect. 3.1 we concluded that the radiation field is stronger on the southern side of the filament. In Fig. 5 the 870 m emission is displaced by some 10 south-east of the Ks-band dip. This is consistent with the idea of asymmetric illumination: if the dip in NIR surface brightness is shifted away from the direction of stronger radiation, the sub-mm peak should similarly be shifted slightly towards the stronger radiation. In Fig. 5 the asymmetry points towards the nearby T Tauri star S Cr A as the cause of these shifts. However, at 160 m the emission is very extended on the souther side of the filament. This reflects also the mass distribution that is asymmetric with respect to the densest part of the filament. In the 160 m emission, the peak is directly south of the sub-mm peak, not towards the star S Cr A. At shorter wavelengths, the 100 m surface brightness rises from 20 MJy sr-1 in the northern part of our NIR field to 41 MJy sr-1 in the filament. However, south of the dense filament, the surface brightness stays above 35 MJy sr-1. In the Spitzer 70 m maps, the surface brightness rises as one moves southwards across the filament, without clear correlation with the position of S Cr A.

3.3 Dust colour temperature in the Corona Australis filament
The colour temperature of large grains was estimated using the 160 m Spitzer MIPS map and our APEX/Laboca 870 m observations. The values are based on the assumption of a single gray body spectrum, . Unfortunately, the value of the spectral index is uncertain (e.g., Dupac et al. Dupac2003 (2003)) and, because dust properties may exhibit variations that are correlated with density and temperature, may have significant variations even within a single cloud. There is also indication that the spectral index is wavelength dependent and that, compared to sub-mm and millimetre wavelengths, the variation of is stronger in the FIR regime. With the available data, we cannot study these variations in detail. The colour temperature map obtained for a fixed value of is shown in Fig. 6. The figure also indicates the area that was used for the determination of the intensity zero level at the two wavelengths.
In the reduced 870 m map, only the densest filament is visible. On both sides, the intensity first becomes slightly negative before again raising towards north and south. This suggests that, in the data reduction, the baseline subtraction was not perfect. However, the overshoot to negative values is only 5% of the peak intensity and, for the colour temperature calculation, the zero level is determined from an area where the surface brightness reaches minimum (see Fig. 6). Therefore, the uncertainty in the baseline subtraction translates to an uncertainty in colour temperature that is only 0.1 K for the sub-mm peak but can be close to one degree in areas of lower intensity where the colour temperature is close to 15 K. A related source of uncertainty results from the fact that, in the 870 m map, some of the large scale structure may have been filtered out.
In the filament, the colour temperature is reduced to 10.7 K. In this value, the uncertain value of is a larger source of uncertainty than the observational errors. Varying in the plausible range from 2.5 to 1.5 would change the minimum colour temperature between 9.5 and 12.4 K. A change =0.5 corresponds to a change by a factor of 2.7 in the relative dust opacity at 160 m and 870 m. Because of temperature variations along the line-of-sight, the colour temperature is likely to overestimate the mass-weighted true dust temperature. This bias is examined further in Sect. 4, in connection with a radiative transfer model.
3.4 Sub-mm dust emissivity
Using the derived colour temperatures and the surface brightness , the dust emissivity at 870 m, relative to visual extinction, can be calculated differentially,
| (1) |
This assumes that dust emissivity remains constant over the whole area. Figure 7 shows the correlation between and visual extinction. To lower the noise of , we use weighted average of the maps shown Fig. 3. At low , equal weight is given to the two maps but, by , the values are based on NICER method alone. The slope of the linear fit gives a value . However, the slope steepens towards the filament and, for , one obtains emissivity that is twice as high, .
Emissivity can also be estimated directly on the basis of absolute values. As above, the values are low outside the sub-millimeter peak but increase to at the location of the surface brightness maximum. In this case, the zero level of surface brightness values was estimated north of the filament, around declination -3653.
There is a temptation to interpret the spatial variations as an indication of increase of dust sub-mm emissivity towards the densest parts of filament. However, the 870 m surface brightness is detected only close to the actual sub-mm peak and the emissivities, obtained either from correlation or absolute surface brightness, are uncertain outside this region. Furthermore, in the 870 m map, some of the large scale structure may have been filtered out. This could account for the lower value obtained given by the absolute surface brightness values and could contribute to the decrease seen outside the surface brightness maximum. Therefore, considering both the S/N ratio and the possible filtering out of large scales, the values obtained at the very centre of the filament should be the most reliable ones.
The emissivities were calculated using the 160 m/870 m colour temperature which may overestimate the true dust temperature if there are strong temperature variations along the line-of-sight. In Sect. 4 we will examine, whether this could lead to underestimation of . In paper I, we concluded that, extinction within the filament may be underestimated because of the steep extinction gradients. The bias, which was estimated to be 25% at , would cause to be overestimated, probably by a similar factor. We quote emissivities relative to visual extinction. In the NICER method, the conversion to was done assuming a standard extinction curve that corresponds to =3.1. Although it is probable that increases towards the dense filament, the effect on is only of the order of one percent, i.e., negligible compared with the other sources of uncertainty.
Because of the various sources of uncertainty, we can only conclude that, at the centre of the Cr A filament, the dust emissivity is likely to be at least but could easily be higher by 50%. Relying on the values obtained at the centre of the filament and taking into account the various biases, we write our estimate as . The quoted uncertainty is, of course, only approximative.

4 Toy model of the filament
A toy model of the Cr A filament was used to examine two questions, the effect of asymmetric illumination on the observed NIR surface brightness and the bias of the dust colour temperature used in the derivation of sub-mm dust emissivity. The model consists of a cylinder, representing the large-scale filament, and a denser spherical region in the centre, representing the observed sub-mm peak. The density follows gaussian profile, both with respect to distance from the axis of the cylinder and from the centre of the spherical component. The extinction is 10m across the cylinder and reaches through the centre, i.e., through the combined density peak of the cylinder and the sphere. The model was resampled onto a cartesian grid of 653 cells.
The dust properties are taken from Draine (Draine2003 (2003)). The scattering was calculating using the tabulated phase function available on the web 222http://www.astro.princeton.edu/draine/dust/, assuming the dust model corresponding to . For radiative transfer calculations, we use our Monte Carlo programs (Juvela & Padoan Juvela2003 (2003); Juvela Juvela2005 (2005)).
4.1 Correlation of NIR surface brightness
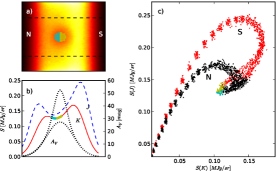
In Paper I the spatial variations in the NIR intensity ratios were examined and several regions were identified that exhibited a particular combination of surface brightnesses. Using the toy model, we re-examine the interpretation of the regions and that were shown in Fig. 4 of that paper.
Figure 8 shows the correlation between J- and K-band surface brightness in the toy model. The model cloud is illuminated by an isotropic radiation field that corresponds to the NIR ISRF given in Lehtinen et al. (Lehtinen1996 (1996)). Additionally, in the south (as marked in the figure) there is an additional radiation source with similar spectrum that raises the total intensity by 30%. This introduces asymmetry that is clearly visible as northern and southern branches in the correlation plotted in Fig. 8c.
Figure 8c can now be compared qualitatively with Fig. 4 of paper I. The regions and are clearly consistent with asymmetric illumination with stronger radiation in the south. More specifically, the asymmetry suggests that the additional radiation is coming from south-east.
For regions and the correspondence with the toy model is less clear. In the model, the northern and southern branches (as marked in Fig. 8c) cross each other before the location of peak extinction is reached. Therefore, the intensity ratio J/K should be higher on that side of the peak where the radiation is stronger. If regions and are interpreted as the tip of the two branches, they would perfectly match a case where radiation comes mainly from the north rather than from the south. Because other evidence clearly shows that this is not the case, the final interpretation of the NIR colours at the centre of the filament remains open. Smaller scale density structures (e.g., structures extending in front of the main cloud) could provide one possible explanation.
In the model the southern radiation source extended 10 from the southern direction. Figure 8 remains qualitative similar even if the opening angle is as large as 45. Similarly, a clear loop that is formed in Fig. 8c) when the southern and northern branches cross, persists even when the radiation source is moved from the south towards the front or back of the cloud. However, the the separation of the two branches is much smaller if the source is moved towards the front of the cloud. If the source is moved towards the back of the cloud, the peak surface brightness increases but the intensity at the centre of the cloud decreases, both by up to 20%. These effects suggest that, with more detailed modelling of observations, further constraints may still be derived for the radiation field.
4.2 Colour temperatures from the toy model
The determination of sub-mm emissivity can be affected by errors in the estimated dust temperature. In particular, when there are temperature variations along the line-of-sight, the observed colour temperature is known to be biased towards higher temperatures (e.g. Lehtinen et al. Lehtinen2007 (2007)). We use the toy model to estimate the magnitude of this bias. We use exactly the same model as above, i.e., including the additional radiation source in the south that increases the total illumination by 30%.
Figure 9 shows a map of colour temperatures that is calculated from modelled surface brightness at 160 m and 870 m. A value of is used for the emissivity index. This is very close to the spectral index of the employed dust model, which is 1.96 between the two frequencies. Frame shows the difference between the observed colour temperature and the mass-weighted average temperature along each line-of-sight. As expected, the colour temperature overestimates the true mean temperature of dust grains. The error increases with opacity and is just over 2 K at the centre of the cloud.
Because the dust emission is optically thin, the ratio of the true column density and the column density estimated on the basis of the colour temperature can be calculated from
| (2) |
Here is dust temperature, colour temperature, and distance along the line-of-sight. Figure 9 shows this ratio as function of observed colour temperature. At the cloud centre, the true column density is more than 50% higher than what is estimated on the basis of colour temperature. This suggests that the value of derived in Sect 3.4 could be underestimated although not necessarily by the same amount.
To estimate the effect on , we scaled the 870m surface brightness values upwards according to the relation of Fig. 9. If the Cr A filament behaves as our model, the scaled surface brightness should correspond to a situation where all dust along a line-of-sight has temperature equal to the colour temperature. Repeating the analysis of Sect. 3.4, values of increase less than 10% in the fit to all data and 20% in the fit to data above . The increase in the peak value of Fig. 7 is similarly 20%. While noticeable, the bias caused by the use of colour temperatures may be compensated by the opposite bias in values. Therefore, the value derived in Sect. 3.4, , remains our best estimates.

5 Discussion
The IRAS and Spitzer far-infrared observations demonstrate an asymmetry where the intensity of the radiation field and/or the extent of diffuse material is larger south of the Corona Australis filament. Our extinction measurements show that the extinction is reduced below within 5 of the filament, both in the North and in the South. The column densities are slightly larger in the south but NIR and far-infrared colours indicate that the asymmetry is mainly caused by the illumination of the cloud. Our toy model (Fig. 8) showed that, at large scales, the NIR colour variations are consistent with this interpretation. In the model, the radiation field was increased by 30% by adding one radiation source in the south but this resulted in larger NIR colour variations than what was observed. Either the asymmetry is, at NIR wavelengths, less strong or the radiation comes from a much large solid angle or from a direction that deviates significantly from the exact southern direction.
Stars S Cr A and HD 176269 lie a few arc minutes south-east of the filament. HD 176269 is a pre-main sequence B9V star which, according to the HIPPARCOS parallax, is at the distance of Corona Australis, pc. In Digital Sky Survey Blue map, there is a reflection nebula around the star. The 2MASS magnitudes of the star are 6.7, 6.8 and for the J, H and Ks bands, respectively. Assuming the intervening extinction is similar to the extinction between Cr A and us and taking into account the projected distance between the star and the outskirts of the filament, , the star could produce an additional intensity that is in J-band (H-band, Ks-band). This would add a significant, bluer component to the ISRF.
The 70 surface brightness shows a clear surface brightness gradient across the filament and brightening towards the south. This supports the assumption that the additional illumination comes directly from the south, rather than in more towards the front or back of the filament. In the south, the ratio of the J- and H-bands to the Ks-band decrease from east to west, this also being consistent with bluer illumination from the star HD 176269. S Cr A is located much closer to the dense part of the filament, but its spectrum is redder and would not explain the different colour of scattered light further south of the filament. The IRIS 100 map implies that the influence of S Cr A to the heating of dust is restricted to its immediate surroundings but it could have a contribution to the NIR flux impinging on the filament.
In paper I we correlated NIR surface brightness with the extinction derived on the basis of the colour excesses of background stars. We concluded that the diffuse signal consists mainly of scattered light and it can be used for quantitative study of cloud structure. Unless the method is calibrated using colour excess data (see Juvela et al. Juvela2008 (2008); Nakajima et al. Nakajima2008 (2008)), the conversion to column density requires assumptions of the radiation field and dust properties. The method should remain reliable as long as the radiation field is roughly constant within the examined region. In the Cr A field, this condition is clearly not fulfilled because of the high opacity of the central filament and the asymmetry of the illuminating radiation. In the south, assuming similar conditions as on the northern side of the filament, the column density derived from NIR surface brightness is overestimated by 20% (see Fig. 4a). However, the results from the surface brightness data can always be corrected with the aid of colour excess measurements. This can be done at any scale down to the resolution allowed by the spatial density of background stars. Compared to the use of background stars only, this should result in a more accurate column density measurements and, as far as allowed by the observational noise of surface brightness data, extension to smaller spatial scales.
Our estimate for the 870 m emissivity was per magnitude of visual extinction. In the dust models employed in our toy model, the 870 m dust extinction cross sections are very similar, for and for . In this respect, the models are consistent with the actual filament.
Sub-mm data obtained from PRONAOS experiment favours dust spectral index values close to (e.g., Bernard et al. Bernard1999 (1999); Stepnik et al. Stepnik2003 (2003)). The spectral index is, however, temperature dependent and rises to 2 only when temperatures is below 20 K (Dupac et al. Dupac2003 (2003)). There is some scatter in the values and, even at low temperatures, the spectral index may vary within a wide range from 1.5 to 2.5. The determination of the spectral index is, of course, closely related to the dust emissivity. As mentioned in Sect. 3.3, varying the value of in the range from 1.5 to 2.5 will cause the minimum temperature to vary between 9.5 and 12.4 K. In the value of , this corresponds to an uncertainty of 30%. If sub-millimetre emissivity had shown significant increase, the true spectral index would probably have been smaller than assumed. By overestimating , the dust temperature would have been underestimated and the obtained value of would have been even higher than the true value.
The obtained value of is similar to the values that have been obtained in low density regions. Using COBE data, Boulanger et al. (Boulanger1996 (1996)) derived effective dust cross section for dust in high latitude diffuse medium,
| (3) |
Using a conversion factor cm-2 mag-1 (Bohlin et al. Bohlin78 (1978)), equally valid for diffuse regions, this corresponds to mag-1.
In the literature, higher emissivities are often reported for dense and cold clouds. Stepnik et al. (Stepnik2003 (2003)) studied a filament in Taurus. According to star counts, the extinction was at least at the resolution of . However, using 2MASS H-K colours, Padoan et al. (Padoan2002 (2002)) estimated the peak extinction to be 12m. Based on PRONAOS observations, Stepnik et al. concluded that the sub-mm emissivity of big grains had increased by a factor of 3.4 within the filament. At shorter wavelengths, Lehtinen et al. (Lehtinen2007 (2007)) reported a similar trend in the cloud L1642. The ratio of 200 m optical depth and visual extinction increased by a factor of four when moving from regions with K to dense regions with K. Kramer et al. (Kramer2003 (2003)) estimated variations of 850 m emissivity in dark cloud IC 5146. The emissivity was found to change from in warm regions to in colder regions with K. On the other hand, in their study of another Taurus filament, Nutter et al. (Nutter2008 (2008)) found no such strong variations. The observations, including Spitzer 70 m and 160 m and SCUBA 450 m and 850 m data, could all be modelled accurately without resorting to any spatial variations of dust properties. The filament was similar to our Cr A field and had higher extinction than the region studied by Stepnik et al. Stepnik2003 (2003).
In our 870 m observations of the Cr A filament, part of large scale structures may have been filtered out and this could lead to underestimation of dust emissivity. However, this should not have a large effect at the short spatial scales used in Sect. 3.4. Our observations suggest that the emissivity in the Corona Australis filament is similar to the values of diffuse medium. In spite of several sources of uncertainty, it is very unlikely that the emissivity could be even twice as high. This is not necessarily in strong contradiction with the results of Stepnik et al. (Stepnik2003 (2003)) because our is an effective value for the whole line-of-sight. In the case of Stepnik et al., the emissivity of large grains was increased by a factor 3.4 only at the centre of their radiative transfer model. Although the observed value of should be dominated by this densest region, the effective value for the whole line-of-sight should still be somewhat lower. However, the studied CrA filament appears to be clearly different from the dense cores of IC 5146. In the study of Kramer et al. (Kramer2003 (2003)), was above everywhere the dust colour temperature (based on 450m and 850 m observations) was below 14 K. These results indicate that the changes in sub-mm emissivity are not a universal function of density or temperature.
In a future paper, we will construct a three-dimensional radiative transfer model for the Cr A filament. Varying the density distribution, radiation field, and dust properties, we will seek for a solution that would be consistent with observations from NIR to sub-mm.
6 Conclusions
We have complemented our previous NIR observations of the northern filament of the Corona Australis molecular cloud. The dust extinction and NIR scattering are now mapped both north and south of the filament. The observations, together with existing far-infrared data, show that the illuminating radiation field becomes stronger in the south.
The area was mapped at 870 m using the APEX Laboca instrument. With the help of Spitzer 160 m maps, we estimate dust colour temperatures which, within the central filament, decreases down to K. On the basis of the colour temperatures, the dust emissivity at 870 m is estimated to be as a value relative to . In spite of the high visual extinction, the estimate is close to the values found in diffuse regions.
A three-dimensional toy model of the filament was presented. The model demonstrates that the main NIR colour variations described in paper I can be explained as a result of anisotropic illumination. The differences between observed colour temperatures and mass-averaged true temperatures of large dust grains were examined using the same model. The use of colour temperatures will lead to underestimation of values but the effect is no more than 25%. In the case of the Corona Australis filament, this could be compensated by an opposite bias in the estimates.
Acknowledgements.
We thank the referee, Laurent Cambrésy, for helpful comments. M.J. and V.-M.P. acknowledge the support of the Academy of Finland Grants no. 206049, 115056, and 107701.References
- (1) Cambrésy, L., Boulanger, F., Lagache, G., Stepnik, B., 2001, A&A 375, 999
- (2) Bernard, J.-P., Abergel, A., Ristorcelli, I., et al., 1999, A&A 347, 640
- (3) Bohlin R.C., Savage B.D., Drake J.F., 1978, ApJ 224, 132
- (4) Boudet, N., Mutschke, H., Nayral, C., et al., 2005, ApJ 633, 272
- (5) Boulanger, F., Abergel, A., Bernard J.-P., et al., 1996, A&A 312, 256
- (6) Cardelli, J.A., Clayton, G.C., Mathis, J.S., 1989, ApJ 345, 245
- (7) Carmona, A., van den Ancker, M.E., Henning, Th., 2007, A&A 464, 687
- (8) Crapsi, A., Caselli, P., Walmsley, C.M., Tafalla, M. 2007, A&A 470, 221
- (9) Cutri R.M., Skrutskie M.F., van Dyk, S. et al., 2003, The IRSA 2MASS All-Sky Point Source Catalog, NASA/IPAC Infrared Science Archive, http://irsa.ipac.caltech.edu/applications/Gator/
- (10) Dupac, X., Bernard, J.-P., Boudet, N. et al., 2003, A&A 404, L11
- (11) Draine, B., 2003, ApJ 598, 1017
- (12) Harju J., Juvela M., Schlemmer S., et al., 2008, A&A 482, 535
- (13) Joy, A.H., 1945, ApJ, 102, 168
- (14) Juvela, M., 1998, A&A 338, 723
- (15) Juvela, M., 2005, A&A, 440, 531
- (16) Juvela, M., Padoan, P., 2003, A&A 397, 201
- (17) Juvela, M., Pelkonen, V.-M., Padoan, P., 2006, A&A 457, 877
- (18) Juvela, M., Pelkonen, V.-M., Padoan, P., Mattila, K., 2008, A&A 480, 445
- (19) del Burgo, C., Laureijs, R.J., Ábrahám, P & Kiss, Cs., 2003, MNRAS 346, 403
- (20) Kramer, C., Richer, J., Mookerjea, B., Alves J., Lada C. et al., 2003, A&A 399, 1073
- (21) Krugel, E., Siebenmorgen, R., 1994, A&A 288, 929
- (22) Lehtinen, K., Juvela, M., Mattila, K., Lemke, D., Russeil, D., 2007, A&A 466, 969
- (23) Lehtinen, K., Mattila, K., 1996, A&A 309, 570
- (24) Lehtinen, K., Russeil, D., Juvela, M., Mattila, K., Lemke, D., 2004, A&A 423, 975
- (25) Lombardi, M. & Alves, J., 2001, A&A 377, 1023
- (26) Lombardi, M., 2009, A&A 493, 735
- (27) Mennella, V., Brucato, J.R., Colangeli, L. et al., 1998, ApJ 496, 1058
- (28) Nakajima, Y., Nagata, T., Sato, S., et al., 2003, AJ125, 1407
- (29) Nakajima, Y., Kandori, R., Tamura, et al., 2008, PASJ 60, 731
- (30) Nutter, D., Ward-Thompson, D., André, P., 2005, MNRAS 357, 975
- (31) Nutter, D., Kirk, J.M., Stamatellos, D., Ward-Thompson, D., 2008, MNRAS 384, 755
- (32) Ossenkopf, V., Henning, T., 1994, A&A 291, 943
- (33) Padoan P., Cambrésy L., Langer W., 2002, ApJ 580, L57
- (34) Padoan, P., Juvela M., Pelkonen V.-M. 2006, ApJ 636, L101
- (35) Ridderstad M., Juvela M., Lehtinen K., Lemke D., Liljeström T., 2006, A&A 451, 961
- (36) Schlegel D., Finkbeiner D., Davis M. 1998 ApJ 500, 525
- (37) Stepnik, B., Abergel, A., Bernard, J.-P. et al., 2003, A&A 398, 551
- (38) Stamatellos, D., Whitworth, A.P., Ward-Thompson, D., 2007, MNRAS 379, 1390