Quiet but still bright: \xmm observations of the soft gamma-ray repeater \src††thanks: Based on observations obtained with XMM-Newton, an ESA science mission with instruments and contributions directly funded by ESA Member States and NASA.
Abstract
SGR 0526–66 was the first soft gamma-ray repeater (SGR) from which a giant flare was detected in March 1979, suggesting the existence of magnetars, i.e. neutron stars powered by the decay of their extremely strong magnetic field. Since then, very little information has been obtained on this object, mainly because it has been burst-inactive since 1983 and the study of its persistent X–ray emission has been hampered by its large distance and its location in a X–ray bright supernova remnant in the Large Magellanic Cloud. Here we report on a comprehensive analysis of all the available XMM-Newton observations of SGR 0526–66. In particular, thanks to a deep observation taken in 2007, we measured its pulsation period ( s) 6 years after its latest detection by Chandra. This allowed us to detect for the first time a significant reduction of its spin-down rate. From a comparison with two shorter XMM-Newton observations performed in 2000 and 2001, we found no significant changes in the spectrum, which is well modelled by an absorbed power-law with = 4.6 cm-2 and =3.27. The high luminosity (41035 erg s-1, in the 1–10 keV energy band) still observed 25 years after the latest detection of bursting activity places SGR 0526–66 in the group of bright and persistent magnetar candidates.
keywords:
ISM: individual: N49 – stars: neutron – supernova remnants – X-rays: individual: SGR 0526–66 – X-rays: stars.1 Introduction
On 1979 March 5, an extremely bright gamma-ray burst (GRB), followed by a 60 s long tail pulsating at a period of s, was detected by many spacecrafts (Mazets et al., 1979). The event was localized within the young (5,000–10,000 years old) supernova remnant (SNR) LHA 120–N49 (N49) in the Large Magellanic Cloud (LMC; Cline et al. 1982). These properties indicated that the burst was emitted by a young neutron star, leading Duncan & Thompson (1992) and Paczynski (1992) to propose the existence of neutron stars with magnetic fields of 1015 G, that were called magnetars. The detection of many weaker bursts from the same direction in the following 4 years indicated that the March 5 event was not a typical GRB, but an exceptional outburst from a small class of sources which had been just discovered and called soft gamma-ray repeaters (SGRs). Indeed the 1979 March 5 event from SGR 0526–66 was the first “giant flare” observed from a SGR. Only two other such events have been observed in the following years, each one from a different SGR (Hurley et al., 1999, 2005).
Up to now, only six SGRs have been discovered (plus a few candidates). They are characterised by the emission of short bursts of gamma-rays during sporadic periods of activity. In addition, they are also observed as pulsating X-ray sources with periods in the 2–9 s range and persistent luminosities up to erg s-1. The magnetar model was developed to explain both their bursting and persistent emission (Thompson & Duncan, 1995) and later extended (Thompson & Duncan, 1996) to the interpretation of the anomalous X-ray pulsars (AXPs). These are a group of 9 X-ray sources (plus some candidates) with similar properties to those of the SGRs (see Mereghetti 2008 for a review).
The persistent X-ray emission from SGR 0526–66 was first detected with ROSAT (Rothschild et al., 1994) and then observed by Chandra in 2000 and 2001 (Kulkarni et al., 2003; Park et al., 2003), with a constant X-ray luminosity of erg s-1 (unabsorbed, in the 0.5–10 keV energy range). Being SGR 0526–66 a rather faint X–ray source, the pulsation of its persistent emission was detected only in the two Chandra observations carried out in 2000 and 2001 (Kulkarni et al., 2003). The periods measured with Chandra are compatible with the 8 s period detected in the pulsating tail of the 1979 giant flare and give a spin-down rate of s s-1, a value in the same range as that of the other magnetar candidates.
In order to measure again the pulsation period and search for long-term flux and spectral changes, we obtained a 70 ks long observation of SGR 0526–66 with XMM-Newton, 6 years after the latest X-ray observation. In the following we report on the results of this recent observation, together with the analysis of two short archival XMM-Newton observations performed in 2000 and 2001.
2 Observations and data analysis
SGR 0526–66 was observed by XMM-Newton on 2007 November 10 for about 70 ks. The field containing SGR 0526–66 had already been observed by XMM-Newton, with shorter exposure times, on 2000 July 8 and on 2001 April 8. In the 2000 observation SGR 0526–66 was 6′ off-axis, while in the other observations it was on-axis. We concentrate here on the analysis of the data collected with the EPIC instrument, which is composed by a PN (Strüder et al., 2001) and two MOS X-ray cameras (Turner et al., 2001), sensitive in the 0.2–15 keV energy range. Details on the instrument settings (optical blocking filter and operating mode) for each observation are listed in Table 1. For the longest observation we used also the data collected by the Reflection Grating Spectrometer (RGS, den Herder et al. 2001), which worked in parallel to the EPIC instrument and had a net exposure time of 71 ks for each of its two units (RGS1 and RGS2). This high resolution spectrometer is sensitive in the 0.35–2.5 keV energy range.
All the data were processed using the XMM-Newton Science Analysis
Software (sas version 8.0.0) and the calibration files
released in August 2007. The standard pattern selection criteria for
the EPIC X–ray events (patterns 0–4 for PN and 0–12 for MOS) were
adopted. The RGS analysis followed the standard selection criteria
as well.111See
http://xmm.esac.esa.int/external/xmm_user_support/documentation/sas_usg/USG/
Response matrices and ancillary files for each spectrum were
produced using the sas software package and the spectra
were fitted using xspec version 11.3.1. All errors reported
in the following analysis are at 1 .
| Obs. | Date | Instrument | Modea | Filter | Net exposure |
|---|---|---|---|---|---|
| Ab | 2000-07-08 | PN | FF | medium | 4.3 ks |
| MOS1 | FF | medium | 8.4 ks | ||
| MOS2 | FF | medium | 8.5 ks | ||
| B | 2001-04-08 | PN | FF | medium | 6.7 ks |
| MOS1 | FF | thick | 4.6 ks | ||
| MOS2 | FF | medium | 12.6 ks | ||
| PN | SW | medium | 5.8 ks | ||
| MOS1 | FF | medium | 12.1 ks | ||
| C | 2007-11-10 | PN | LW | thick | 60.3 ks |
| MOS1 | SW | thick | 69.7 ks | ||
| MOS2 | SW | thick | 69.7 ks |
-
a
The time resolution of the operating modes are: PN Full Frame (FF): 73 ms; PN Large Window (LW): 48 ms; PN Small Window (SW): 6 ms; MOS Full Frame (FF): 2.6 s; MOS Small Window (SW): 0.3 s.
-
b
6′ off-axis.
2.1 Spectral analysis
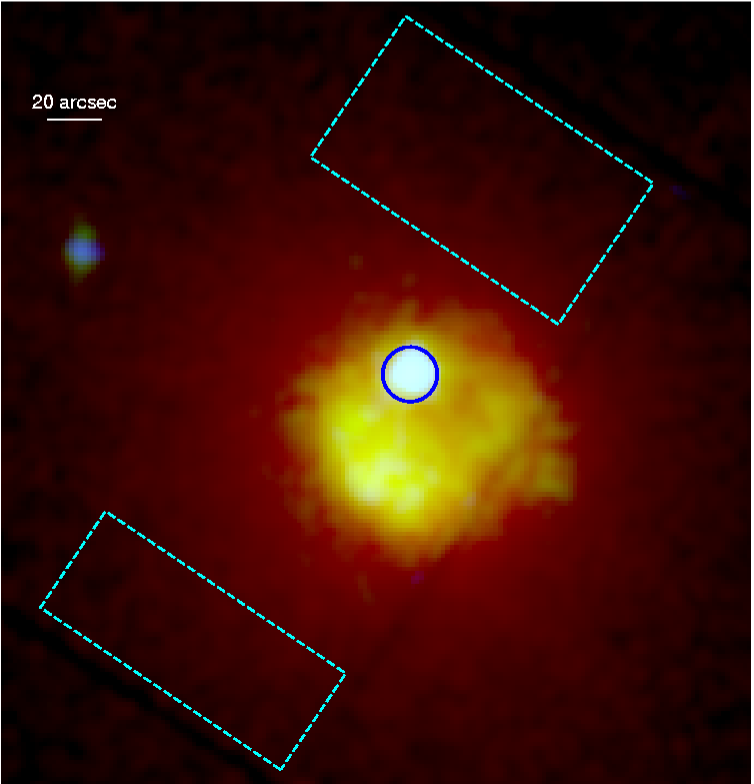
The spectral analysis of SGR 0526–66 with XMM-Newton is complicated by the location of this source within the bright SNR N49, whose spatial extent (40′′ radius) is only slightly larger than the instrumental point-spread function (the 90% encircled energy fraction for a point source is 40′′). Rather than attempting to subtract the SNR contribution as a background component, we included it in the fits with a free normalization and a fixed spectral shape determined as explained below. To reduce the contamination from the soft X-ray emission of N49, we extracted the SGR EPIC spectrum in the 1–10 keV energy range from a circle of 10′′ radius (this includes 60% of the point source counts at 5 keV). The background spectrum was extracted from a region outside the SNR, but in the same CCD as the SGR (see Figure 1).
To model the soft and line-rich spectrum of the SNR, we took advantage of the high-resolution spectra collected by the RGS instrument during the longest observation. We extracted the first order spectra from the standard region normally used for point sources, setting the centre of the SNR as source position (such a selection includes most of the photons detected from the SNR, thanks to its relatively small extension). The RGS spectral analysis was restricted to the 1–2 keV energy range. To model the SNR above 2 keV, we extracted a 1–10 keV PN spectrum from a 40′′ circle centred in the middle of the SNR and fitted it together with the spectra of the two RGS units. Based on the results of previous X–ray observations of N49 (Park et al., 2003; Bilikova et al., 2007), we used a model consisting of the sum of two plane-parallel shock components at different temperatures (vpshock in xspec) both corrected for photoelectric absorption (phabs in xspec). To this we added an absorbed power-law to account for the emission from SGR 0526–66. Its parameters were fixed at the best-fit values found with Chandra : 5.61021 cm-2, =3.06, norm=1.1810-3 s-1 cm-2 keV-1 at 1 keV (Kulkarni et al., 2003). An overall normalization factor for each spectrum was also included to account for the cross-calibration uncertainties between the two RGS and the EPIC PN. A satisfactory fit (=2170/935 degrees of freedom, d.o.f.)222Although this fit is not statistically acceptable, a detailed modelling of the SNR emission is beyond the scope of this paper and so we did not adopt more complex spectral models. was obtained with the following parameters: =(1.30.3)1021 cm-2, =0.577 keV, =5.41012 s cm-3, =1.100.01 keV, 31013 s cm-3, Ne/Ne⊙=0.660.02, Mg/Mg⊙=0.590.01, Si/Si⊙=0.790.01, S/S⊙=1.000.04, Ca/Ca⊙=0.60.4, Fe/Fe⊙=0.450.02. The abundances of the other elements are fixed to the Solar values (Anders & Grevesse, 1989). These parameters are in good agreement with previous studies of this SNR (Park et al., 2003; Bilikova et al., 2007). The unabsorbed flux in the 1–10 keV energy is 7.110-12 erg cm-2 s-1for the SNR and 1.610-12 erg cm-2 s-1 for the SGR.
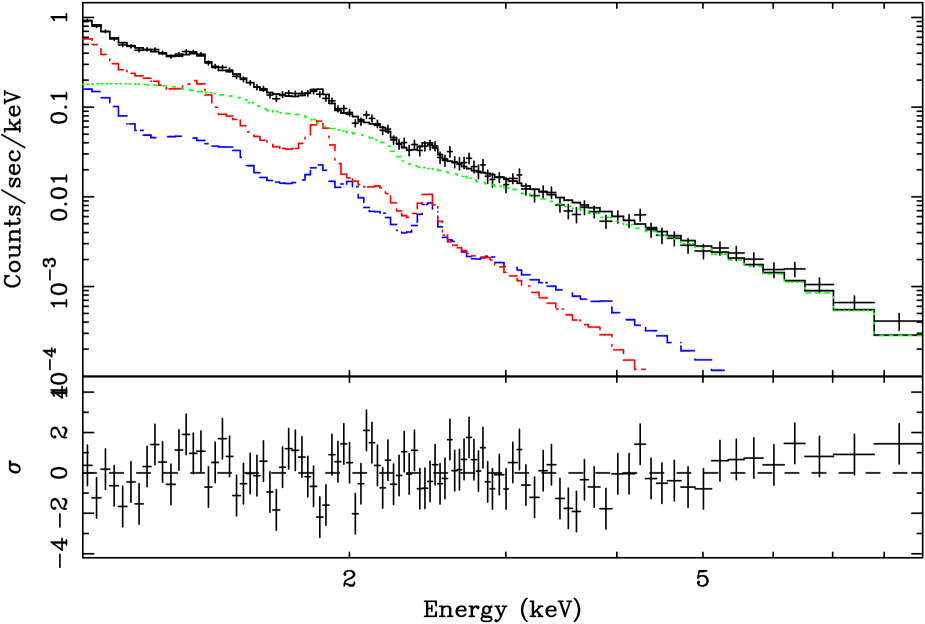
We then fitted the EPIC spectra extracted from the small region around SGR 0526–66 with an absorbed power-law333More complex spectral models, which are usually used to fit magnetar spectra, were not adopted in this case due to the uncertainty of the background subtraction. plus the model of the SNR described above. All the SNR model parameters were fixed at their best-fit values, except for the normalization, in order to properly account for the unknown intensity of the SNR emission in the source extraction region.444We also applied a second normalization factor to both the SNR and the SGR models to account for the cross-calibration uncertainties between the EPIC cameras; the maximum flux discrepancy we find between the EPIC cameras is lower than 15%. A good fit ( d.o.f., see Figure 2) is obtained with a hydrogen column density = (4.6) cm-2 and a photon index =3.27. The lack of systematic residuals in correspondence with the SNR brightest spectral lines (see Figure 2) indicates that the SNR contamination is sufficiently well modelled. The 1–10 keV (unabsorbed) flux of the power-law component is (1.2510-12 erg cm-2 s-1. This corresponds to a luminosity of 4.31035 erg s-1 for a distance of 55 kpc.
Since no time variability is expected in the SNR contribution we can fit the SGR spectra of the older EPIC observations with the model described above, keeping the SNR model normalization fixed at the value obtained in the longest observation. The best-fit parameters for an absorbed power-law model are reported in Table 2. No spectral variability is detected and significant (3) flux variations larger than 50% among the different XMM-Newton observations can be excluded.
| Observation | SNR norm.a | Fluxb | (d.o.f.) | ||
|---|---|---|---|---|---|
| (1021 cm-2) | (10-12 erg cm-2 s-1) | ||||
| A | 0.117 (fixed) | 3.8 | 3.1 | 1.3 | 1.04 (65) |
| B | 0.117 (fixed) | 5.3 | 3.3 | 1.30.1 | 0.88 (166) |
| C | 0.117 | 4.6 | 3.27 | 1.25 | 1.18 (233) |
-
a
Normalization factor applied to the best-fit model of the RGS and PN spectrum of the whole SNR.
-
b
Unabsorbed flux in the 1–10 keV range.
2.2 Timing analysis
For the timing analysis the photon arrival times were converted to
the solar system barycenter with the barycen sas
task.
We used the same extraction region adopted for the spectra, but we
performed the analysis in the 0.65–12 keV energy band to
optimize the signal to noise ratio.
The pulse periods measured with Chandra using the test were
8.0436(2) s on 2000 January 4 and 8.0470(2) s on 2001 August 31
(Kulkarni et al., 2003).
We searched for pulsations in the period range 8.0464–8.2423 s,
selected by considering the 3 lower limit on the most recent
spin period value reported by Kulkarni et al. (2003) and extrapolating
to the epoch of the XMM-Newton observation under the assumption of a
(conservative) period derivative of s
s-1. In Figure 3 we show the periodogram
obtained by using the combined events from the PN and MOS cameras.
Taking into account the number of searched periods (419), the peak
value of 31.08 (chance probability of ) at
8.0544 s corresponds to a significance of 99.88% (that
is a 3.2 detection).
To better estimate the period, we used an epoch folding
technique and fitted the peak in the versus trial period
distribution as described in Leahy (1987). This led to
s. The resulting EPIC folded lightcurve is shown
in Figure 3. The pulsed fraction, defined as
, where
and are the background-subtracted
count rates at the peak and at the minimum, is % in
the 0.65–12 keV energy range.555 The SNR contamination,
evaluated from the model described in Section 2.1, is also included
in the background. The error in the pulsed fraction does not include
the systematic uncertainty due to the SNR contamination. We
repeated a similar analysis on the data-sets from the two short
XMM-Newton observations carried out in 2000 and 2001 (see Table
1), but, due to the paucity of photons,
we did not detect any significant periodicity.
Considering also the two periods measured by Chandra (Kulkarni et al., 2003), a linear fit to the period evolution of SGR 0526–66 is
unacceptable ( of 15.6 for 1 degree of freedom).
On the other hand, the period derivative inferred from our period
measurement and the most recent Chandra detection is
s s-1. Comparison with the value
derived from the two Chandra measurements
( s s-1) indicates a
significant decrease of the spin-down rate.

3 Discussion and conclusions
Due to its location in the LMC, SGR 0526–66 is one of the magnetars less frequently observed. In addition to its larger distance with respect to Galactic magnetars, the analysis of its persistent X–ray emission is complicated by the bright soft X–ray emission of the N49 SNR. With a deep XMM-Newton observation performed in 2007, we could measure the pulsation period of SGR 0526–66 which was previously detected only in the pulsating tail following the 1979 March 5 giant flare (Mazets et al., 1979) and in two Chandra observations taken in 2000 and 2001 (Kulkarni et al., 2003). The pulsation profile (shown in Figure 3) is double-peaked and the pulsed fraction is (13.60.9)%. Although, to our knowledge, the pulse profile of SGR 0526–66 was never published before, these might be permanent properties of this source since a non-sinusoidal modulation and a pulsed fraction around 10% were also reported for the Chandra data (Kulkarni et al., 2003).
Although the period measurements of SGR 0526–66 are very sparse, the value we derived shows, for the first time, a significant decrease in the spin-down rate of this source. In the magnetar model, a reduction of the spin-down rate can be interpreted as an indication of a more relaxed state of the twisted magnetosphere and should be associated to a low rate of bursting activity, a spectral softening and a decrease of the persistent X–ray luminosity (Thompson et al., 2002). This behavior is sometimes observed in magnetar candidates (see, e.g., Mereghetti et al. 2005), but some exceptions have been found (see, e.g., Gavriil & Kaspi 2004). In the case of SGR 0526–66, the bursting activity is indeed very low, since no bursts have been detected since 1983. However, we note that some bursts might have been missed due to its large distance and its location in a sky region not frequently monitored by -ray instruments.
The X–ray luminosity measured in 2007 is % lower (and the spectrum slightly softer) than that reported from the analysis of Chandra data taken in 2000 and 2001 (Kulkarni et al., 2003). However, due to the different characteristics of the instruments and additional uncertainties due to the presence of contamination from the SNR diffuse emission, we consider these changes well within the systematic uncertainties. Using the two shorter XMM-Newton observations, taken almost simultaneously with the Chandra ones, we can instead extract the spectrum and model the SNR emission in the same way as we did for the 2007 observation. In this case we are dominated by statistical errors and no significant changes in the spectral shape and source flux are detected.
The luminosity of SGR 0526–66, which can be well determined thanks to its accurately known distance, is higher than that of most magnetar candidates (see e.g. Durant & van Kerkwijk 2006). Since this high luminosity has not substantially varied for at least several years, it is probably a long-lasting property of this magnetar rather than a transient bright state related to its past bursting activity, culminating with the giant flare of 1979 March 5. This behavior is radically different from the one displayed, as an example, by SGR 1627–41 that, after two distinct periods of bursting activity, rapidly decreased its persistent X–ray luminosity down to 1033 erg s-1 (Esposito et al., 2008). While it is unclear whether this behavior is related to intrinsic differences between the sources (e.g. the magnetic field) or different evolutionary stages, this seems to support the emerging trend of separating the magnetars into transient and persistent objects, rather than in AXPs and SGRs. In this framework, SGR 0526–66 should therefore be considered a member of the persistent magnetars group.
acknowledgements
We acknowledge the partial support from ASI (ASI/INAF contracts I/088/06/0 and AAE TH-058). PE thanks the Osio Sotto city council for support with a G. Petrocchi fellowship. SZ acknowledges support from STFC. NR is supported by a NWO Veni Fellowship. DG acknowledges the CNES for financial support.
References
- Anders & Grevesse (1989) Anders E., Grevesse N., 1989, Geochim. Cosmochim. Acta, 53, 197
- Bilikova et al. (2007) Bilikova J., Williams R. N. M., Chu Y.-H., Gruendl R. A., Lundgren B. F., 2007, AJ, 134, 2308
- Cline et al. (1982) Cline T. L., Desai U. D., Teegarden B. J., Evans W. D., Klebesadel R. W., Laros J. G., Barat C., Hurley K., Niel M., Weisskopf M. C., 1982, ApJ, 255, L45
- den Herder et al. (2001) den Herder J. W., Brinkman A. C., Kahn S. M., Branduardi-Raymont G., Thomsen K., Aarts H., Audard M., Bixler J. V., et al. 2001, A&A, 365, L7
- Duncan & Thompson (1992) Duncan R. C., Thompson C., 1992, ApJ, 392, L9
- Durant & van Kerkwijk (2006) Durant M., van Kerkwijk M. H., 2006, ApJ, 650, 1070
- Esposito et al. (2008) Esposito P., Israel G. L., Zane S., Senziani F., Starling R. L. C., Rea N., Palmer D. M., Gehrels N., et al. 2008, MNRAS, 390, L34
- Gavriil & Kaspi (2004) Gavriil F. P., Kaspi V. M., 2004, ApJ, 609, L67
- Hurley et al. (2005) Hurley K., Boggs S. E., Smith D. M., Duncan R. C., Lin R., Zoglauer A., Krucker S., Hurford G., et al. 2005, Nature, 434, 1098
- Hurley et al. (1999) Hurley K., Cline T., Mazets E., Barthelmy S., Butterworth P., Marshall F., Palmer D., Aptekar R., Golenetskii S., Il’Inskii V., Frederiks D., McTiernan J., Gold R., Trombka J., 1999, Nature, 397, 41
- Kulkarni et al. (2003) Kulkarni S. R., Kaplan D. L., Marshall H. L., Frail D. A., Murakami T., Yonetoku D., 2003, ApJ, 585, 948
- Leahy (1987) Leahy D. A., 1987, A&A, 180, 275
- Mazets et al. (1979) Mazets E. P., Golentskii S. V., Ilinskii V. N., Aptekar R. L., Guryan I. A., 1979, Nature, 282, 587
- Mereghetti (2008) Mereghetti S., 2008, A&A Rev., 15, 225
- Mereghetti et al. (2005) Mereghetti S., Tiengo A., Esposito P., Götz D., Stella L., Israel G. L., Rea N., Feroci M., Turolla R., Zane S., 2005, ApJ, 628, 938
- Paczynski (1992) Paczynski B., 1992, Acta Astronomica, 42, 145
- Park et al. (2003) Park S., Burrows D. N., Garmire G. P., Nousek J. A., Hughes J. P., Williams R. M., 2003, ApJ, 586, 210
- Rothschild et al. (1994) Rothschild R. E., Kulkarni S. R., Lingenfelter R. E., 1994, Nature, 368, 432
- Strüder et al. (2001) Strüder L., Briel U., Dennerl K., Hartmann R., Kendziorra E., Meidinger N., Pfeffermann E., Reppin C., et al. 2001, A&A, 365, L18
- Thompson & Duncan (1995) Thompson C., Duncan R. C., 1995, MNRAS, 275, 255
- Thompson & Duncan (1996) Thompson C., Duncan R. C., 1996, ApJ, 473, 322
- Thompson et al. (2002) Thompson C., Lyutikov M., Kulkarni S. R., 2002, ApJ, 574, 332
- Turner et al. (2001) Turner M. J. L., Abbey A., Arnaud M., Balasini M., Barbera M., Belsole E., Bennie P. J., Bernard J. P., et al. 2001, A&A, 365, L27