Measurements of soft and intermediate photons from hot and dense matter at RHIC-PHENIX
Abstract
The measurements of direct photons in GeV/ for p+p and Au+Au collisions have been made through the virtual photon method at PHENIX. The fraction of the direct component to the inclusive yield is determined by a shape analysis using the mass spectra in MeV/ for GeV/. The real direct photon spectra in p+p and Au+Au collisions are obtained from the virtual direct photon fractions, and a significant excess over a binary-scaled p+p result is seen in Au+Au collisions. Hydrodynamical models which reproduce the Au+Au result indicate the initial temperature of the matter is higher than the critical temperature of QGP. The d+Au data taken in 2008 are promising to evaluate the contribution of the nuclear effects due to its large statistics.
1 Introduction
Direct photons are one of the most powerful probes to investigate properties of the matter created by heavy ion collisions since they leave the medium without a strong interaction once they are generated. The direct photons are emitted from every stage of the collisions, and their transverse momenta are characterized by their origins. Especially, the low and intermediate region ( GeV/) is considered as a suitable window for measuring the medium-induced direct photons [1]. Primary contributors in the low and intermediate region are considered to be thermal photons from QGP and photons produced in jet-medium interactions such as jet-photon conversions and in-medium Bremsstrahlung, respectively. It is quite certain that the direct photons below 5.0 GeV/ provide rich information of the created matter, but it is very challenging to measure them due to a large background from hadron decays.
In the PHENIX experiment, two different analysis methods, namely, a ’real’ photon method and a ’virtual’ photon method, have been successfully developed. Measurements of ’real’ direct photons using an electromagnetic calorimeter in p+p and Au+Au collisions have been made successfully in GeV/ at the PHENIX experiment [2, 3], and the results are in agreement with the next-to-leading-order perturbative QCD (NLO pQCD) calculation. The measurement using the ’virtual’ photon method can be extended to GeV/. The results of the direct photon measurements with the virtual photon method at PHENIX are presented in this report.
2 Virtual Photon Method
In general, any source of real photons can emit virtual photons which convert to low mass pair. A direct photon production process such as has an associated process that produces low mass pair, i.e. . The relation between the photon production and the associated pair production is expressed by Eq. 1 [4].
| (1) |
where is the fine structure constant, and are the masses of the electron and the e+e- pair, respectively, is a process dependent factor and is an emission rate of the photons. In the case of and Dalitz decays (Kroll-Wada formula), is given as , where denotes the form factor and is the mass of the parent hadron. The factor is obviously zero for . On the other hand, the factor becomes unity for in the case of direct decays. Therefore it is possible to extract the direct component from the e+e- mass spectrum by utilizing the difference in e+e- mass dependence of the factor.
3 Measurements in p+p and Au+Au collisions
The region GeV/ and MeV/ satisfies the requirement for applying the virtual photon method that . The left and center panels in Fig. 1 show the e+e- mass distributions in p+p and Au+Au collisions for MeV/ and GeV/ compared to the hadronic cocktail calculations which incorporated the measured yields of the mesons at PHENIX.
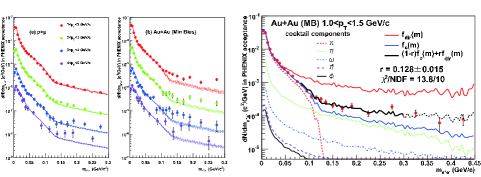
The symbols and lines show the data and hadronic cocktail calculations. While the p+p result is in good agreement with the cocktail calculation and a small excess over the cocktail calculation is observed for GeV/, an enhancement over the cocktail calculation is clearly seen in Au+Au collisions in MeV/.
The following function, Eq. 2 is fitted to the data in order to determine the fraction of the direct component in the mass distribution.
| (2) |
where is the mass distribution from the decay of neutral hadrons estimated using the cocktail calculation and is the expected distribution from the direct decays [5], and is the direct fraction. The right panel in Fig. 1 shows the e+e- mass distribution in Au+Au collisions for GeV/ together with the fit result by Eq. 2 shown as a thick solid black line. Assuming that this excess comes from direct decays, the fit result agrees with the data even in MeV/ shown as a dotted black line. On the other hand, assuming that the excess comes from , i.e. is used in place of , anomalous enhancement is required to reproduce the excess. Therefore the assumption that the excess comes from direct decays seems to be favored by the data.
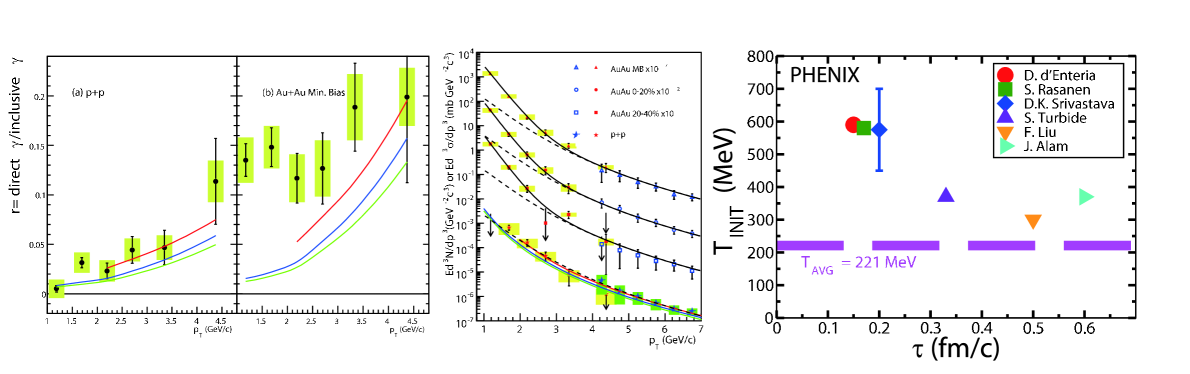
The left panel in Fig. 2 shows the obtained direct fractions as a function of in p+p and Au+Au collisions. The symbols show the results and the lines are the expectations from NLO pQCD calculations with different theoretical scales [6]. A clear excess above the expectation is seen in Au+Au collisions while the p+p result is consistent with the expectation. Finally, the real direct photon yields are converted from the direct fractions. The center panel in Fig. 2 shows the direct photon spectra in p+p and Au+Au collisions. The closed and open symbols show the results from ’virtual’ and ’real’ photon analyses, respectively. The star symbol shows the p+p result and the triangle, circle and box symbols show the Au+Au results for minimum bias, centrality of 0-20% and 20-40%. This is the first measurement where the direct photon yield in p+p collisions has been successfully measured in GeV/. The p+p result is consistent with NLO pQCD calculations in GeV/, but a modified power law function as shown by the dashed curve, , describes the p+p result better. It serves as a crucial reference to the Au+Au result. In Au+Au collisions, a significant excess over the binary-scaled p+p result is observed in GeV/. An exponential function, , plus the binary-scaled p+p result is fitted to the Au+Au result in order to determine the inverse slope, which is related to the temperature of the matter. In central Au+Au collisions, the inverse slope of the fitting function is MeV.
Various efforts for understanding the implications of the result have been made via hydrodynamical approach [7]. They are in agreement with the data within a factor of 2 in spite of their wide-ranging initial conditions, MeV and fm/. The right panel in Fig. 2 shows the relation between the initial temperature and formation time in the hydrodynamical models. These models indicate that the temperature of the matter at RHIC is higher than the critical temperature predicted by lattice QCD (160-190 MeV).
4 Measurement in d+Au collisions
The same measurement in d+Au collisions is also very important to evaluate the contribution of the nuclear effects such as Cronin effect and nuclear shadowing. These effects may modify the photon yield in the low region. The d+Au data already has been taken in 2003, and the direct photon measurement with the virtual photon method has been performed.
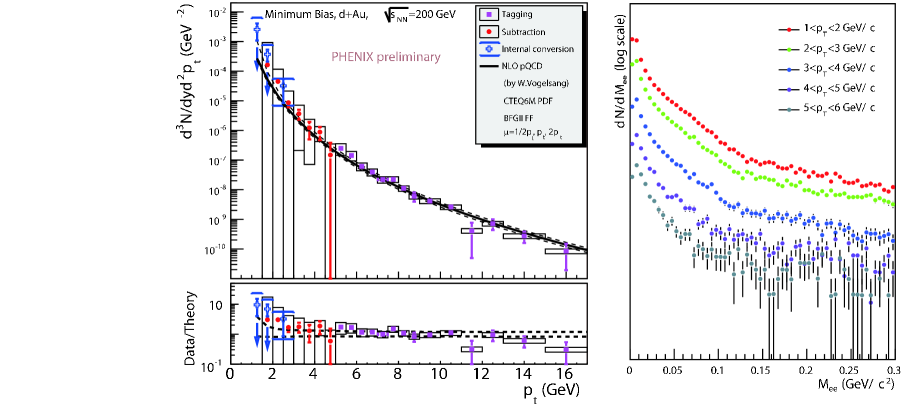
The left panel in Fig. 3 shows the direct photon spectrum in d+Au collisions using the data taken in 2003 [8]. The result from the ’virtual’ photon measurement could not reach to GeV/ due to low statistics. The d+Au result seems to be consistent with the NLO pQCD calculation shown as a line, but the systematic uncertainties are still too large to allow a conclusion. To evaluate the nuclear effect on the low photon yield surely, d+Au data have been taken again in 2008 with statistics about 30 times greater than that of the data taken in 2003. The right panel in Fig. 3 shows the mass spectra in MeV for several ranges using the data taken in 2008. The direct photon spectrum measured in these data is expected to reach 6.0 GeV/.
5 Summary and Outlook
The direct photon measurements with the virtual photon method have been performed for p+p and Au+Au collisions at PHENIX. This is the first measurement where the direct photon yield in p+p collisions has been successfully measured in GeV/. A significant excess over the binary-scaled p+p result is observed in the direct photon yield in Au+Au collisions. The excess is fitted with the exponential function and the inverse slope is given as MeV in central Au+Au collisions. Several hydrodynamical models which reproduce the Au+Au result indicate that the temperature of the matter at RHIC is higher than the critical temperature of QGP. The direct photon measurement in d+Au collisions has been made using the data taken in 2003 to evaluate the contribution of the nuclear effects. The d+Au result seems to be consistent with NLO pQCD calculation, but systematic uncertainties are too large due to small statistics. The d+Au data taken in 2008 are expected to provide better result because its statistics is about 30 times more than that of the data taken in 2003.
References
- [1] S. Turbide et al., Phys. Rev. C 69 (2004) 014903
- [2] S.S. Adler et al., Phys. Rev. Lett. 98 (2007) 012002
- [3] T. Isobe for the PHENIX collaboration, J. Phys. G: Nucl. Part. Phys. 34 (2007) S1015-S1018
- [4] N.W. Kroll and W. Wada, Phys. Rev. 98 (1955) 1355.
- [5] A. Adare et al., arXiv:0804.4168[nucl-ex].
- [6] L.E. Gordon and W. Vogelsang, Phys. Rev. D 48 (1993) 3136 and W. Vogelsang, private communication.
- [7] D.G. d’Enterria et al., Eur. Phys. J. C 46 (2006) 451
- [8] D. Peressounko et al., J. Phys. G: Nucl. Part. Phys. 34 (2007) S869-S872