Dynamics of Lyman Break Galaxies and Their Host Halos
Abstract
We present deep two-dimensional spectra of 22 candidate and confirmed Lyman break galaxies (LBGs) at redshifts in the Hubble Deep Field (HDF) obtained at the Keck II telescope. The targets were preferentially selected with spatial extent and/or multiple knot morphologies, and we used slitmasks and individual slits tilted to optimize measurement of any spatially resolved kinematics. Our sample is more than one magnitude fainter and is at higher redshift than the kinematic LBG targets previously studied by others. The median target magnitude was , and total exposure times ranged from 10 to 50 ks. We measure redshifts, some new, ranging from to , including two interlopers at , and resulting in a sample of 14 LBGs with a median redshift . The morphologies and kinematics of the close pairs and multiple knot sources in our sample are generally inconsistent with galaxy formation scenarios postulating that LBGs occur only at the bottom of the potential wells of massive host halos; rather, they support “collisional starburst” models with significant major merger rates and a broad halo occupation distribution. For 13 LBGs with possible kinematic signatures, we estimate a simple dynamical mass, subject to numerous caveats and uncertainties, of the galaxies and/or their host dark matter halos. Dynamical mass estimates of individual galaxies range from to and mass estimates of halos, based on close LBG pairs, range from to with a median value . Comparison with a recent numerical galaxy formation model implies that indeed the pairwise velocities might not reflect true dynamical masses. We compare our dynamical mass estimates directly to stellar masses estimated for the same galaxies from SEDs, and find no evidence for a strong correlation. The diversity of morphologies and dynamics implies that LBGs represent a broad range of galaxy or proto-galaxy types in a variety of evolutionary or merger stages rather than a uniform class with a narrow range of mass.
1 Introduction
Lyman break galaxies (LBGs) are currently among our best windows on the universe of galaxies at redshifts . LBGs are especially useful for investigating galaxy formation and evolution because they are relatively easy to find in large numbers (approaching 2 arcmin-2 down to ; Steidel et al 2003; Giavalisco et al 2002) and because they are relatively bright in the optical, thus permitting optical spectroscopic followup. Spectroscopic redshifts of several thousand LBGs have been measured to date, with photometric redshifts of tens of thousands also available (Paltani et al, 2007; Steidel et al., 2004; Ouchi et al., 2001; Ravindranath et al, 2006), and luminosity functions beyond have been measured (Kashikawa et al, 2006; Bouwens & Illingworth, 2006; Iwatat et al, 2007; Sawicki & Thompson, 2006). LBGs account for almost all of the star formation at observable in optical windows, and roughly half of the total star formation at those redshifts once dust-obscured systems such as sub-mm galaxies are included (Smail et al, 2002; Chapman et al, 2005; Giavalisco, 2002).
Although a complete picture of LBGs and their relation to galaxies today remains elusive, many pieces of the picture are now available. Spectra of LBGs clearly show evidence of strong bursts of star formation, ranging from , confirmed with deep radio and x-ray imaging with the VLA and Chandra by Reddy & Steidel (2004), who estimate a mean star formation rate (SFR) for UV-selected galaxies at . Deep images with HST reveal small sizes kpc (with ), high luminosities , and diverse morphologies, including multiple small knots, diffuse halos, and asymmetrical linear features. Deep Chandra images detect only of LBGs, implying that the AGN fraction is at most that much (Laird et al., 2005; Laird et al, 2006).
The spectra of LBGs also show evidence of strong outflows, e.g. Ly emission lines red-shifted and interstellar absorption lines blueshifted with respect to systemic redshifts (Shapley et al, 2003) and a paucity of QSO H I absorption lines near LBG sightlines (Adelberger, 2003), although Desjacques et al (2006) find that only smaller outflow bubbles are needed to explain the spectra, i.e. 0.5 Mpc comoving, implying that metals observed in the Ly forest are unlikely to come from LBGs.
Measuring and understanding the dynamical state and masses of LBGs is important for placing them in the context of galaxy formation. A galaxy’s mass affects its rate of accretion of new material, its ability to retain gas against the expulsive force of supernova winds, and possibly its eventual morphological type. The need to constrain LBG dynamics motivates the present work.
In the local universe, total galaxy mass is usually measured kinematically by deriving rotation curves or emission line widths for disk galaxies (Sofue & Rubin, 2001), measuring internal velocity dispersions for elliptical and other spheroidal systems, and measuring velocity distributions of satellite galaxies or other test particles for all galaxy types (Zaritsky et al, 1993), and then translating the observed velocity field into a dynamical or virial mass. The masses of larger systems such as galaxy groups and clusters, but not of their constituent galaxies, are likewise constrained by direct measurement of their velocity dispersions, as well as by X-ray emission and gravitational lensing.
Three kinds of direct evidence to date have been used to study the dynamics of LBGs and LBG host halos: emission line widths and spatially-resolved kinematics (for total mass and dynamical state), spectral energy distributions (for stellar mass only), and clustering analysis.
LBG mass measurements from redshifted H emission line widths and spatially-resolved kinematics generally fall in the range (Pettini et al, 2001; Erb et al, 2004, 2006; Forster Schreiber et al, 2006; Bouché et al, 2007; Nesvadba et al, 2006; Forster Schreiber et al, 2009). Some signs of rotation curves are seen at (Forster Schreiber et al, 2006, 2009; Lehnert et al, 2009), and there is also evidence for superwinds, especially Ly emission lines blue-shifted with respect to stellar and interstellar absorption lines (Pettini et al, 2001; Erb et al, 2004; Nesvadba et al, 2007). Forster Schreiber et al (2009) found that one-third of 62 galaxies at they studied with the SINFONI integral field unit (IFU) on the Very Large Telescope (VLT) showed rotation-dominated kinematics, one-third are interacting or merging systems, and one-third are dominated by random motions; derived H dynamical masses for the whole sample are , with median .
Estimates of the stellar mass of LBGs have benefited from deep imaging with Spitzer Space Telescope’s Infrared Array Camera (IRAC), including especially the GOODS and Extended Groth Strip (EGS) fields. Stellar masses of LBGs at generally range from for luminosities , with typical median values (Rigopoulou et al, 2006; Labbe et al, 2005; Shapley et al, 2005; Papovich et al, 2001; Huang et al, 2005). Ly emitting galaxies (LAE’s) show similar stellar masses (Lai et al, 2007).
Samples of LBGs in the redshift range are now large enough to constrain star formation history in LBGs: the median LBG mass is reported to be lower by around a factor of 10 at than at (Verma et al, 2007; Labbe et al, 2006; Yan et al, 2006; Eyles, L. P. et al, 2007), implying significant buildup of stellar mass through star formation and merging over that time, and mirroring the observed increase by roughly a factor of 10 in the comoving stellar mass density from to measured in the distant red galaxy (DRG) population (Rudnick et al, 2006; Fontana et al, 2006).
Finally, the observed clustering of LBGs has been used to constrain the mass of dark matter halos in which the galaxies presumably reside. Two-point correlation analysis reveals that LBGs cluster with each other with typical correlation length Mpc and implied halo masses (Giavalisco & Dickinson, 2001; Kashikawa et al, 2006; Adelberger, 2005a; Ouchi et al., 2001), while still leaving the masses of individual LBGs within those halos uncertain. Clustering of LBGs with damped Ly QSO absorption line clouds (DLAs) has also been detected, with implied DLA halo masses on the order of (Bouché & Lowenthal, 2003, 2004; Bouché et al, 2005; Cooke et al, 2006).
LBGs are also observed to cluster on small scales: Colley et al (1996) and Colley et al (1997) found that the two-point correlation function of faint objects in the HDF, consisting largely of LBGs at high redshift, peaks between 025 and 04 ( kpc at ) with amplitude greater than 2, i.e. LBGs appear as multiple clumps of emission rather than monolithic sources. They interpret that multiplicity as evidence of starbursting regions within otherwise normal gas-rich galaxies. Many of the targets discussed in the current paper fall into that category of close pairs or multiple-knot sources.
Galaxy formation theorists have used observations of LBGs extensively to check and revise their predictions and detailed descriptions of mass assembly, star formation, feedback, morphology, and clustering over cosmic time. Hydrodynamic -body simulations (Ceverino et al, 2009; Finlator et al, 2006; Weinberg et al, 2002; Mo et al, 1999; Night et al, 2006) and semi-analytic models (SAMs; Cole et al 2000; Somerville et al 2001; Bower et al 2006) of cold dark matter (CDM) structure and galaxy formation have generally succeeded in describing the observed photometric, stellar mass, size, star formation, luminosity function, and clustering properties of LBGs, especially by including varying amounts of dust extinction. In particular, the maximum stellar masses of LBGs predicted in smoothed particle hydrodynamics (SPH) models are at and at (Night et al, 2006); sizes are predicted to be kpc and halo and internal velocity dispersions to be and , respectively; star formation rates are expected to be (Mo et al, 1999); and SFR is predicted to correlate only weakly with stellar mass (Weinberg et al, 2002).
The available information therefore suggests that LBGs at range in stellar mass from with total mass from dynamical constraints , and that they reside in dark matter halos with mass , with significant clustering. Their star formation rates range from , with gas content and therefore star formation duty cycles and gas depletion timescales poorly constrained. Their comoving number density correponds roughly to that of luminous galaxies today, and their optical sizes and morphologies are diverse and compact. The general picture then is that LBGs are a heterogeneous set of actively star-forming galaxies or sub-galactic clumps, building blocks that will likely coalesce with other LBGs and/or non-LBG clumps to form more massive galaxies, groups, and clusters by .
To address further the open question of the dynamics of Lyman break galaxies and their host halos and help place them with more detail in the larger context of galaxy formation and evolution, we have obtained spatially resolved optical (rest-UV) spectra with the 10-m Keck telescope of a sample of LBGs and searched for kinematic information that we can use to constrain individual LBG and LBG host halo dynamics directly. Our sample is more than one magnitude fainter and is at higher redshift than the kinematic targets previously studied by others.
NIR IFU observations, especially with adaptive optics (AO) (Forster Schreiber et al, 2006, 2009; Lehnert et al, 2009), now provide direct access at to H and other rest-optical emission lines not strongly affected by dust, in contrast to Ly. However, optical spectroscopy such as that presented here has the advantage of lower sky and telescope background emission and higher sensitivity instruments and detectors, as well as broader redshift coverage.
2 Observations and Data Reduction
2.1 Lyman Break Galaxy Sample
Our sample was drawn from 46 candidate and confirmed LBGs in the Hubble Deep Field North (HDF-N). We used the same sample selection as Lowenthal et al (1997): blue in “” ()222Note that we are using AB magnitudes throughout, transformed from ST magnitudes as detailed in the HDF information posted on the World Wide Web: to transform from ST magnitudes to AB magnitudes, add 1.31, 0.399, -0.199, and -0.819 to , respectively. but extremely red in “” (), the colors expected for a blue, star-forming galaxy at with a Lyman continuum break. This color criterion is similar to that adopted by Steidel et al. (2003), but is slightly less restrictive in the blue , red region, which Lowenthal et al (1997) found allowed detection of ”Ly-break galaxies” at higher redshift in addition to pure Lyman break galaxies. Seven of the 46 sources were included via that relaxed criterion. The galaxy magnitudes fell in the range , with a median value of 25.34. The sample is thus more than 1 magnitude fainter than that of Pettini et al (2001) and more than 2 magnitudes fainter than that of Erb et al (2006). We chose both targets with confirmed spectroscopic redshifts and those without, since the success rate for LBGs selected in this way is typically so high ( for bright sources, ). The median reported redshift was . Many of the galaxies discussed here were studied by Steidel et al. (1996b) and Lowenthal et al (1997) but with lower spectral resolution and/or less attention to the position angle of the spectrograph slit.
We took full advantage of the fine pixel scale and high resolution of the HDF WFPC2 images, 0.04″pixel-1 with 014. We preferentially chose LBGs that showed clear signs of one or more of the following: (1) significant spatial extent ″ in the HDF-N image; (2) multiple knots and/or close pairings of LBGs in the HDF-N; and (3) previous spectroscopic evidence for some kinematic features. We also prioritized bright targets over faint ones. In all we observed 32 kinematic LBG targets in the HDF-N. Of the 32 total LBG targets observed, 21 showed some promise in the data of allowing dynamical mass estimates; the remaining discussion will focus exclusively on those 21 objects plus one serendipitously discovered LBG, which together we call the “high-priority targets”. A complete list of all 22 targets is given in Table 2, and the 11 unused targets are listed for completeness in Table 3. Most of those 11 were not useful for kinematic measurements because they had insufficient signal-to-noise ratio, no strong emission line, or no detectable spatial extent in our spectra.
We compared our target list to the list of LBGs hosting AGN in the HDF according to Chandra X-ray flux as reported by Laird et al (2006); no sources match within 10″ down to 0.5-2 keV flux levels as low as , so we conclude that none of our targets hosts a luminous AGN.
2.2 Observations
Our observations were made during six observing runs from May 1997 to April 1999 at the 10-meter Keck-II telescope using the Low Resolution Imaging Spectrograph (LRIS; Oke 1995). We designed six slit masks around the LBG targets; high-priority targets were observed with multiple masks to increase integration time. Each target was examined closely in the HDF image, and then its corresponding slit was tilted to match the long axis of any extended emission from the target galaxy. Slits were also tilted to cover multiple targets in close pairs or groupings. The masks were designed so that the position angle (PA) of most slits was within of the PA of the mask, meaning the slits were aligned close to perpendicular to the dispersion direction. But some slits were tilted as much as from the mask PA and the normal to the dispersion direction. Each mask had between 23 and 25 slits total (not including holes for alignment stars). About half the slits on each mask were designed around targets in the HDF and Flanking Fields for other programs. Slit lengths for our LBG targets ranged from 8-35″, with a typical length of 15″. All slits were 11 wide, although the slit tilts cause that width to be projected to a dimension smaller on the sky by a factor of cos(), where is the relative angle between the slit and the mask. The mask PAs were optimized for the anticipated mean hour angle of the HDF at the time of observation, in the sense that we tried to keep the majority of slits aligned with the parallactic angle to minimize slit losses due to differential refraction. We relied on our own astrometric measurements of the HDF and Flanking Fields to derive target positions.
For deriving wavelength solutions, HgNeArKr arc lamps were observed through each mask. Strong night sky lines were used to fine-tune the wavelength solution of some spectra.
We used a 600 l/mm grating blazed at 5000 Å, resulting in a dispersion of 1.28 Å pixel-1, a typical resolution of 4 pixels 5 Å full-width-at-half-maximum (FWHM) or 300 . This represented a compromise between a lower-resolution grating that might have delivered higher signal-to-noise per pixel and a higher-resolution grating that would have provided more detailed kinematic information. The grating angle was adjusted so that central wavelengths for slits at the mask centers were between 5000 and 6000Å, giving a spectral coverage of 2620Å and spectra ranging from a minimum of 3456Å to a maximum of 6978Å. The spatial pixel scale for slits perpendicular to the dispersion direction was 0.215 arcsec pixel-1, although this scale is compressed (more arcsec pixel-1) by 1/(cos ) for tilted slits, where is the relative PA between the slit and the mask.
Individual exposure times ranged from 1800 sec to 2700 sec, with at least two exposures through each mask to help reject cosmic rays. Spatial dithering was not possible due to the tilted slits. Targets received between two and 17 exposures each, depending on priority and repeat placement on multiple masks. This resulted in total exposure times ranging from 9,900 to 50,000 sec per target.
The weather was mostly clear and photometric but some exposures were affected by cirrus. The seeing was typically 1″.
Images of all the targets are shown in Fig. 2, with the location and PA of each slitlet superposed. Targets observed at multiple PAs are shown once for each PA.
We also included in our analysis some data from an earlier Keck/LRIS observing run in April 1996 (Lowenthal et al, 1997). The slits for that run’s slitmasks were tilted only to accommodate multiple objects, not to align to the major axis of extended objects. Nevertheless, some of those slits did fall at the same PA as the slits in the observing runs aimed at kinematic study, allowing us to add the datasets together.
2.3 Data reduction
We reduced the Keck/LRIS spectra using a combination of IRAF tasks and custom IRAF scripts and C routines. Raw images were bias-subtracted, cosmic-ray cleaned, flat-field corrected, and geometrically corrected to account for optical distortion.
The next stage was carried out in one of two ways: (1) The wavelength solutions for all the slits in a single exposure were measured simultaneously, the image was rebinned so that all slits had the same pixel-wavelength mapping and orientation perpendicular to the dispersion, and then background sky emission was subtracted and individual slits extracted as single two-dimensional spectra; or (2) individual slits were extracted from each exposure and then treated as long-slit spectra: a wavelength solution was derived from a corresponding arc lamp image, the data were rectified, the wavelength solution was fine-tuned using night-sky emission lines, and background sky emission was subtracted.
Finally, for each slit all individual exposures were combined using exposure-time weighting and spatial registration to make a single two-dimensional, sky-subtracted spectrum. One-dimensional (1D) spectra of most targets were extracted from the two-dimensional (2D) image. Representative 2D and all the 1D spectra are shown in Fig. 3 and Fig. 4, respectively.
3 Redshifts and LBG Kinematics
In this section we present several new redshifts in the HDF, and then describe our measurements of kinematic features in the reduced spectra and how we use them to derive estimates of dynamical masses, along with some significant caveats on those estimates.
3.1 Redshifts
We examined each one-dimensional spectrum visually to measure or confirm the target’s redshift. For difficult cases we tried cross-correlating the one-dimensional spectrum with various template spectra, including an average of confirmed LBG spectra from Lowenthal et al (1997) and a high-signal-to-noise ratio (S/N) spectrum of the gravitationally-lensed LBG MS 1512-cB-58 (Yee et al, 1996; Pettini et al, 2000) kindly provided by M. Pettini. In no case did the cross-correlation produce a reliable new redshift. In all, we found three tentative and one robust new redshifts; confirmed, refined, or constrained four more; and were unable to obtain useful redshift constraints for two. We were also able to measure the redshift for a new LBG the image of which fell on one of the slits but that was not in our original target list, for a total of five new redshifts.
Table 4 gives the redshift obtained for every object in the sample. The redshift quality is given on a scale from 1 to 4 such that means there is little hope of assigning a redshift given the signal-to-noise ratio in our data, 2 means real features are evident but the redshift is not secure, 3 means the redshift is probable, and means the redshift is definitely secure, with multiple spectral features identified.
3.2 Kinematic Measurements
We next searched for evidence in our LBG spectra that would allow us to constrain their dynamical state or even estimate their masses or their host halo masses. Measuring robust dynamical masses, however, is not straightforward, and the mass estimates we derive are subject to several major caveats. We discuss some of the most significant of these below.
3.2.1 Non-virialized systems: implications from simulations
The velocities and velocity limits we measure may simply not reflect orbital motion under gravity. Peculiar motion of galaxies or subgalactic clumps in unvirialized systems such as loose groups or very young clusters could play a significant role. Chance near superposition of physically unrelated sources could also lead to erroneous mass estimates. Since many of our targets are indeed clumps of knots or close pairs, these factors may strongly affect our results and interpretation.
To try to assess the significance of the non-virialization scenario, we turn to the ”phenomenological” n-body and semi-analytic CDM galaxy formation models of van Kampen & Crawford (2007). Their ”Model 3” represents a combination of two scenarios: star formation dominated by quiescent star formation in disks, usually just the central galaxy, and star formation dominated by merger-induced starbursts (both galaxy-galaxy and halo-halo mergers). One run of that model produced 13,257 simulated LBGs at ”detected” in 1 deg2 with criteria similar to those used by Steidel et al. (2003). We searched the catalog for projected close pairs of LBGs and examined their characteristics. We find 1206 pairs with separation ″. In Fig. 5, we plot the relative velocity in each pair vs. the projected separation on the sky, where the velocities are calculated using the two galaxies’ redshifts and their peculiar velocities. We focus on the simulated pairs with redshift difference (where ”redshift” means cosmological redshift only, without considering peculiar velocity), which we take to be truly physically related. There are 103 such pairs in the simulated catalog, or 8.5% of all pairs with ″; these are represented as open triangles in Fig. 5. We also plot the values for the four close pairs in our sample (see § 4).
We calculate for each simulated close pair of LBGs a dynamical mass
| (1) |
where is the maximum observed circular velocity, which in this case we take as , and is the radius at which the velocity is measured, in this case the separation between the pair. We also calculate the total (dark matter) halo mass of each pair as the sum of the two individual halo masses listed for the galaxies in the simulation catalog.
Fig. 6 shows calculated dynamical mass vs. total halo mass for the close pairs in the simulation of van Kampen & Crawford (2007). Surprisingly, there is no strong correlation seen. This implies that the velocities in fact do not (or not always) reflect true virial velocities. They may instead reflect infall velocities of subclumps or galaxies streaming into a potential well; such infall velocities are likely larger than virial velocities by at least a factor of two. We conclude that, if the simulation of van Kampen & Crawford (2007) is correct, the pair-wise velocities in our LBG sample may provide at best weak constraints on the true total masses of our LBG systems.
3.2.2 Incomplete spatial sampling
A second caveat is that we may be sampling the kinematics of only a small region, either central to a larger potential well or embedded but not centered in a large massive proto-galactic cloud or even a large but UV-faint galaxy. As discussed above in § 1, several recent groups have used optical and NIR photometry to study the rest-optical SEDs of LBGs in the HDF-N, and found that their stellar masses were typically (Papovich et al, 2001; Dickinson et al, 2004; Sawicki & Yee, 1998; Rigopoulou et al, 2006; Labbe et al, 2005; Shapley et al, 2005; Huang et al, 2005). These stellar masses provide a firm lower limit to the total dynamical mass.
In the local universe, rotation curves of massive disk galaxies rapidly reach maximum rotational velocity , typically within a few kpc (Sofue & Rubin, 2001), similar to the half-light radii of the LBGs studied here. Therefore, if LBG kinematics behave at all like those of local disks then we might not in fact be missing higher rotation velocities from faint extended regions below our detection limit (although we could be missing faint emission at the same velocity from larger radii, which would raise the mass estimates). Similarly, the central velocity dispersions of massive local elliptical galaxies are generally excellent indicators of the total galactic virial mass as measured by independent methods (DeZeeuw & Franx, 1991). Again this implies that even if LBGs reside in larger systems, the total mass may be well-sampled by the LBG kinematics.
Finally, we can compare LBGs at to luminous compact blue galaxies (LCBGs) at redshifts , which have many properties similar to those of LBGs such as small half-light sizes kpc, high luminosities (where is the characteristic luminosity in a Schechter luminosity function of galaxies today), blue optical colors, diverse, irregular morphologies, asymmetries , star formation rates , and narrow optical emission lines, (Guzmán et al, 1996; Phillips et al, 1997; Pisano et al, 2001; Guzmán et al, 2003; Lowenthal et al, 2005).
Barton et al (2006) found from deep optical imaging that more than half of the 27 compact narrow emission line galaxies (CNELGs, close cousins of LCBGs) at in their sample had sizes consistent with small local dwarfs, arguing against massive underlying host galaxies. Similar results derive from studies of nearby compact UV-luminous galaxies using GALEX (Basu-Zych et al, 2007; Heckman et al, 2005; Hoopes et al, 2007). The overall picture is that LCBGs at intermediate redshift are galaxies with luminosity but masses only 1/10th that of a typical galaxy, and dynamical/stellar mass ratios .
Constraints on stellar mass do not address the question of extended massive dark matter or gas halos surrounding the LBGs, of course. However, like measurements of local galaxy halo masses using satellite galaxy kinematics (Zaritsky et al, 1993), our constraints on the dynamical masses of close pair LBG systems are insensitive to mass-to-light-ratio or stellar population uncertainties.
3.2.3 Ly linewidth complications
The third significant caveat regarding our mass estimates is that the Ly emission linewidths we use to estimate dynamical masses of individual LBGs and sub-clumps are subject to the influence of bulk inflows and outflows of gas, strong absorption by dust, and multiple scattering by neutral hydrogen, all of which can change the line profile. Such effects have been studied theoretically by several groups (e.g., Wolfe, 1986; Verhamme et al, 2006; Neufeld, 1990; Tenorio-Tagle et al, 2004). Observational evidence includes the systematic asymmetry and redshifting of the Ly emission line - presumably due to a combination of outflows and absorption by foreground dust – in LBGs and local starbursts (Pettini et al, 2001; Erb et al, 2004; Forster Schreiber et al, 2006; Erb et al, 2006), and Östlin et al (2008) find that the Ly emission of local starburst galaxies is spatially more extended than the continuum emission, presumably due to resonant scattering. We searched for but could not find any published or unpublished direct comparison between observed linewidths of Ly and those of H or other non-resonance nebular emission lines. Therefore our mass estimates based on Ly emission line widths must be regarded as tentative.
3.2.4 Unknown inclinations
Finally, we generally lack constraints on the inclination angle of our targets, so each mass has associated with it an unknown sin correction factor. Apart from estimating or measuring inclinations of individual LBGs (as done by, e.g., Bouché et al 2007), this problem can be addressed only by assuming an average inclination or else assembling a large enough sample of kinematic measurements that all inclinations are statistically well represented.
3.3 Mass Estimates
Given the caveats discussed above, we will proceed with caution in analyzing LBG dynamics from our sample. Here we make an empirical distinction between individual Lyman break galaxies, with any multiple knots of emission connected by continuous flux visible in the HDF images and usually separated by 1″ or less, and LBG systems, consisting of two or more LBGs without obvious extended emission bridging the gap(s) between them. Both categories may correspond to star-forming galaxies or sub-galactic clumps embedded in low-mass or massive dark matter halos, and both may yield useful constraints on dynamical mass. The LBG systems offer an additional opportunity to measure the total host halo mass as opposed to masses of subclumps or individual LBGs, although given the results of our examination of the simulation of van Kampen & Crawford (2007), we will not assume that such results are robust.
We examined visually the two-dimensional spectra of all 22 of the high-priority targets for evidence of any of the following: (1) spatially extended emission lines, especially Ly but also including C IV and He II; (2) spectrally unresolved, resolved, or multiple-peaked emission lines, especially from LBGs with multiple knot morphologies; (3) extended continuum against which extended absorption lines might be detected; and (4) emission and/or absorption lines from close pairs of galaxies. The features detected are listed in Table 4.
For each LBG or LBG system with evidence of kinematic information, we then estimated the dynamical mass. For simple gravitational rotation, the dynamical mass would be as in Eq. 1 above.
We divide our mass estimates into two categories: (1) masses estimated from extended emission or absorption or multiple sources; and (2) masses estimated solely from the Ly emission line velocity width and observed half-light radius. The measured velocity and size parameters and derived mass estimates for our sample are listed in Table 5.
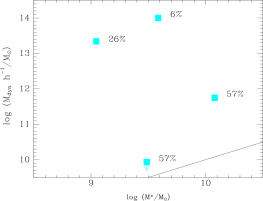
We compare in Fig. 5 the distribution of velocities, which range from to nearly 5000 , and projected separations of the four close pair systems with the prediction of Model 3 of van Kampen & Crawford (2007). The pair with the largest appears to lie outside the locus of simulated pairs with small (triangle symbols; assumed to be physically associated, rather than just chance projection), but there are some simulated pairs with small and even larger than that target – i.e., two LBGs within a few kpc of each other but with very high relative velocity, . To assess the probability that each pair in our sample is a true physical association, we can compare the density of small- pairs (triangles) to the density of large- pairs (dots) in different sections of the simulated plane. We divide Fig. 5 into eight equal segments bounded by 1, 4, and 7″ and 0, 2000, 4000, 6000, and 8000 km/s. Pairs with separation ″are excluded because we would be unlikely to resolve such pairs spatially given the typical seeing in our data. We calculate the probability , where and are the number of small- and total pairs, respectively, in each section. We find that ranges from 57% for the two real LBG pairs ( symbol) in the lower left corner of Fig. 5 to 6% for the pair in the upper middle section. In other words, according to the simulation, two of the four pairs have a better than 50% chance of being true physical associations, while one has a 94% probability of being a chance superposition. The value of for each pair is shown in Fig. 8.
For each of the eight LBGs with Ly emission (six of which are also included in the spatially extended emission category), we fit a gaussian function to the emission line and measure the half-light radius in the HDF image. We do not deconvolve the half-light radii with the WFPC2 PSF 014. This will have only a small effect on the larger sources, but for the smaller sources our measurement will overestimate the true half-light radius and therefore the enclosed dynamical mass. We did smooth the HDF images with a gaussian filter in an attempt to constrain (and correct for) the true seeing by matching the seeing-blurred spatial FWHM in the 2D spectra. However, significant uncertainties in the measured FWHMs (especially for low S/N sources) and even variation within single 2D spectra made this approach impractical.
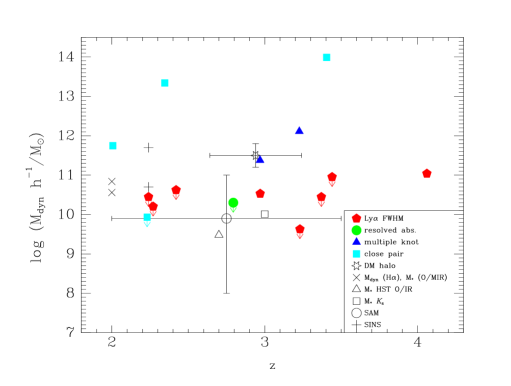
We deconvolve each observed linewidth with the measured 5Å spectral resolution to derive intrinsic linewidths. Based on the discussion above of dynamical studies of local and high-redshift galaxies, we adopt the FWHM of the line profile as a reasonable but untested proxy (modulo any outflow and extinction effects) for circular velocity , we adopt for , and we calculate an estimate, again based on Eq. 1, of the dynamical mass within the half-light radius. These measurements and the linewidth-based masses are also listed in Table 5, and all the derived masses are plotted vs. redshift in Fig. 7. Six of the eight Ly emission lines were at best marginally resolved, so we plot the derived dynamical masses for those sources as upper limits.
3.4 Notes on Individual Objects
Here we discuss the results for each target, listed in order of increasing RA, as in Table 2.
3.4.1 hd4_0259_1947
This relatively bright, elongated source has a disky isophote and captivated our interest as a potential high-redshift disk. Cohen et al (2000) report for their object No. 2 a redshift , with low confidence (, where 11 is the lowest confidence). Our spectrum shows no sign of Mg II absorption at that redshift in either 2D or 1D, and no C III (although at 3634Å, our spectrum has low sensitivity). We conclude that the redshift assignment seems unlikely.
However, the final coadded spectrum shows weak emission lines at 4499, 5869, and 6045 Å, plausibly matching [O II]3727, H, and [O III]5007, respectively, at redshift . We therefore conclude (though with low confidence, given the lines’ weakness) that the source is a low-redshift interloper that slipped through our color selection filter.
3.4.2 hd4_1076_1847
This compact, high-surface brightness source is the brightest target in our survey. Lowenthal et al (1997) were unable to measure a redshift, but found weak evidence for Mg II absorption at and . Cohen et al (2000) report with low confidence (, where 11 is the lowest confidence), and cite Cohen et al (1996) as the redshift source, but we are unable to find the target in that reference. Fernández-Soto et al (2001) argued that the published spectrum does not support that redshift, and added that their photometric redshift technique favors . Meanwhile, Budavári et al (2000) report a photometric redshift using HST/WFPC2+NICMOS .
We accumulated 24.5 ks of integration time observing the source with LRIS. Nevertheless, we find no strong emission or absorption lines, and we are unable to obtain an unambiguous redshift for the source, nor can we measure any kinematic signature.
No strong continuum break is visible in our spectrum, which extends down to 3320Å with continuum detectable by eye in the 2D image down to 3920Å. Since no strong Ly emission or absorption is seen redward of that wavelength, we conclude that the emission redshift must be .
We again find weak evidence for Mg II absorption at and , as reported in Lowenthal et al (1997). Unfortunately the Mg II lines for the lower redshift coincide with night sky lines, complicating their detection and measurement. The lower redshift, which is consistent with the value of Cohen et al (2000), is supported by possible Fe II absorption. If real, either or both sets of redshifted absorption lines could be due either to intrinsic absorption from the emitting galaxy itself, or to intervening absorption if the emitting galaxy is at higher redshift. The redshift of the galaxy GOODS J123640.85+621203.4, with a position centroid 22 from hd4_1076_1847, is reported by Cohen et al (1996) to be . GOODS J123640.85+621203.4 has a highly linear morphology extending at least 15 in the HDF, aligned to within 10∘ of the separation vector between the two sources. The close agreement between its emission redshift and the tentative Mg II absorption redshift we find in the spectrum of hd4_1076_1847 suggests that it is either responsible for the absorption, or else associated with another as yet unidentified absorbing galaxy – perhaps hd4_1076_1847 itself.
We are therefore unable to confirm any of the previously published redshifts or derive a new one for this source, apart from the lower and upper limits mentioned above. No kinematic information is available from our spectrum.
3.4.3 C4-09
Object C4-09 in the catalog of Steidel et al. (1996b) is a remarkable source consisting of four bright knots of emission with nearly identical colors, all within an area barely more than 1″ across. Zepf et al. (1997) investigated and finally rejected the source as a possible gravitational lens system. As reported by Steidel et al. (1996b), the spectrum shows strong emission with two peaks at 5118.7 and 5132.6Å. Continuum is clearly detected redward of the emission but not blueward, supporting the interpretation of the emission lines as Ly at redshifts 3.211 and 3.222, respectively, slightly lower than the reported by Steidel et al. (1996b). Weak absorption lines are seen at 5314, 5489, 5624, and 5633Å, corresponding to Si II, O I, C II, and Si IV, respectively at an average absorption redshift , between the redshifts of the emission line peaks.
We observed C4-09 with two PAs, one (98∘) aligned with the longest axis of the parallelogram of knots, and the other (137∘) closer to the short axis. The four knots visible in the HDF image are so close together, with spacings between 057 and 117, that the continuum and the red side of the emission line appear unresolved in both of our two-dimensional spectra. The blue side of the Ly emission line, however, appears to be slightly extended spatially in the long-axis spectrum, with FWHM=17, compared with the seeing FWHM=11, and offset towards the east with respect to the redder line and the continuum. No such spatial extent or offset is visible in the short-axis spectrum. No sign of ordered rotation is visible.
The spatial extent and offset of the blue peak with respect to the red peak and the continuum are consistent with a scenario in which some subset – one, two, or three knots – of the four emission knots is responsible for the blue peak, and another subset at a different velocity gives rise to the red peak. The blue and red Ly peaks are well fit in the spectral direction by gaussian profiles with FWHM 5.5 and 7.0 Å, respectively, i.e., unresolved or marginally resolved. After deconvolution with the 5 Å resolution, those widths correspond to and , respectively. The 14 Å separation between the two peaks, however, corresponds to a velocity difference of 820 . If the wavelength separation is indeed due to radial velocity differences among two or more of the four knots (rather than, e.g., an absorption line superposed on a broad emission line), then we can use it to estimate a system dynamical mass. Given the maximum spatial separation (which will yield maximum mass) of 117, we derive a dynamical mass from Eq. 1 .
Alternately, the double-peaked emission profile is also well-fit by a single narrow absorption line with Å and Å superposed on a broad emission line with Å and Å. Such a broad emission line could be caused by strong gas outflows, and the absorption line could be caused by a foreground clump or screen of gas, even dust-free, that resonantly scatters Ly photons out of the line center. In this scenario, the emission profile FHWM of 800 would reflect outflow velocity, perhaps coupled with resonant scattering, rather than circular velocity of a virialized system. The redshifts from the Ly emission and absorption lines would then be and 3.2170, in excellent agreement with the redshift from the interstellar absorption lines but contrary to the commonly red-shifted Ly emission reported by Shapley et al (2003) and Erb et al (2004), which they cite as evidence of outflows in LBGs. Thus an outflow model for C4-09 appears somewhat problematic.
We are not able with the current data to distinguish definitively between the two scenarios. If outflow is indeed responsible for the line profile, then the true dynamical mass is most likely significantly lower than the value derived above.
3.4.4 hd4_0818_1037
This source is compact and relatively bright, but continues to elude efforts to obtain a definitive redshift.
Cohen et al (1996) list a redshift and Cohen et al (2000) report a corrected redshift with high confidence (, where 1=highest confidence). However, we see no Al II1671 Å absorption matching either redshift, only possible O I1302 Å/Si II1304Å and possible N V1243 Å in P-Cygni profile matching ; no C IV1550 Å is detected. Budavári et al (2000) give a photometric redshift .
Continuum is clearly detected in our spectrum with a spatial profile matching an unresolved PSF. No strong emission or absorption lines are detected. Weak emission lines may be present at 5925 and 5976 Å. If these were [O III] at , we would expect H at 5804 Å and/or [O II] at 4450 Å, but neither is seen. Possible weak absorption lines appear at 4566, 4678, 5069, and 5447 Å, but none is well-detected, nor were we able to discern a pattern among them indicating a source redshift. We find no support for the tentative redshift reported by Lowenthal et al (1997) based on cross-correlation, apart from the possible line at 5069 Å, which would correpond to Al II1671 Å.
Without solid absorption or emission line features available, we also find no kinematic indicators in our spectrum.
3.4.5 hd4_0298_0744
hd4_0298_0744 is another elusive target. Cohen et al (2000) report with high confidence, while Budavári et al (2000) find . Continuum is clearly visible in the two-dimensional spectrum even before sky subtraction down to the blue limit of our spectrum, with no strong break visible. No strong emission or absorption features are seen in the final two- or one-dimensional extracted spectrum. We were therefore unable to confirm the redshift reported by Cohen et al (2000), which we would have expected to produce a strong Ly emission or absorption line or continuum break visible at 4621Å. Because no strong continuum break is visible down to 3900Å in our spectrum, we conclude that the redshift is most likely .
We cannot extract any dynamical information on the source.
3.4.6 C4-06
C4-06 from the catalog of Steidel et al. (1996) is one of the brightest, largest sources in our sample. The HDF image shows a linear structure – dubbed the “Hot Dog Galaxy” (Bunker, 2001) – roughly ″ in extent, with two major knots and several sub-knots. The LRIS mask slit was aligned along that structure.
Strong, spatially resolved continuum is clearly detected in the two-dimensional spectrum, although it appears as a single spatially continuous source, rather than the separate knots seen with HST resolution. The spatial extent of the continuum emission, measured by compressing the two-dimensional spectrum into a one-dimensional spatial profile, is 32, consistent with the HDF image.
No emission lines are visible, but several strong absorption lines are detected matching redshifted Ly, Si II, O I, C II, and Si IV. The Ly line is broad (78Å FWHM), while the other lines are unresolved. Additional marginal detections include Si II, N I, and Si III. The redshift derived from averaging the strong narrow absorption line redshifts is , while cross-correlating the spectrum with that of a template average of 12 LBGs yields , similar to the redshift reported by Steidel et al. (1996b).
The narrow absorption lines show no sign of any velocity shift across the extended continuum (see Figure 3). To quantify any subtle velocity gradient, we extracted three one-dimensional spectra at the middle and the two ends of the linear source and intercompared them. The central extraction aperture was 12 pixels (26) wide and the apertures at the two ends were 6 pixels (13) wide, centered 8 pixels apart, so that the two end apertures had no overlap.
To constrain the velocity shift between the two end apertures, we selected regions of the spectra containing strong absorption lines and free from residual noise from strong sky emission lines and cross-correlated them. The cross-correlation yielded a strong peak at Å. Assuming a minimum relative wavelength accuracy of 1.0Å, the velocity shift between the two apertures is then , consistent with zero within our measurement errors. The dynamical mass limit implied by the observed constraint on line-of-sight velocity gradient over 322 is , the lowest dynamical mass estimate in our sample (modulo, of course, the unknown inclination and three-dimensional morphology of the source).
We interpret the lack of observed velocity gradient over more than 20 kpc as evidence that we are observing not an edge-on disk with ordered rotation, but rather a truly linear, perhaps filamentary source. The object may of course be collapsing or even expanding perpendicular to the line of sight; collapse is more natural under most current galaxy formation scenarios.
3.4.7 hd4_1006_0680
This galaxy appears as a very close pair in the HDF image, with a separation of only . Cohen et al (2000) report a redshift for the source . Our mask slitlet was aligned along the same PA, , as the two emission knots; however, 1″ ground-based seeing certainly blurs the two into a single unresolved source in our LRIS observations.
The spectrum shows very strong emission at 4823.2 and weaker emission at 4812.3Å. The stronger line appears extended both spatially and spectrally: the spatial FWHM of the line is 12, comparable to the seeing, but the emission profile’s faint wings extend to cover 33. The spectral FWHM is 7.0Å, compared to the resolution of 5Å, and the total detected emission spans 26.4Å, including the two peaks and their wings.
The weaker line’s spatial position centroid is offset 025 from that of the brighter line, closely matching the separation of the pair in the HDF image.
Weak continuum is detected both redward and blueward of the emission lines, but appears to be stronger on the red side. No other emission or absorption features are seen.
It is highly unlikely that this double emission line corresponds to an optical line emitted by a low-redshift () system. The [O II] doublet would, at , be separated by 3.5Å, not the 11Å we observe. Any [O III] or Balmer line should be accompanied by other optical lines as well. We conclude that the most likely interpretation is Ly at , confirming with only a slight revision the redshift reported by Cohen et al (2000).
The double emission line profile may be due to a single emission line with strong absorption superposed by an intervening cloud or galaxy. Alternatively, as for C4-09, it may be caused by radial velocity differences between the two emitting knots. Given the close match between the spatial separations in the image and in the spectrum, we adopt the latter scenario. The velocity difference between the emission peaks then corresponds to , while the entire 26.4 Å span of the emission line corresponds to , and the spectral FWHM of 7.0 Å corresponds, after deconvolving with the 5Å instrumental resolution, to 4.9 Å, or .
To derive a mass estimate for the system, we assume each knot in the pair emits one emission line, and we therefore adopt (2.3 kpc) and to obtain . The large total range in observed emission velocity, , may be due to bulk gas outflow induced by merging of two or more sub-units and/or by the subsequent starburst.
3.4.8 hd4_1486_0880
Despite the relative brightness of this target, its redshift remains elusive. Lowenthal et al (1997) reported a tentative redshift based on a few possible absorption lines. Thompson (2003) estimated a photometric redshift , while Budavári et al (2000) give none. The source is smooth, slightly extended, and elongated in the HDF image. Continuum is easily detected along the entire length of our spectrum. However, no emission lines are visible, nor are any strong absorption features. There are possible absorption lines at 4386, 4528, 4794, 4816, 5168, and 5573Å, but we were unable to discern any convincing pattern matching our redshifted template spectra or our previous tentative redshift . Cross-correlation with the template spectra likewise revealed no robust redshift. The lack of a strong continuum break redward of 4000Å implies , contrary to the photometric redshift calculated by Thompson (2003).
With no strong absorption or emission features, we were also unable to derive any kinematic information from the spectrum.
3.4.9 hd4_0367_0266
The HDF image shows the source hd4_0367_0266 to be an elongated object with two bright knots separated by 06 and an extended tail terminating in a fainter knot, all nearly aligned. The redshift of reported by Lowenthal et al. (1997) was based on several absorption lines. The total extent of the source shown in the HDF is 23; the LRIS mask slitlet was aligned to cover all three knots as well as the tail.
Our spectrum shows weak extended continuum emission with FWHM 34. No emission lines are detected. Several possible weak absorption lines appear in the extracted one-dimensional spectrum at 4956, 5117, and 5478Å. These lines would correspond to Si II, O I, and Si IV, respectively, at the previously reported redshift . A possible broad absorption trough at 4757Å could be a damped Ly absorber at . Overall our confidence in the redshift is somewhat lower than reported in Lowenthal et al. (1997), and we downgrade the redshift quality to .
To search for velocity gradients or shifts across the galaxy, we extracted two spatially-independent one-dimensional spectra centered 24 apart and cross-correlated them, using only the clean regions of the spectra that were free from sky noise residuals and showed evidence of absorption features. The cross-correlation function displays a weak peak consistent with , but unfortunately the signal-to-noise ratio was too low to allow any robust measurement of kinematics.
3.4.10 hd2_1928_1041 (C2-06) and C2-05
The source hd2_1928_1041 (C2-06 in the catalog of Steidel et al 1996) is separated by only 20 spatially from C2-05, and we consider them here as a close pair. Each of the galaxies is a compact source with one bright knot and a small cloud of extended emission as seen in the HDF. Steidel et al. (1996b) reports for C2-05, but this is revised to by Cohen et al (2000). For hd2_1928_1041, Papovich et al (2001) report , citing Lowenthal et al (1997); we here slightly revise that redshift.
Both targets are covered in a single LRIS slitlet on our slit masks. Strong, unresolved continuum is detected from both objects. No emission lines are visible, but numerous absorption lines corresponding to interstellar species such as Si II, O I, C II, Si IV, C IV, and Al II are well detected in the two spectra, corresponding to redshifts (hd2_1928_1041) and (C2-05). The velocity difference implied by the redshifts is . Cross-correlation of absorption line regions in the two one-dimensional extracted spectra produces a strong peak at (where the error is estimated by dividing the FWHM of the cross-correlation peak by 10), consistent with the simple redshift difference.
The observed velocity difference and spatial separation provide a dynamical mass estimate for the two-source system.
3.4.11 hd2_1739_1258
A highly elongated, multiple-knot source embedded in extended emission, extending over at least 26 along the long dimension, to which our LRIS slitlet was aligned.
Spectroscopic redshifts reported in the literature include (Lowenthal et al, 1997) with low confidence and (Cohen et al, 2000) with high confidence (, where 1=best). Fernández-Soto et al (1999) cite , and Cowie et al (2004) cites , but we could not find the source of either measurement in the literature. Wirth et al. (2004) reported that a redshift was not measurable in their spectrum of the source.
Photometric redshifts calculated for hd2_1739_1258 include (Fernández-Soto et al, 1999), (Thompson, 2003), and (Budavári et al, 2000).
Strong, extended continuum emission is detected in our 39 ks integration with a spatial 9 pixels, or 19 and a total extent of 39. The continuum dies below about 4075Å, implying if the dip is due to Ly blanketing. However, we also detect two possible weak absorption lines at 5305, 5318Å, which match Mg II at . These absorption lines could be due to intervening gas, but they could also be intrinsic to the target. We detect no features that support either the redshift (Cohen et al, 2000) or (Lowenthal et al, 1997). Given the lines we do detect weakly, we tentatively conclude that hd2_1739_1258 in fact lies at rather than at .
We extracted two spatially independent 1-dimensional spectra from the extended two-dimensional spectrum and cross-correlated them in an attempt to measure velocity gradients across the source, but no statistically significant cross-correlation signal was detected.
3.4.12 hd2_1398_1164
This galaxy consists of a single compact core with two short wings of extended emission. Cohen et al (2000) report .
Our LRIS slitlet was aligned with the long axis of the system. The spectrum shows a single weak emission line at 3934.2Å with Å, i.e. barely resolved, with clear continuum redward but none blueward. Interpreting the line as Ly, which is supported by the continuum break, we derive a redshift . No other strong emission lines are detected, although possible weak C IV and Al II absorption and He II emission are visible. The width of the line corresponds to a deconvolved velocity width of 240 , which we adopt as an upper limit.
Neither the continuum nor the strong emission line shows any spatial extent in our two-dimensional spectrum, so we are unable to constrain kinematics for this system.
3.4.13 C3-02
C3-02 is a small source with a single compact bright knot of emission and a diffuse tail extending barely 1″, along which our LRIS slit was roughly oriented. Steidel et al. (1996b) reported a tentative redshift , Fernández-Soto et al (1999) report a photometric redshift , and Budavári et al (2000) report .
Spatially unresolved continuum is easily detected with average S/N per resolution element over the entire length of our 25.5 ks spectrum, which extends from 3650-6285Å. No emission lines are visible. Several possible weak absorption lines appear at 4317, 4663, and 4608Å, the first of those being the strongest (Å). None of those wavelengths matches features expected from galaxies at . Both the photometric and spectroscopic redshifts previously reported therefore seem unlikely to be correct. There is a possible match to O I1302, Si II1304, C II1335/1336, and Si IV1402/1403 at . No Ly emission is visible at the expected wavelength for that redshift, but the continuum shape is consistent with a moderate break there. Given the weakness of the lines, we adopt this redshift only tentatively (). Kinematic measurements of this source are also impossible from our spectrum.
3.4.14 hd2_0698_1297
hd2_0698_1297 consists of two distinct knots embedded in an asymmetrical blob of diffuse emission. The knots are 05 apart, and the diffuse emission visible in the HDF F814W image extends for 12. The system is 27 from hd2_0705_1366, an unresolved point source (measured 014) in the HDF image.
Because of slit mask orientation constraints, we observed this pair at two different position angles: for 25.5 ks at 42∘, and for 10.2 ks at 58∘. Due to the close proximity of the two sources, the 11-wide slitlets at both PAs include emission from both targets.
Both spectra show weak continuum with per resolution element and a single emission line from each source. The emission line from hd2_0698_1297 is stronger in the spectrum with PA=42∘, while that from hd2_0705_1366 is stronger at PA=58∘, presumably because of slit placement with respect to each source. We measure the wavelengths of the emission lines from the stronger spectrum in each case: 5396Å (hd2_0698_1297) and 5312 (hd2_0705_1366), each with Å, corresponding for redshifted Ly to and 3.370, respectively, within of the values reported in Lowenthal et al (1997). There is evidence for an absorption trough bluewards of the emission line in hd2_0698_1297, supporting our identification of the line as Ly. We cannot confidently rule out the possibility that each emission line is in fact spectrally unresolved, so we adopt the measured FWHM as an upper limit in each case.
The continuum and the emission lines are all spatially unresolved, except perhaps continuum from hd2_0698_1297, which shows a slight spatial extent 15, although this may be due at least partly to small spatial registration errors in co-adding the 18 individual exposures.
Given the wavelength difference 84 Å and projected separation 27 between the two sources, and assuming the wavelength difference to reflect gravitationally-induced dynamics, we derive a system dynamical mass , the largest estimated dynamical mass in our sample.
3.4.15 hd2_0705_1366
See hd2_0698_1297 (above).
3.4.16 hd2_0529_1567
See hd2_0624_1688 below.
3.4.17 hd2_0624_1688
This triple-knot compact source is part of a close pair with hd2_0529_1567, 625 away. Both were covered by the slitlet at that targeted hd2_0725_1818 and hd2_0743_1844 (see below). hd2_0624_1688, for which Lowenthal et al (1997) reported , was in our original kinematic sample target list, while hd2_0529_1567 was not: at , it offered little hope of providing a useful spectrum.
However, our 2D spectrum shows clear continuum and a single strong emission line from each source. The continuum emission from hd2_0624_1688 shows a significant drop blueward of the emission line. Continuum from the fainter hd2_0529_1567 is of course much weaker, and the proximity of the emission line to the blue end of the spectrum prevents us from assessing any continuum break across the line.
The single emission line from hd2_0624_1688 lies at 4162.7Å, yielding redshift assuming that the emission line is Ly, compared with reported by Lowenthal et al (1997). No other absorption or emission lines are visible, and Ly is the only plausible interpretation. The emission linewidth is Å, corresponding to 3.8 Å or after deconvolution with the 5 Å resolution, and we adopt that value as an upper limit.
The emission line from hd2_0529_1567 lies at 3973.3Å, yielding , again under the assumption that the line is redshifted Ly. The deconvolved linewidth is Åor , which we adopt as an upper limit. No other absorption or emission features are seen.
Together with the projected separation of 625 (50 kpc), the observed velocity difference of 1394 yields a dynamical mass estimate for the pair system .
3.4.18 hd2_0725_1818
This small ( 026) source lies only 13 from hd2_0743_1844. Lowenthal et al (1997) reported a spectroscopic redshift for hd2_0725_1818 based on a Ly emission line, but only a tentative redshift for hd2_0743_1844. The two sources have similar colors, with hd2_0743_1844 bluer by only 0.27 mag in and redder by only 0.05 mag in , less than the spread in the colors of LBGs reported by Papovich et al (2005); hd2_0743_1844 is fainter by 0.8 mag in (all measurements from the catalog of Williams et al 1996).
Our LRIS spectrum covers not only both of those sources, but also a spiral galaxy to the north with a redshift reported by Phillips et al (1997) and, to the south, hd2_0624_1688 and hd2_0529_1567 (see above).
Continuum from both galaxies is easily visible in the two-dimensional spectrum, but with some overlap of their spatial profiles, given their mere 13 separation. The flux from hd2_0725_1818 is 2-3 times stronger than that hd2_0743_1844, consistent with their photometric measurements. Several absorption features are apparent in the two-dimensional image; while they seem to span spatially the continuum from both sources, the weakness of the fainter source makes this appearance difficult to confirm visually.
We extracted a one-dimensional combined spectrum of the pair. To assess their redshifts and velocities independently, we also extracted two separate one-dimensional spectra in the following way: First we extracted a one-dimensional spectrum of the brighter source, hd2_0725_1818, using only those pixels in the two-dimensional spectrum extending spatially from the peak of the source away from hd2_0743_1844, i.e. the side of the spatial profile that is less contaminated by flux from the fainter source. We then used this 1D extraction to model the entire 2D spectrum and subtracted the scaled model from the 2D image. This left a clean, isolated spectrum of hd2_0743_1844, which we then extracted to 1D. We repeated the process in reverse, modelling and subtracting the 2D spectrum of hd2_0743_1844 to produce a clean, isolated and uncontaminated spectrum of hd2_0725_1818.
The absorption lines in the 1D spectrum of hd2_0725_1818 are well matched by interstellar SiII, CII, and AlII, and stellar SiIV, CIV at , thus confirming and slightly revising the redshift reported by Lowenthal et al (1997). We also find a tentative detection of C III in emission, similar to their earlier result. Ly lies at the blue end of the spectrum, which is clean but low ; no emission or break is visible in either 2D or 1D.
The spectrum of the fainter source, hd2_0743_1844, also shows absorption corresponding to Si II, C IV, and O I. No Al II is detected, though the is low in that part of the spectrum. The implied redshift is , consistent with that of hd2_0725_1818, and we adopt that redshift with quality rather than 4 given the source’s extreme faintness.
To measure any small velocity difference between the two sources, we cross-correlated the independent 1D spectra against each other, using only those parts of the spectra free of bright sky emission line residuals. The result was a strong correlation peak (correlation strength = 0.2) at , consistent with within our nominal velocity resolution of . For comparison, we also cross-correlated each 1D spectrum with a 1D spectrum of blank sky extracted from the same 2D image. No strong correlation peak is seen anywhere near , with a maximum of only 0.017 within of , and a maximum correlation strength 0.1 for the whole spectrum. We thus conclude that the correlation between hd2_0725_1818 and hd2_0743_1844 is significant, and that they have identical redshifts within our uncertainties.
Adopting an upper limit and the projected separation 13 or 10.9 kpc, we then derive a dynamical mass upper limit , the lowest derived mass in our sample.
3.4.19 hd2_0743_1844
See hd2_0725_1818 above.
3.4.20 hd3_1633_1909
An elongated, wispy source consisting of two clumpy wings extending over 21, with a 05 gap separating them, and aligned roughly east-west. The source’s total isophotal colors in the HDF Vesion 1 catalog satisfy the -dropout criteria of Lowenthal et al (1997). However, in the HDF Version 2 catalog, the two sides’ colors are significantly different, with the western side bluer by 1.30 mag in and 0.52 mag in . Furthermore, in the Version 2 catalog photometry, neither component individually satisfies either the -dropout or the -dropout criterion.
Our LRIS slit covered both wings, as well as the source hd3_1824_1945 74 away and two other sources, one on either end of the slit. Cohen et al (2000) report for the source.
Only extremely very faint continuum is detected at the position of hd3_1633_1909 in the 2D spectrum, with no absorption lines discernible. A single emission line appears, however, at 6145Å. The emission line, though apparently spectrally resolved with Å, is not well fit by the [O II] doublet at ; the peaks of the two components would be separated by 4.1Å, while the line in the spectrum is well fit by a single gaussian. If the line is Ly, the source’s redshift is , the highest redshift in our sample and consistent with the redshift reported by Cohen et al (2000). The resolution-deconvolved velocity width of the emission line is .
No spatially extended kinematic information is available from our spectrum.
3.4.21 hd3_1824_1945
This compact double-knot source was covered by the same slit that included hd3_1633_1909 (see above), 74 away. Cohen et al (2000) report (object 145 in their online list).
Our spectrum shows strong continuum with spatial 16 extending without any obvious break virtually to the blue limit of the spectrum at 3750Å. No strong emission lines are visible; only a few weak possible absorption lines are present. We see no compelling evidence to support the redshift reported by Cohen et al (2000); for example, Al II1671Å, C IV, and Si IV, which often appear in strong absorption in LBG spectra, are not seen.
The lack of a strong Ly continuum break down to 3750Å implies , in conflict with the photometric redshifts calculated by Fernández-Soto et al (2001) and by Budavári et al (2000). Meanwhile, the lack of strong emission lines including [O II] 3727Å implies .
No kinematic information is available from our spectrum.
3.5 Summary of results
Of the 22 targets in our high-priority sample, we confirm that 14 are LBGs with and or 4, of which 13 provided some evidence of kinematics that we use to estimate dynamical mass or upper limits thereon. Two candidates are probably interlopers at , and the remaining six show insufficient features for confident redshift (or kinematic) measurement. The failure rate, 6/22 = 27% (or 8/22=36% if we include the two interlopers), is higher than the typical failure rate for LBGs with , . This must be due to our color selection function, which is somewhat different from that of Steidel et al. (2003) and may be less restrictive, as mentioned above; our magnitude limit, which is 1-2 mags fainter than most previous spectroscopic surveys of LBGs; our use of the 600 l/mm grating, which provides less spectral coverage than the lower-resolution gratings commonly used for LBG redshift surveys; or a combination of those effects.
Eleven of the 13 LBGs with kinematic signatures show spatially extended emission or absorption: eight are in close pairs, two contain three or four knots of emission each, and one is a clumpy elongated source extending over 3″or 25 kpc. A different subset comprising eight of the 13 are sources with Ly emission lines whose linewidths may provide some constraint on dynamical mass. The redshifts of the combined subsets range from to with a median of . The angular extent of emission ranges from 0.12-6″( kpc), and the adopted circular velocities range from to 4700 , with a median of 330 .
We divide the mass estimates into two overlapping categories based on the source morphologies and angular extent: individual LBGs, comprising 11 sources, and LBG systems, comprising the four close pairs. We derive dynamical masses for the LBGs (using Ly linewidths and extended and multiple-knot sources) ranging from to , with a median . We see no evidence in any of our targets for ordered rotation such as measured by Forster Schreiber et al (2006) and Erb et al (2006) for some of their more luminous star-forming galaxies at lower redshift (). Dynamical mass estimates for the LBG systems range from to , with a median mass . We emphasize that all these values are subject to the caveats discussed in § 3.2, and that two of the four close pairs have probability % of being chance projection rather than physical associations, according to our comparison with the models of van Kampen & Crawford (2007).
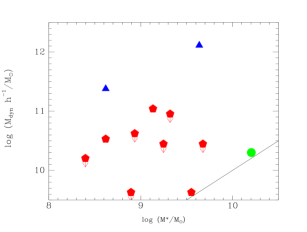
The tentative dynamical masses we derive for individual LBGs, to , are very similar to those measured for brighter targets by Forster Schreiber et al (2006) based on H kinematics measured with VLT/SINFONI, , implying that either Ly and H emission linewidth measurements are both robust or else they both suffer from complications of comparable scale. Forster Schreiber et al (2006) also extrapolate the velocities beyond the half-light radii to estimate the virial mass of a typical halo, finding , similar to the halo masses inferred by Adelberger (2005a) based on clustering. In contrast, the median dynamical mass that we measure for our four close-pair systems is an order of magnitude larger, and the maximum system dynamical mass estimate is , more than above the mean halo mass of Forster Schreiber et al (2006). We note, however, that in no case in our sample is the derived dynamical mass less than the reported stellar mass for the same galaxy (§ 4.2), which is reassuring.
4 Discussion
Having measured redshifts and searched our spectra for dynamical signatures in 13 LBGs and LBG systems, we now compare those results to several other observational results and to theoretical expectations in order to explore implications for galaxy formation scenarios.
4.1 Mergers, close pairs, and implications for galaxy formation
Many lines of evidence point to the importance of merging in galaxy evolution over the entire cosmic history of galaxies. In this section we explore the possibility that our sample of LBGs includes a significant merger fraction, and we compare the characteristics of our sample directly to the predictions of galaxy formation theories, including masses and close pair fractions.
Cold accretion of gas and dark matter not associated with major majors is also increasingly appreciated as a significant source of fresh material for star formation and mass buildup (Genel et al, 2008; Cook et al, 2009; Agertz et al, 2009). But major mergers, where the components have roughly equal mass, can erase disk morphologies and produce starbursts, AGNs, and elliptical galaxies, and even minor mergers can induce bursts of star formation or disturbed morphologies (Barnes & Hernquist, 1992; Mihos & Hernquist, 1996; Lin et al, 2007). Recent works have measured the evolution of the rate of galaxy mergers, the fraction of close pairs of galaxies, and the distribution of galaxy morphologies over cosmic time (Kampczyk et al, 2007; Bridge et al, 2007; Lin et al, 2004; Bell et al, 2006; Kartaltepe et al, 2007; Lotz et al, 2006a; Conselice et al, 2003). Essentially all of those results are consistent with hierarchical galaxy formation models, in which galaxy mass is assembled largely through merging.
As noted above, early studies of LBGs recognized the high rate of close pairs and multiple knots (Colley et al, 1996, 1997; Lowenthal et al, 1997). Of the 14 confirmed LBGs in our sample, 12 are in close pairs or have multiple-knot or highly extended, clumpy morphologies. All 12 are therefore excellent candidates for merging systems. Indeed, every close pair in our sample yielded potential kinematic information; conversely, the targets that failed to provide such information were predominantly low-surface brightness, elongated, diffuse sources, which may themselves be interacting or merging systems. Our entire sample, of course, is strongly biased away from isolated, symmetrical morphologies by virtue of our visual selection process, so it is to be expected that the sample would show a higher fraction of merging systems than do magnitude-limited LBG samples.
Our sample contains only four close pair systems, so it is subject both to small number statistics and especially to the assumption that the pairwise velocities indicate dynamical mass (see § 3.2). The components of the four pairs may be subclumps in various stages of infall and virialization, in which case their relative velocities could be dominated by random rather than circular motions. They may, however, also reflect a true, large range in the masses of the LBG host halos.
The theoretical implications of observed LBG close pair incidence and velocity distributions for galaxy formation models have been explored in detail by several groups (Somerville et al, 2001; Wechsler et al, 2001; Zhao et al, 2002, 2003a, 2003b; Shu et al, 2001). Wechsler et al (2001) found that different models predicted very different halo occupation distributions, i.e. the number of LBGs per dark matter halo. In most CDM models, the number of LBGs predicted per halo increases with mass, with typically LBG halo-1 for and . The number of close pairs of galaxies – defined as galaxies within a given angular separation within a redshift interval – is an especially sensitive discriminator between models. Specifically, compared to the observed number of close LBG pairs, models postulating a one-to-one correspondence between LBGs and massive dark matter halos (“massive halo” models) underpredict close pairs by , while the “colliding halo” model overpredicts close pairs by within 15″. The best agreement was provided by their “collisional starburst models”, in which LBGs host both ongoing quiescent star formation and rapid bursts of star formation triggered by minor and major galaxy mergers.
To compare the observed incidence of close pairs in our sample with the models of Wechsler et al (2001), we first note that only two of the four systems we call “close pairs” satisfy the Wechsler et al (2001) criterion . Fig. 6 in that paper shows the fraction as a function of pair separation for different models. All four of the pairs in our sample have separation ″, so they all fall in the first bin in the figure. If we assume that we have observed all the close pairs in the HDF survey volume in that separation bin, i.e. the total number of close pairs with is , and further that the total number of galaxies in the survey volume with comparable selection criteria is roughly the number of LBG candidates in the HDF times the success rate we observe here, or , then we find . This value is already marginally inconsistent with (higher than) the values, all , predicted by the collisional starburst, constant efficiency quiescent, and accelerated quiescent models in Fig. 6 of Wechsler et al (2001); the massive halo model underpredicts close pairs by a factor of more than (including only the error bars of Wechsler et al 2001). The colliding halo model, on the other hand, overpredicts it by a factor of less than . Obviously, with such small numbers of close pairs and large uncertainties on the selection function and completeness of our sample, the observed incidence ratios should be viewed as only tentative.
The close pairs and multiple knot systems we study here all have maximum angular separation ″, and therefore all fall in the first bin in the separation-pair fraction plot (Fig. 6) of Wechsler et al (2001), where indeed the discrimination among models is the strongest. Because of the biased nature of our target selection, we do not attempt to compare quantitatively the observed pair fraction with the predicted one. But we do note that close pairs are represented over the entire range of dynamical masses we derive, . This distribution is likely due either to (1) misinterpretation of the kinematic signatures (i.e. the velocities are not due primarily to orbital motion under gravity), resulting in erroneous mass estimates or (2) misidentification of individual knots of emission as separate galaxies, thus complicating the comparison with the models; or else (3) it is inconsistent with the general prediction of Wechsler et al (2001) that the number of LBGs per halo should increase with halo mass.
Shu et al (2001) use observed sizes and SFRs of LBGs to conclude from their models that LBGs must be hosted by halos with circular velocities , although for some combinations of gas-to-total and dust-to-total mass ratios the distribution can reach 400 . If LBG close-pair dynamics are indeed indicative of host halo mass, then the range of halo masses in our sample is significantly larger and the typical mass significantly higher than predicted by Shu et al (2001). Zhao et al (2002) further explore the possibility of using the observed pairwise velocity distribution (PVD) to discriminate between different galaxy formation models, but their investigation focuses on scales between 100 kpc and 30 Mpc, much larger than the 10-kpc scale of multiple-knot and close pair targets studied here.
Zhao et al (2003a) analyze dark matter halo -body simulations and report that mass accretion occurs in a rapid phase, during which the halo’s circular velocity is also predicted to rise rapidly, followed by a slow phase, during which the circular velocity remains almost constant. However, they examine only isolated halos with total mass fixed at , for which the maximum circular velocity predicted is and the maximum halo radius is kpc. These spatial scales are roughly comparable to those of three systems in our sample: two close pairs and the highly extended source C4-06. The velocity scale is comparable in only one close pair system. Most of the LBGs and LBG systems in our sample are therefore not apparently well described by the models of Zhao et al (2003a). However, if we interpret our results within their framework, the large range in system dynamical masses we derive could imply that we are seeing the systems at different evolutionary stages, some before the rapid mass accretion phase is completed and the circular velocity plateaus, and some after. Typical group-sized halos today have circular velocities , and cluster halos have circular velocities . Only one of our LBG system velocities lies well above that range, with ; the rest have velocities consistent with those of normal galaxies to normal clusters of galaxies today. As noted above in § 3.3 (Fig. 5), the distribution of pairwise velocities and projected separations of our four pairs is consistent with the predictions of Model 3 of van Kampen & Crawford (2007), supporting their scenario of quiescent disk star formation combined with merger-induced starbursts.
The dynamical masses we derive span the range of masses of dwarf galaxies to giant elliptical galaxies today. Our modest sample is certainly biased and is not representative of all LBGs at . The range of estimated dynamical masses is similar to that derived for simulated LBGs in Model 3 of van Kampen & Crawford (2007) (§ 3.3), but the kinematics of both simulated and real datasets may in fact not reflect true virial masses, especially given the lack of correlation with combined halo mass in the simulation (Fig. 6). However, taken together, the sizes, SFRs, morphologies, velocities, and derived individual and system dynamical masses of the LBGs in our sample imply a large range of physical scenarios and dark matter halo masses. They also further suggest that, rather than being identified one-to-one with the centers of future massive spheroids, bulges, or elliptical galaxies, LBGs are merging sub-clumps within halos that are destined to become galaxies with a large range of masses and potentially of morphological type as well. This scenario is consistent with hybrid galaxy formation models such as the favored collisional starburst model of Somerville et al (2001) and Wechsler et al (2001), but not with their massive halo model.
4.2 Kinematic vs. Stellar Masses
Here we compare our kinematic mass estimates to the stellar masses of the same galaxies calculated by SED fitting.
Papovich et al (2005) expanded on the sample of Papovich et al (2001), fitting stellar population models to SEDs of UV-bright galaxies (i.e. LBGs) at in the HDF based on fluxes from HST/WFPC2 and NICMOS. The stellar masses for the 53 galaxies with in the NICMOS F160W band range from , with a median around . The stellar mass estimates for 765 of 1682 NICMOS-detected sources with spectroscopic or photometric redshifts have since been supplemented by photometry from Spitzer/IRAC and were kindly provided to us by C. Papovich (2007, private communication).
We searched the Spitzer-supplemented NICMOS+WFP2 catalog for positional matches to our high-priority LBG sample. All 22 targets have at least one match well-detected by NICMOS within 06. We visually examined and confirmed the position of each match in the HDF F814W images.
Of the 22 LBG targets, 20 have stellar mass estimates in the Papovich catalog, the other two lacking reliable redshifts. Neither of those two, however, is among the 13 LBGs in our sample showing kinematic signatures. Therefore we can directly compare all the individual and system (i.e., halo) dynamical masses we estimated to the stellar masses estimated by Papovich et al (2005). The HDF Nicmos Mosaic (HNM) catalog numbers, redshifts used, and stellar masses of all matched objects are listed in Table 6.
Six targets have two matches in the Papovich catalog within 13. Of those, three are in our list of 13 with dynamical mass estimates: C4-09, C4-06, and hd3_1633_1909, each producing two matches. Both matches in each case correspond to emission knots we consider to be part of the same LBG. For C4-09 and C4-06, the redshifts used by Papovich et al (2005) to calculate SED fits and stellar masses were for both matches essentially the same redshifts we report here. For hd3_1633_1909, however, Papovich et al (2005) used the same redshift we find () for only one of the two matches, while for the other they used , i.e. what we consider to be a single LBG they consider to be two sources at widely disparate redshifts. The resulting stellar mass estimate for the low-redshift source (HNM 1499) is 1/3 that of the high-redshift source (HNM 1506). We consider below the stellar mass estimate of only the high-redshift source. The low-redshift source certainly contributes flux to our spectrum. However, as our dynamical mass estimate of hd3_1633_1909 is based only on the Ly emission line width, the effect on our mass estimate should be negligible. On the other hand, the redshift of the low-redshift source may be in error; if the correct redshift is in fact close to , then the stellar mass estimate for hd3_1633_1909 would increase by roughly a factor of two.
We make the following three comparisons of the stellar mass estimates to our dynamical mass estimates: (1) for the eight Ly linewidth-based dynamical mass estimates or upper limits, we compare those values directly with the single matching stellar mass estimates (seven sources) or the two components of a double match (one source, C4-09) for a total of nine comparisons; (2) for the three individual but extended or clumpy sources with single or multiple matches in the NICMOS catalog, we combine the stellar mass estimates and compare the total to our individual LBG dynamical mass estimated from extended absorption or emission velocity or, if neither of those is available, from Ly linewidth; and (3) for the close pairs, we combine the two stellar mass estimates and compare the sum to the system dynamical (halo) mass from the pair’s relative velocity. The four-knot source C4-09, which yields both Ly linewidths and a double emission line peak, presumably from different emission knots, has two NICMOS matches, so we apply both comparison types 1 and 2 (i.e. we separately compare the smaller dynamical and stellar masses – perhaps due to individual knots – and the combined stellar and system dynamical masses). These comparisons are shown in Fig. 8.
The individual LBG stellar masses (comparison types 1 and 2 above) range from to with a median of . Two sources show stellar masses roughly equal to their dynamical masses. The stellar mass range and median, however, are both less than the range and median of dynamical masses; the typical mass ratio , comparable to those of LCBGs at (Guzmán et al, 2003). The stellar masses are also small compared to those measured for 181 LBGs in the EGS by Rigopoulou et al (2006), with median . No obvious correlation is seen in Fig. 8 between our dynamical mass estimates and the stellar masses from Papovich et al (2005), although a trend could be masked by the six upper limits on dynamical mass from Ly linewidths.
Erb et al (2006) likewise compared stellar and dynamical masses for 68 galaxies at lower redshift , finding a weak correlation between the two, with a mean stellar mass – more than 20 times the median stellar mass for our fainter, higher-redshift sample from Papovich et al (2005) – and a typical mass ratio vs. 5 for our sample. They also found that of their sample had large dynamical-to-stellar mass ratios (vs. 10/12 = 83% for our sample), suggesting that this was likely due to young galaxy ages that had not yet built up significant stellar mass, or else faint older stellar populations that escaped detection.
The same scenarios may explain the large dynamical-to-stellar mass ratios and lack of correlation we observe. Our sample is more than one magnitude fainter than that of Erb et al (2006), so we are probing farther down the LBG luminosity function. Local galaxies and even starburst galaxies show a wide range in mass-to-light ratio, from in solar units for extreme starbursts such as H II galaxies to for quiescently star-forming galaxies like the Milky Way (Guzmán et al, 1996). The large range is presumably due to a combination of galaxy age (older systems showing stronger NIR flux from stars), burst age (younger systems showing stronger UV flux from stars), merging history, and dust obscuration. The large range we observe in dynamical-to-stellar mass ratio may in fact reflect a wide range of intrinsic LBG properties including dark matter halo or sub-clump mass, star formation history, merging history and status, and burst age.
We also compared the system masses derived from the four close pair relative velocities with the combined stellar mass estimates from Papovich et al (2005; comparison type 3 above). The right-hand panel of Fig. 8 shows the comparison. Here the range in combined stellar mass is smaller than for the individual LBGs, while the range in system dynamical mass is larger. The average total stellar mass is , and the average system dynamical-to-stellar mass ratio is , ranging from to . This large mass ratio range suggests that one or both of two scenarios are at play: (1) the LBGs are embedded in dark matter halos with a wide range of masses that are not strongly correlated to the luminosity and star formation rates of the LBGs they host; and (2) the relative velocities of the close pairs may reflect various stages of infall, i.e. not all the close pairs are necessarily in virialized systems (see § 3.2).
5 Summary and Conclusions
We have studied candidate and confirmed LBGs at in the HDF-N with deep two-dimensional spectroscopy, finding 3 tentative and 2 robust new redshifts. We also find evidence for kinematics in 13 LBGs and four LBG close-pair systems. The observed morphologies and dynamics, including numerous cases of close pairs and multiple sources, appear to be most consistent with collisional starburst models of galaxy formation, rather than massive halo models with only one LBG per halo. We derived tentative dynamical mass estimates from the observed velocity signatures, finding a range from to with a median for the individual LBGs and a range from to with a median mass for the close-pair systems. All the mass estimates are subject to strong caveats including unknown inclination corrections, Ly absorption, outflows, and non-virialized systems. All our dynamical mass estimates are larger than the corresponding stellar mass measurements. However, we find no evidence for a correlation between stellar mass and dynamical mass, in contrast to the weak correlation found by Erb et al (2006) for their sample of brighter, lower-redshift sources.
We argue on the basis of comparison with local compact starburst galaxies, other studies of distant star-forming galaxies, and galaxy formation theories and simulations that the sizes, SFRs, morphologies, velocities, and dynamical mass estimates imply a wide range of physical scenarios and mass scales giving rise to LBGs at .
Given the large time investment at Keck needed to observe even this small sample, further progress in constraining the dynamical masses of LBGs will require technological advances including the deep diffraction-limited imaging and spectroscopy promised by James Webb Space Telescope and increasingly available through adaptive optics and NIR integral field spectroscopy at ground-based 10-meter class telescopes.
References
- Adelberger (2003) Adelberger, K. L., Steidel, Shapley, A. E. & C. C., Pettini 2003, ApJ, 584, 45
- Adelberger (2005a) Adelberger, K. L., Steidel, C. C., Pettini, M., Shapley, A. E., Reddy, N. A. & Erb, D. K. 2005a, ApJ, 619, 697
- Adelberger (2005b) Adelberger, K. L., Erb, D. K., Steidel, C. C., Reddy, N. A., Pettini, M. & Shapley, A. E. 2005b, ApJ, 620, L75
- Agertz et al (2009) Agertz, O., Teyssier, R. & Moore, B. 2009, MNRAS, 397L, 64
- Barmby et al (2004) Barmby, P. et al 2004, ApJS, 154, 97
- Barnes & Hernquist (1992) Barnes, J. E. & Hernquist, L. 1992, ARA&A, 30, 705
- Barton et al (2006) Barton, E. J., van Zee, L. & Bershady, M. A. 2006, ApJ, 649, 129
- Basu-Zych et al (2007) Basu-Zych, A. R. et al 2007, ApJS, 173, 457
- Bell et al (2006) Bell, E. F., Phleps, S., Somerville, R. S., Wolf, C., Borch, A. & Meisenheimer, K. 2006, ApJ, 652, 270
- Berrier et al (2006) Berrier, J. C., Bullock, J. S., Barton, E. J., Guenther, H. D., Zentner, A. R. & Wechsler, R. H. 2006, ApJ, 652, 56
- Bouché & Lowenthal (2003) Bouché, N. & Lowenthal, J. D. 2003, ApJ, 596,810
- Bouché & Lowenthal (2004) Bouché, N. & Lowenthal, J. D. 2004, ApJ, 609, 513
- Bouché & Lowenthal (2005) Bouché, N. & Lowenthal, J. D. 2005, ApJ, 623, 75
- Bouché et al (2005) Bouché, N., Gardner, J. P., Katz, N., Weinberg, D. H., Davé, R. & Lowenthal, J. D. 2005, ApJ, 628, 89
- Bouché et al (2007) Bouché, N. et al 2007, ApJ, 671, 303
- Bouwens & Illingworth (2006) Bouwens, R. & Illingworth, G. D. 2006, Nature, 443, 189
- Bower et al (2006) Bower, R. G., Benson, A. J., Malbon, R., Helly, J. C., Frenk, C. S., Baugh, C. M., Cole, S. & Lacey, C. G. 2006, MNRAS, 370, 645
- Bridge et al (2007) Bridge, C. R. et al 2007, ApJ, 659, 931
- Budavári et al (2000) Budav\a’ri, T., Szalay, A. S., Connolly, A. J., Csabai, István & Dickinson, M. 2000, AJ, 120, 1588
- Bundy, Ellis & Conselice (2005) Bundy, K., Ellis, R.S. & Conselice, C. 2005, ApJ, 625, 621
- Bunker et al (1998) Bunker, A. J., Stern, D., Spinrad, H. Dey, A. & Steidel, C. C. 1998, AAS, 192, 7008
- Bunker (2001) Bunker, A. J. 2001, The Observatory, 121, 284
- Caputi et al (2004) Caputi, K. I., Dunlop, J. S., McLure, R. J. & Roche, N. D. 2005, MNRAS, 361, 607
- Carlberg et al (2000) Carlberg, R.G. et al 2000, ApJ, 532, L1
- Ceverino et al (2009) Ceverino, D., Dekel, A. & Bournaud, F. 2009, arXiv:astro-ph/0907.3271v1
- Chapman et al (2005) Chapman, S. C., Blain, A. W., Smail, I., & Ivison, R. J. 2005, ApJ, 622, 772
- Cohen et al (1996) Cohen, J. G., Cowie, L. L., Hogg, D. W., Songaila, A., Blandford, R., Hu, E. M., & Shopbell, P. 1996, ApJ, 471, L5
- Cohen et al (2000) Cohen, J. G., Hogg, D. W., Blandford, R., Cowie, L. L., Hu, E., Songaila, A., Shopbell, P., & Richberg, K. 2000, ApJ, 538, 29
- Cole et al (2000) Cole, S., Lacey, C. G., Baugh, C. M. & Frenk, C. S. 2000, MNRAS, 319, 168
- Colley et al (1996) Colley, W. N., Rhoads, J. E., Ostriker, J. P., & Spergel, D. N. 1996, ApJ, 473, L63
- Colley et al (1997) Colley, W. N., Gnedin, O. Y., Ostriker, J. P. & Rhoads, J. E. 1997, ApJ, 488, 579
- Conselice et al (2003) Conselice, C. J., Bershady, M. A., Dickinson, M. & Papovich, C. 2003, AJ, 126, 1183
- Cook et al (2009) Cook, M., Lapi, A. & Granato, G. L. 2009, MNRAS, 397, 534
- Cooke et al (2006) Cooke, J., Wolfe, A.M., Gawiser, E. & Prochaska J.X. 2006, ApJ, 652, 994
- Cowie et al (2004) Cowie, L. L., Barger, A. J., Hu, E. M., Capak, P. & Songaila, A. 2004, AJ, 127, 3137
- De Propris et al (2005) De Propris, R., Liske, J., Driver, S. P., Allen, P. D. & Cross, N. J. G. 2005, AJ, 130, 1516
- Desjacques et al (2006) Desjacques, V., Haehnelt, M. G. & Nusser, A. 2006, MNRAS, 367, 74
- DeZeeuw & Franx (1991) DeZeeuw, M. & Franx, M. 1991, ARAA, 29, 239
- Dickinson et al (2003) Dickinson, M., Papovich, C., Ferguson, H.C. & Budavári, T. 2003, ApJ, 587, 25
- Dickinson et al (2004) Dickinson, M. et al 2004, ApJ, 600, L99
- Erb et al (2004) Erb, D. K., Steidel, C.C., Shapley, A. E., Pettini, M., & Adelberger, K. L. 2004, ApJ, 612, 122
- Erb et al (2005) Erb, D. K., Steidel, C.C., Shapley, A. E., Pettini, M., Reddy, N.A. & Adelberger, K. L. 2006, ApJ, 646, 107
- Erb et al (2006) Erb, D. K., Steidel, C.C., Shapley, A. E., Pettini, M., Reddy, N.A. & Adelberger, K. L. 2006, ApJ, 646, 107
- Eyles, L. P. et al (2007) Eyles, L. P., Bunker, A. J., Ellis, R. S., Lacy, M., Stanway, E. R., Stark, D. P. & Chiu, K. 2007, MNRAS, 374, 910
- Fernández-Soto et al (1999) Fernández-Soto, A., Lanzetta, K. M. & Yahil, A. 1999, ApJ, 513, 34
- Fernández-Soto et al (2001) Fernández-Soto, A., Lanzetta, K. M., Chen, H.-W., Pascarelle, S. M., & Noriaki, Y. 2001, ApJS, 135, 41
- Finlator et al (2006) Finlator, K., Davé, R., Papovich, C. & Hernquist, L. 2006, ApJ, 639, 672
- Fontana et al (2006) Fontana, A. et al 2006, A&A, 459, 745
- Forster Schreiber et al (2006) Forster Schreiber, N. M. et al 2006, ApJ, 645, 1062
- Forster Schreiber et al (2009) Forster Schreiber, N. M. et al 2009, arXiv:astro-ph/0903.1872v1
- Gawiser et al (2006) Gawiser, E. et al 06, ApJL, 642, 13
- Genel et al (2008) Genel, S. et al 2008, ApJ, 688, 789
- Giavalisco et al (1996) Giavalisco, M., Steidel, C. C., & Macchetto, F. 1996b, ApJ, 470, 189
- Giavalisco & Dickinson (2001) Giavalisco, M. 2001, ApJ, 550, 177
- Giavalisco (2002) Giavalisco, M. 2001, ARAA, 40, 579.
- Guzmán et al (1996) Guzmán, R., Koo, D. C., Faber, S. M., Illingworth, G. D., Takamiya, M., Kron, R. G. & Bershady, M. A. 1996, ApJ, 460, L5
- Guzmán et al (2003) Guzmán, R., Östlin, G., Kunth, D., Bershady, M. A., Koo, D. C. & Pahre, M. A. 2003, ApJ, 586, L45
- Heckman et al (2005) Heckman, T. M. et al 2005, ApJ, 619, L35
- Hoopes et al (2007) Hoopes, C. G. et al 2007, ApJS, 173, 441
- Huang et al (2005) Huang, J.-S. et al 2005, ApJ, 634, 137
- Ivison et al (2005) Ivison, R. J., Smail, I., Bentz, M., Stevens, J. A., Menéndez-Delmestre, K., Chapman, S. C., & Blain, A. W. 2005, MNRAS, 362, 535
- Iwatat et al (2007) Iwata, I., Ohta, K., Tamura, N., Akiyama, M., Aoki, K., Ando,M., Kiuchi, G. & Sawicki, M. 2007, MNRAS, 376, 1557
- Kampczyk et al (2007) Kampczyk, P. et al 2007, ApJS, 172, 329
- van Kampen & Crawford (2007) van Kampen, E. & Crawford, M. 2007, in Afonso et al., eds., ASP Conference Series, Vol. 380, p. 297
- Kartaltepe et al (2007) Kartaltepe, J.S. et al 2007, ApJS, 172, 320
- Kashikawa et al (2006) Kashikawa, M. et al 2006, ApJ, 637, 631
- Kobulnicky & Gebhardt (2000) Kobulnicky, H. A. & Gebhardt, K. 2000, AJ, 119, 1608
- Kriek et al (2006) Kriek, M. et al 2006, ApJ, 649, L71
- Labbe et al (2005) Labbe, I. et al 2005, ApJ, 624, L81
- Labbe et al (2006) Labbe, I., Bouwens, R., Illingworth, G. D. & Franx, M. 2006, ApJ, 649, L67
- Lai et al (2007) Lai, K., Huang, J.-S., Fazio, G., Cowie, L. L., Hu, E. M. & Kakazu, Y. 2007, ApJ, 655, 704
- Laird et al. (2005) Laird E. S., Nandra, K., Adelberger, K. L., Steidel, C. C., & Reddy, N. A 2005, MNRAS, 359, 47
- Laird et al (2006) Laird, E. S., Nandra, K., Hobbs, A. & Steidel, C. C. 2006, MNRAS, 373, 217
- Lehnert et al (2009) Lehnert, M.D. et al 2009, ApJ, 699, 1660
- Lin et al (2004) Lin, L. et al 2004, ApJ, 617, L9
- Lin et al (2007) Lin, L. et al 2007, ApJ, 660, 51L
- Lotz et al (2006a) Lotz, J. M., Madau, P., Giavalisco, M., Primack, J. & Ferguson, H. C. 2006, ApJ, 636, 592
- Lowenthal et al (1997) Lowenthal, J. D., Koo, D. C., Guzmán, R., Gallego, J., Phillips, A. C., Faber, S. M., Vogt, N. P., Illingworth, G. D., & Gronwall, C. 1997, ApJ, 481, 673
- Lowenthal et al (2005) Lowenthal, J. D., Durham, R. N., Lyons, B. J., Bershady, M. A., Gallego, J., Guzman, R. & Koo, D. C. 2005, Starbursts: From 30 Doradus to Lyman Break Galaxies, eds. R. de Grijs and R.M. González Delgado, p. 17
- Maller et al (2006) Maller, A. H., Katz, N. , Keres, D., Davé, R. & Weinberg, D. H. 2006, ApJ, 647, 763
- McCarthy et al (2004) McCarthy, P.J. et al 2004, ApJ, 614, L9
- Mihos & Hernquist (1996) Mihos, J. C. & Hernquist, L. 1996, ApJ, 464, 641
- Mo et al (1999) Mo, H. J., Mao, S. & White, S. D. M. 1999, MNRAS, 304, 175
- Navarro et al (1997) Navarro, J. F., Frenk, C. & White, S. D. M. 1997, ApJ, 490, 493
- Neufeld (1990) Neufeld, D. 1990, ApJ, 350, 216
- Nesvadba et al (2006) Nesvadba, N. P. H et al 2006, ApJ, 650, 661
- Nesvadba et al (2007) Nesvadba, N. P. H. et al 2007, ApJ, 657 725
- Night et al (2006) Night, C., Nagamine, K., Springel, V. & Hernquist, L. 2006, MNRAS, 366, 705
- Oke et al. (1995) Oke, J. B., Cohen, J. G., Carr, M., Cromer, J., Dingizian, A., Harris, F. H. 1995, PASP, 107, 375
- Östlin et al (2008) Östlin, G., Hayes, M., Kunth, D., Mas-Hesse, J.M., Leitherer, C., Petrosian, A. & Atek, H. 2008, arXiv:astroph/0803.1174v3
- Ouchi et al. (2001) Ouchi, M., et al. 2001, ApJ, 558, L83
- Paltani et al (2007) Paltani, S. et al 2007, A&A, 463, 873
- Papovich et al (2001) Papovich, C., Dickinson, M. & Ferguson, H.C. 2001, ApJ, 559, 620
- Papovich et al (2005) Papovich, C., Dickinson, M., Giavalisco, M., Conselice, C. J., & Ferguson, H. C. 2005, ApJ, 631, 101
- Perera et al (2008) Perera, T. A. et al 2008, MNRAS, 391, 1227
- Pettini et al (2000) Pettini, M., Steidel, C. C., Adelberger, K. L., Dickinson, M. & Giavalisco, M. 2000, ApJ, 528, 96
- Pettini et al (2001) Pettini, M., Shapley, A. E., Steidel, C.C., Cuby, J.-G., Dickinson, M., Moorwood, A.F.M., Adelberger, K.L. & Giavalisco, M. 2001 ApJ, 554, 981
- Phillips et al (1997) Phillips, A. C., Guzmán, R., Gallego, J., Koo, D. C., Lowenthal, J.D., Vogt, N. P., Faber, S. M., & Illingworth, G. D. 1997, ApJ, 489, 543
- Pisano et al (2001) Pisano, D. J., Kobulnicky, H. A., Guzm/’an, R., Gallego, J. & Bershady, M.A. 2001, AJ, 122, 1194
- Ravindranath et al (2006) Ravindranath, S. et al 2006, ApJ, 652, 963
- Reddy & Steidel (2004) Reddy, N. A. & Steidel, C. C. 2004, ApJ, 603, L13
- Reddy et al (2006) Reddy, N. A., Steidel, C. C., Fadda, D., Yan, L, Pettini, M., Shapley, A. E., Erb, D. K. &Adelberger, K. L. 2006, ApJ, 644, 792
- Rettura et al (2006) Rettura, A. et al 2006, A&A, 458, 717
- Rigopoulou et al (2006) Rigopoulou, D. et al 2006, ApJ, 648, 81
- Rudnick et al (2006) Rudnick, G. et al 2006, ApJ, 650, 624
- Sawicki & Yee (1998) Sawicki, M., & Yee, H. K. C. 1998, AJ, 115, 1329
- Sawicki & Thompson (2006) Sawicki, M. & Thompson, D. 2006, ApJ, 642, 653
- Scott et al (2008) Scott, K. S. et al 2008, MNRAS, 385, 2225
- Shapley et al (2001) Shapley, A. E., Steidel, C. C., Adelberger, K. L., Dickinson, M., Giavalisco, M., & Pettini, M. 2001, ApJ, 562, 95
- Shapley et al (2003) Shapley, A.E., Steidel, C.C., Pettini, M. & Adelberger, K.L. 2003, ApJ, 588, 65
- Shapley et al (2004) Shapley, A. E., Erb, D. K., Pettini, M., Steidel, C. C., & Adelberger, K. L. 2004, ApJ, 612, 108
- Shapley et al (2005) Shapley, A. E., Steidel, C. C., Erb, D. K., Reddy, N. A., Adelberger, K. L., Pettini, M., Barmby, P., & Huang, J. 2005, ApJ, 626, 698
- Shapley et al (2006) Shapley, A. E., Steidel, C. C., Erb, D. K., Reddy, N. A., Adelberger, K. L., Pettini, M., Barmby, P., & Huang, J. 2005, ApJ, 626, 698
- Shimasaku et al (2006) Shimasaku, K. et al 2006, PASJ, 58, 313
- Shu et al (2001) Shu, C., Mao, S. & Mo, H. J. 2001, MNRAS, 327, 895
- Smail et al (2002) Smail, I., Ivison, R. J., Blain, A. W., & Kneib, J.-P 2002, MNRAS, 331, 495
- Sofue & Rubin (2001) Sofue, Y. & Rubin, V. 2001, Ann. Rev. Astron. Astrophys., 39, 137-174
- Somerville et al (2001) Somerville, R. S., Primack, J. R., & Faber, S. M. 2001, MNRAS, 320, 504
- Steidel et al. (1996a) Steidel, C. C., Giavalisco, M., Pettini, M., Dickinson, M., & Adelberger, K. L. 1996, ApJL, 462, 17
- Steidel et al. (1996b) Steidel, C. C., Giavalisco, M., Dickinson, M., & Adelberger, K. L. 1996, AJ, 112, 352
- Steidel et al. (2003) Steidel, C.C., Adelberger, K.L., Shapley, A.E., Pettini, M., Dickinson, M. & Giavalisco, M. 2003, ApJ, 592, 728
- Steidel et al. (2004) Steidel, C.C., Shapley, A. E., Pettini, M., Adelberger, K. L., Erb, D. K., Reddy, N. A., & Hunt, M. P. 2004, ApJ, 604, 534
- Tenorio-Tagle et al (2004) Tenorio-Tagle, G., Terlevich, E., Terlevich, R., Mas-Hesse, J. M. & Leitherer, C. 2004, in The Formation and Evolution of Massive Young Star Clusters, ASP Conf Ser v 322, eds. H.J.G.L.M. Lamers, L.J. Smith, and A. Nota, p. 525
- Thompson (2003) Thompson, R. 2003, ApJ, 596, 748
- Tinker et al. (2006) Tinker, J.L., Norberg, P., Weinberg, D.H. & Warren, M.S. 2007, ApJ, 659, 877
- Verhamme et al (2006) Verhamme, A., Schaerer, D. & Maselli, A. 2006, A&A, 460, 397
- Verma et al (2007) Verma, A., Lehnert, M. D., Förster Schreiber, N. M., Bremer, M. N. & Douglas, L. 2007, MNRAS, 377, 1024
- Wechsler et al (2001) Wechsler, R. H., Somerville, R. S., Bullock, J. S., Kolatt, T S., Primack, J. R., Blumenthal, G. R. & Dekel, A. 2001, ApJ, 554, 85
- Weinberg et al (2002) Weinberg, D. H., Hernquist, L. & Katz, N. 2002, ApJ, 571, 15
- Williams et al (1996) Williams, R.E. et al 1996, AJ, 112, 1335
- Wirth et al. (2004) Wirth, G.D. et al 2004, AJ, 127, 3121
- Wolf et al (2005) Wolf, C. et al 2005, ApJ, 630, 771
- Wolfe (1986) Wolfe, A. M. 1986, Phil. Trans. Roy. Soc. Lond., 321, 503
- Yan et al (2005) Yan, H. et al 2005, ApJ, 634, 109
- Yan et al (2006) Yan, H., Dickinson, M., Giavalisco, M., Stern, D., Eisenhardt, P. R. M. & Ferguson, H. C. 2006, ApJ, 651, 24
- Yee et al (1996) Yee, H. K. C., Ellingson, E., Bechtold, J., Carlberg, R. G., & Cuillandre, J.-C. 1996, AJ, 111, 1783
- Yoshida et al (2006) Yoshida, M. et al 2006, ApJ, 653, 988
- Younger et al. (2007) Younger, J. et al 2007, ApJ, submitted
- Zaritsky et al (1993) Zaritsky, D., Smith, R., Frenk, C. & White, S.D.M. 1993, ApJ, 405, 464
- Zepf et al. (1997) Zepf, S.E., Moustakas, L.A. & Davis, M. 1997, ApJ, 474, L1
- Zhao et al (2002) Zhao, D., Jing, Y. P. & Börner, G. 2002, ApJ, 581, 876
- Zhao et al (2003a) Zhao, D. H., Mo, H. J., Jing, Y. P. & Börner, G. 2003a, MNRAS, 339, 12
- Zhao et al (2003b) Zhao, D. M., Jing, Y. P., Mo, H. J. & Börner 2003b, ApJ, 597, L9
| Date (UT) |
|---|
| 1997 May 5-6 |
| 1997 May 30 - June 1 |
| 1997 June 6 |
| 1998 April 28 – May 1 |
| 1998 May 23-25 |
| 1999 April 15-18 |
Note. — The Low Resolution Imaging Spectrograph with a 600 l mm-1 grating blazed at 5000Å and slit widths of 11 were used for all observing runs, giving spectral resolution about 300 FWHM (130 gaussian ).
| NameaaTarget names are as in Lowenthal et al (1997) and are in one of two forms: (1) hd_xxxx_yyyy, where is 2, 3, or 4 and represents the WFPC2 CCD chip in which the source falls, and xxxx and yyyy are the pixel coordinates of the source on that chip in the HDF Version 1 catalog, which was used for original target selection; or, (2) for some of the brightest targets, C-0 from Steidel et al. (1996b). Targets are listed in order of increasing RA. | HDFv2 bbSource name from HDF Version 2 catalog of Williams et al (1996), matched to our target by positional proximity and visual confirmation via the HDF images. | RA (2000)ccJ2000 equatorial coordinates of each target from the HDF Version 2 catalogs Williams et al (1996). | DEC (2000)ccJ2000 equatorial coordinates of each target from the HDF Version 2 catalogs Williams et al (1996). | dd AB isophotal magnitude from the HDF Version 1 catalog, used for original target selection. | PAeePosition angle(s) (degrees east of north) of slitlet used to observe target. | ffTotal integration time on target at all PAs. |
|---|---|---|---|---|---|---|
| mag | ∘ | ks | ||||
| hd4_0259_1947 | 4-916 | 12:36:38.605 | 62:12:33.83 | 25.080 | 110, 26.0 | 21.6 |
| hd4_1076_1847 | 4-878 | 12:36:40.963 | 62:12:05.30 | 24.009 | 26.0, 137.0 | 24.5 |
| C4-09 | 4-858 | 12:36:41.245 | 62:12:03.07 | 24.904 | 98.0, 136.9 | 21.6 |
| hd4_0818_1037 | 4-445 | 12:36:44.640 | 62:12:27.39 | 24.586 | 190.0, 26.0 | 24.5 |
| hd4_0298_0744 | 4-316 | 12:36:45.087 | 62:12:50.81 | 24.983 | 145.0 | 24.5 |
| C4-06 | 4-555.1 | 12:36:45.409 | 62:11:53.18 | 24.190 | 43.0 | 25.5 |
| hd4_1006_0680 | 4-289 | 12:36:46.947 | 62:12:26.08 | 26.082 | 73.0 | 9.9 |
| hd4_1486_0880 | 4-382 | 12:36:46.951 | 62:12:05.34 | 24.957 | 13.0, 26.0 | 25.5 |
| hd4_0367_0266 | 4-52 | 12:36:47.720 | 62:12:55.79 | 25.579 | 26.0, 108.0 | 21.6 |
| hd2_1928_1041 | 2-454 | 12:36:48.266 | 62:14:18.42 | 25.081 | 165.0 | 25.5 |
| C2-05 | 2-449 | 12:36:48.338 | 62:14:16.63 | 24.249 | 165.0 | 25.5 |
| hd2_1739_1258 | 2-585 | 12:36:49.811 | 62:14:15.18 | 24.399 | 6.5, 148.0 | 38.9 |
| hd2_1398_1164 | 2-525 | 12:36:50.123 | 62:14:01.03 | 25.596 | 83.0 | 9.9 |
| C3-02 | 3-550 | 12:36:51.335 | 62:12:27.51 | 25.706 | 174.0 | 25.5 |
| hd2_0698_1297 | 2-604 | 12:36:52.451 | 62:13:37.84 | 25.787 | 42.0, 58.0 | 41.9 |
| hd2_0705_1366 | 2-637 | 12:36:52.760 | 62:13:39.09 | 25.916 | 42.0, 58.0 | 41.9 |
| hd2_0529_1567 | 2-751 | 12:36:54.205 | 62:13:35.83 | 27.233 | 28.9, 31.0 | 38.9 |
| hd2_0624_1688 | 2-824 | 12:36:54.627 | 62:13:41.37 | 26.139 | 28.9, 31.0 | 38.9 |
| hd2_0725_1818 | 2-903 | 12:36:55.077 | 62:13:47.00 | 25.406 | 28.9, 31.0 | 50.0 |
| hd2_0743_1844 | 2-916 | 12:36:55.184 | 62:13:48.07 | 26.214 | 28.9, 31.0 | 50.0 |
| hd3_1633_1909 | 3-853 | 12:36:58.967 | 62:12:23.42 | 25.708 | 77.0 | 21.6 |
| hd3_1824_1945 | 3-875 | 12:37:00.127 | 62:12:25.22 | 24.671 | 77.0 | 21.6 |
| NameaaTarget names are as in Lowenthal et al (1997) and are in one of two forms: (1) hd_xxxx_yyyy, where is 2, 3, or 4 and represents the WFPC2 CCD chip in which the source falls, and xxxx and yyyy are the pixel coordinates of the source on that chip in the HDF Version 1 catalog, which was used for original target selection; or, (2) for some of the brightest targets, C-0 from Steidel et al. (1996b). Targets are listed in order of increasing RA. | HDFv2 bbSource name from HDF Version 2 catalog of Williams et al (1996), matched to our target by positional proximity and visual confirmation via the HDF images. | RA (2000)ccJ2000 equatorial coordinates of each target from the HDF Version 2 catalogs Williams et al (1996). | DEC (2000)ccJ2000 equatorial coordinates of each target from the HDF Version 2 catalogs Williams et al (1996). | dd AB isophotal magnitude from the HDF Version 1 catalog, used for original target selection. |
|---|---|---|---|---|
| mag | ||||
| hd4_0460_1146 | 4-491 | 12:36:43.253 | 62:12:38.85 | 25.680 |
| hd4_1994_1406 | 4-631 | 12:36:45.310 | 62:11:38.47 | 26.269 |
| hd2_1949_0599 | 2-239 | 12:36:45.886 | 62:14:12.09 | 25.342 |
| hd4_1341_0299 | 4-85 | 12:36:49.515 | 62:12:20.11 | 26.103 |
| hd3_0408_0684 | 3-243 | 12:36:49.814 | 62:12:48.80 | 25.985 |
| hd2_0664_0879 | 2-373 | 12:36:50.302 | 62:13:29.73 | 25.951 |
| hd2_1410_1282 | 2-594 | 12:36:50.683 | 62:14:03.15 | 26.098 |
| hd3_0378_1536 | 4-677 | 12:36:51.620 | 62:12:17.31 | 25.979 |
| hd3_0457_2023 | 3-915 | 12:36:53.107 | 62:12:00.74 | 25.770 |
| hd2_0434_1377 | 2-643 | 12:36:53.422 | 62:13:29.53 | 25.457 |
| hd3_1455_0430 | 3-118 | 12:36:54.727 | 62:13:14.72 | 25.141 |
| NameaaTargets are listed in order of increasing RA, as in Table 2. | bbRedshift derived from Ly emission line wavelength or stellar and/or interstellar absorption line wavelengths (for ) or optical nebular emission lines (for ). Typical uncertainties are 0.001 in . Values in parenthesis indicate redshifts published by others that we were unable to confirm or refute. For details on redshifts listed as ranges or limits, see text. | ccRedshift quality. no spectrum obtained; highly uncertain, no definitive features identified; real features are evident but the redshift is not secure; redshift probable, with two or more spectral features identified; redshift definite, with multiple spectral features identified. | Feature(s)ddSpectroscopic feature(s) used for measuring dynamical mass. Ly is in emission only; all others are in absorption only. | Remarks |
|---|---|---|---|---|
| hd4_0259_1947 | 0.207 | 2 | – | new |
| hd4_1076_1847 | 1 | – | Possible Mg II abs | |
| C4-09 | 3.226 | 4 | Ly | quadruple knot |
| hd4_0818_1037 | (2.500) | 1 | – | – |
| hd4_0298_0744 | 1 | – | – | |
| C4-06 | 2.794 | 4 | Si II, O I, C II, Si IV | “Hot Dog” |
| hd4_1006_0680 | 2.969 | 3 | Ly | double knot and em. peak |
| hd4_1486_0880 | 1 | – | – | |
| hd4_0367_0266 | 2.931 | 3 | – | – |
| hd2_1928_1041 | 2.005 | 4 | Si II, O I, C II, Si IV, C IV, Al II | C2-06; pair with C2-05 |
| C2-05 | 2.008 | 4 | Si II, O I, C II, Si IV, C IV, Al II | pair with hd2_1928_1041 |
| hd2_1739_1258 | 0.897 | 2 | – | new |
| hd2_1398_1164 | 2.236 | 3 | Ly | |
| C3-02 | 2.316 | 2 | – | unlikely; new |
| hd2_0698_1297 | 3.439 | 4 | Ly | pair with hd2_0705_1366 |
| hd2_0705_1366 | 3.370 | 4 | Ly | pair with hd2_0698_1297 |
| hd2_0529_1567 | 2.268 | 4 | Ly | new ; pair with hd2_0624_1688 |
| hd2_0624_1688 | 2.424 | 4 | Ly | pair with hd2_0529_1567 |
| hd2_0725_1818 | 2.232 | 4 | O I, Si II, Al II | pair with hd2_0743_1844 |
| hd2_0743_1844 | 2.230 | 3 | O I, Si II, Al II | new ; pair with hd2_0725_1818 |
| hd3_1633_1909 | 4.056 | 3 | Ly | |
| hd3_1824_1945 | 1 | – |
| Mass from Ly Linewidth | Mass from Extended Emission | |||||||
|---|---|---|---|---|---|---|---|---|
| NameaaTargets are listed in order of increasing RA, as in Table 2. | bbFWHM of Ly emission line measured from the 1D spectrum and deconvolved with the spectral resolution Å. Typical uncertainties are . | ccHalf-light radius as measured in the HDF images. Uncertainties are typically 005. | ddAs in , but transformed from arcseconds to kpc using our adopted flat cosmology with . Uncertainties are kpc. | eeDynamical mass calculated from . Uncertainties (based solely on uncertainties in and and neglecting uncertainties due to non-virial motions, extended stellar or dark matter components, source inclination, outflows, etc.) on the values in this column are . | ffObserved velocity spread of kinematic feature(s). For close pairs, the velocity separation is entered twice, once for each component. Typical uncertainties are . | ggEffective spatial size, spread, or separation as measured in the HDF images. Uncertainties are typically 01. | hhAs in , but transformed from arcseconds to kpc using our adopted flat cosmology with . Uncertainties are kpc. | iiDynamical mass calculated from . For close pairs, the mass represents the mass of the system and is entered twice, once for each component. Uncertainties (based solely on uncertainties in and and neglecting uncertainties due to non-virial motions, extended stellar or dark matter components, source inclination, outflows, etc.) on the values in this column are . |
| () | (arcsec) | ( kpc) | () | () | (arcsec) | ( kpc) | () | |
| hd4_0259_1947 | – | – | – | – | – | – | – | – |
| hd4_1076_1847 | – | – | – | – | – | – | – | – |
| C4-09 | 0.14 | 1.0 | 820 | |||||
| 0.14 | 1.0 | – | – | – | – | |||
| hd4_0818_1037 | – | – | – | – | – | – | – | – |
| hd4_0298_0744 | – | – | – | – | – | - | – | – |
| C4-06 | – | – | – | – | 3.2 | 24.8 | ||
| hd4_1006_0680 | 300 | 0.22 | 1.7 | 677 | 0.3 | 2.3 | ||
| hd4_1486_0880 | – | – | – | – | – | - | – | – |
| hd4_0367_0266 | – | – | – | – | – | - | – | – |
| hd2_1928_1041 | – | – | – | – | 390 | 2.0 | 16.5 | |
| C2-05 | – | – | – | – | 390 | 2.0 | 16.5 | |
| hd2_1739_1258 | – | – | – | – | – | – | – | – |
| hd2_1398_1164 | 0.26 | 2.2 | – | – | – | – | ||
| C3-02 | – | – | – | – | – | – | – | – |
| hd2_0698_1297 | 0.45 | 3.3 | 4707 | 2.7 | 19.6 | |||
| hd2_0705_1366 | 0.14 | 1.0 | 4707 | 2.7 | 19.8 | |||
| hd2_0529_1567 | 0.12 | 1.0 | 1394 | 6.3 | 50.7 | |||
| hd2_0624_1688 | 0.31 | 2.5 | 1394 | 6.3 | 50.1 | |||
| hd2_0725_1818 | – | – | – | – | 1.3 | 10.6 | ||
| hd2_0743_1844 | – | – | – | – | 1.3 | 10.6 | ||
| hd3_1633_1909 | 330 | 0.64 | 4.5 | – | – | – | – | |
| hd3_1824_1945 | – | – | – | – | – | – | – | – |
| NameaaTargets are listed in order of increasing RA, as in Table 2. | HNM IDbbIdentification number(s) of object(s) in HDF NICMOS Mosaic catalog of Papovich et al (2005) with coordinates matching those of target galaxy. | ccSeparation in arcseconds between our target coordinates and those of matching HNM source. | ddRedshift used by Papovich et al (2005) to fit stellar population model. A value of -1.000 indicates that no spectroscopic or photometric redshift was available. | eeStellar mass from Papovich et al (2005). A value of 0.00 indicates that no spectroscopic or photometric redshift was available. |
|---|---|---|---|---|
| (arcsec) | () | |||
| hd4_0259_1947 | 748 | 0.01 | -1.000 | 0.00 |
| hd4_1076_1847 | 1078 | 0.02 | 0.882 | 2.20E9 |
| C4-09 | 1114 | 0.57 | 3.216 | 7.84E8 |
| 1115 | 0.13 | 3.216 | 3.56E9 | |
| hd4_0818_1037 | 989 | 0.04 | 1.444 | 6.68E9 |
| hd4_0298_0744 | 782 | 0.54 | 1.761 | 4.21E9 |
| C4-06 | 1357 | 0.06 | 2.803 | 1.1E10 |
| 1358 | 1.28 | 2.803 | 4.60E9 | |
| hd4_1006_0680 | 1063 | 0.07 | 2.969 | 4.16E8 |
| hd4_1486_0880 | 1282 | 0.02 | -1.000 | 0.00 |
| hd4_0367_0266 | 813 | 0.04 | 2.931 | 7.34E9 |
| 814 | 1.06 | 2.931 | 1.8E10 | |
| hd2_1928_1041 | 109 | 0.23 | 2.009 | 2.81E9 |
| C2-05 | 110 | 0.27 | 2.005 | 9.70E9 |
| hd2_1739_1258 | 162 | 0.68 | 1.980 | 1.37E9 |
| 163 | 0.41 | 1.980 | 2.3E10 | |
| hd2_1398_1164 | 274 | 0.25 | 2.237 | 4.75E9 |
| C3-02 | 1179 | 0.23 | 2.218 | 1.25E9 |
| hd2_0698_1297 | 553 | 0.35 | 3.430 | 2.09E9 |
| hd2_0705_1366 | 516 | 0.13 | 3.368 | 1.77E9 |
| hd2_0529_1567 | 616 | 0.08 | 2.161 | 2.50E8 |
| hd2_0624_1688 | 561 | 0.10 | 2.419 | 8.61E8 |
| hd2_0725_1818 | 503 | 0.16 | 2.233 | 1.47E9 |
| hd2_0743_1844 | 503 | 1.30 | 2.233 | 1.47E9 |
| hd3_1633_1909 | 1499 | 0.48 | 2.175 | 4.88E8 |
| 1506 | 0.99 | 4.050 | 1.36E9 | |
| hd3_1824_1945 | 1513 | 0.38 | 2.050 | 4.15E9 |
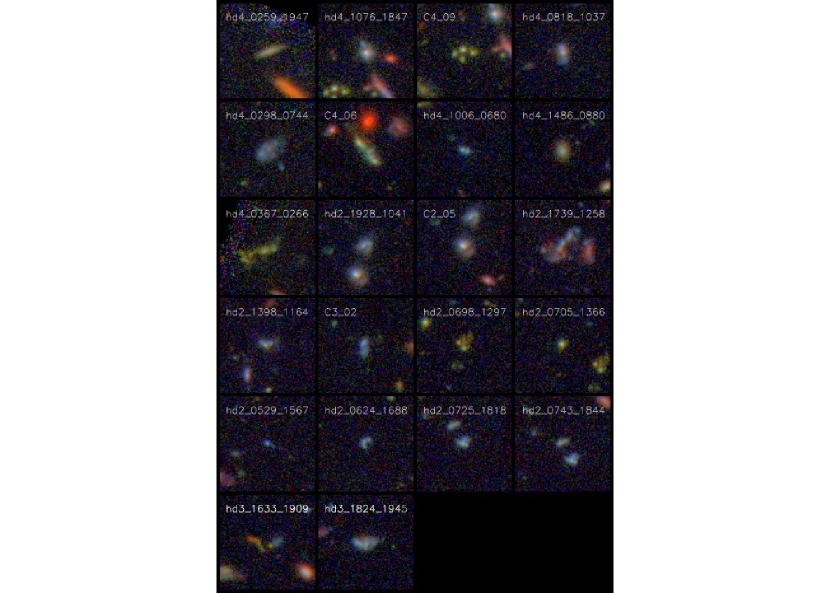
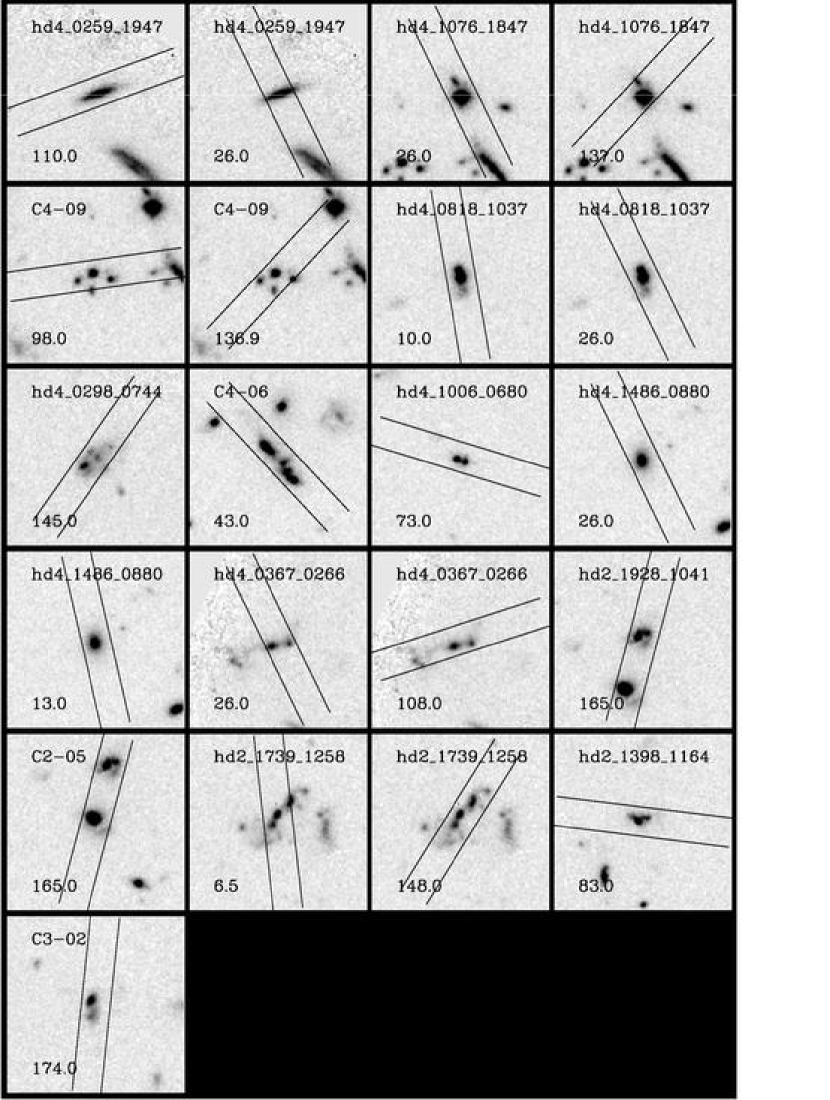
![[Uncaptioned image]](/html/0907.4380/assets/x3.png)
Fig. 2. — Continued.
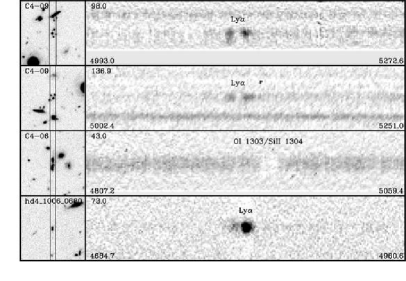
![[Uncaptioned image]](/html/0907.4380/assets/x5.png)
Fig. 3. — Continued.
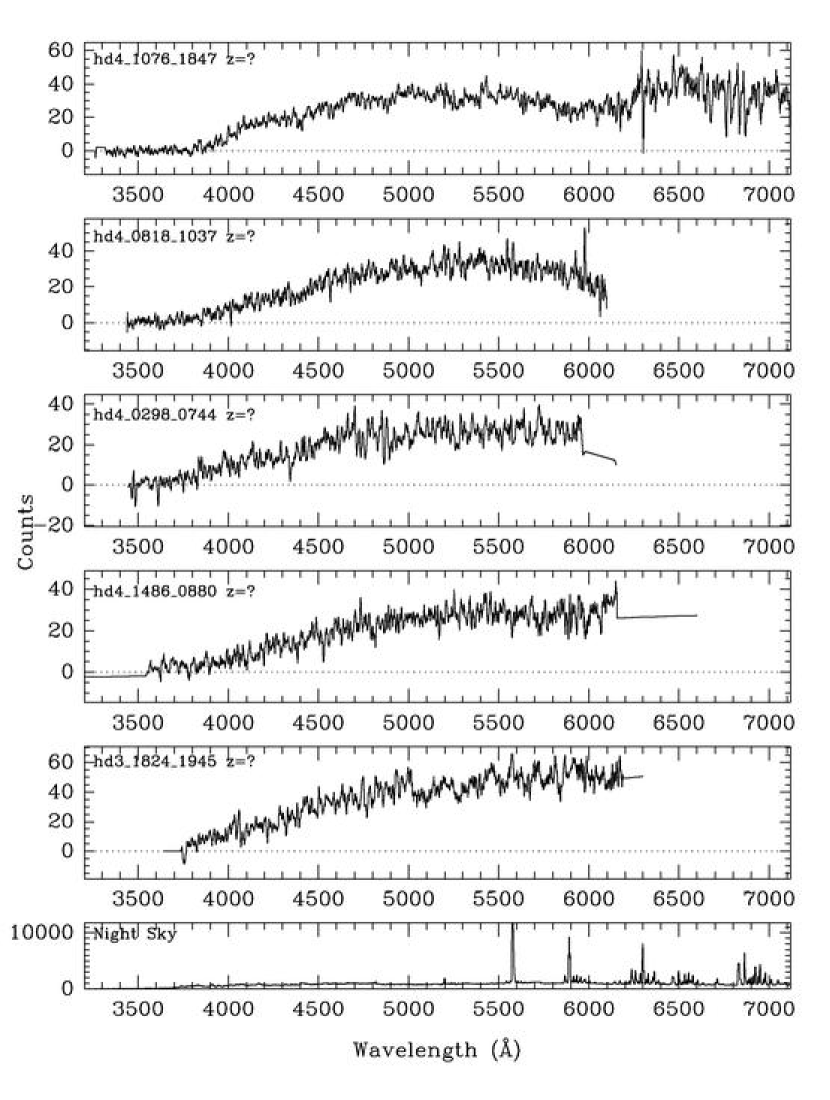
![[Uncaptioned image]](/html/0907.4380/assets/x7.png)
Fig. 4. — Continued.
![[Uncaptioned image]](/html/0907.4380/assets/x8.png)
Fig. 4. — Continued.
![[Uncaptioned image]](/html/0907.4380/assets/x9.png)
Fig. 4. — Continued.
![[Uncaptioned image]](/html/0907.4380/assets/x10.png)
Fig. 4. — Continued.