The Quiescent Spectral Energy Distribution of V404 Cyg
Abstract
We present a multiwavelength study of the black hole X-ray binary V404 Cyg in quiescence, focusing upon the spectral energy distribution (SED). Radio, optical, UV, and X-ray coverage is simultaneous. We supplement the SED with additional non-simultaneous data in the optical through infrared where necessary. The compiled SED is the most complete available for this, the X-ray and radio brightest quiescent black hole system. We find no need for a substantial contribution from accretion light from the near-UV to the near-IR, and in particular the weak UV emission constrains published spectral models for V404 Cyg. We confirm that no plausible companion spectrum and interstellar extinction can fully explain the mid-IR, however, and an IR excess from a jet or cool disc appears to be required. The X-ray spectrum is consistent with a power-law as found by all other studies to date. There is no evidence for any variation in the hardness over a range of a factor of 10 in luminosity. The radio flux is consistent with a flat spectrum (in ). The break frequency between a flat and optically thin spectrum most likely occurs in the mid or far-IR, but is not strongly constrained by these data. We find the radio to be substantially variable but with no clear correlation with X-ray variability.
keywords:
accretion, accretion discs—binaries: close – stars: individual: V404 Cyg1 Introduction
The question of how accretion onto a black hole occurs has been of great and ongoing interest. Observations of accreting sources provide a test of astrophysics in the strong gravity regime and will potentially yield a signature of the presence of an event horizon around black holes. Recent advances in X-ray technology have revealed that accretion can occur at extremely low rates across the range of black hole masses from stellar remnants to supermassive black holes at the centre of our own and other galaxies. However, the nature of that low-level accretion remains unclear (see e.g., Narayan & McClintock 2008). Accretion flows at low luminosities do appear to be radiatively inefficient, but we have yet to determine to what extent that arises from advection of hot gas through the event horizon, and what role jets may play in carrying away energy (Fender et al., 2003). These low-level accreting black holes emit across the electromagnetic spectrum from radio to X-rays, so multiwavelength studies can be used to disentangle different sources from different regions of the inflow, outflow, or jet, and to establish causal connections between behavior in these regions.
Among the stellar mass black hole population, the best studied quiescent system for this purpose has been V404 Cyg, which contains a compact object with a mass function of M⊙ (Casares & Charles, 1994) – one of the most secure stellar mass black hole mass determinations we have. V404 Cyg has the longest orbital period of the black hole X-ray transients (BHXRTs), at 6.5 days, with a K0 IV companion star (Casares et al., 1993). It is also the most luminous stellar mass black hole in quiescence with erg s-1, brighter than the prototypical BHXRT, A 0620–00 (Garcia et al., 2001). These extremes are unlikely to be coincidental and the high may be a consequence of the long orbital period, the evolved donor star, and/or the high mass of the black hole.
Attempts to relate observations of quiescent black hole binaries to theoretical models of accretion flows have focused upon fitting the broad-band spectral energy distribution, ideally with coverage from radio to X-ray energies. V404 Cyg has been a prime target due to its X-ray brightness (Narayan et al., 1996; , Narayan et al.1997; Quataert & Narayan, 1999). These studies mainly focused on pure accretion models and only considered the optical to X-ray regime, as radio data were limited or non-existent. Attempts to apply advective models to the more luminous hard state (e.g. Esin et al. 2001) brought home the fact that these models could not explain the ubiquitous radio emission in this state, that was sometimes seen to extend as far as the near-IR band. A more complete description of the low-state SED appears to require a coupled accretion plus outflow model (Markoff et al 2001; Yuan et al. 2005). More recent studies have revealed significant radio emission in quiescence too, from V404 Cyg (Gallo et al., 2005), and from A 0620–00 (Gallo et al., 2006) providing support to the idea that an outflow also plays a significant role in quiescence.
To facilitate comparison between developing models and data we present here the most complete SED available for V404 Cyg. It is primarily based on a simultaneous campaign performed in 2003 using Chandra, HST, and several optical and radio observatories. We supplement the coverage with non-simultaneous optical and near-IR data from Casares et al. (1993) and near to mid-IR Spitzer data from Muno & Mauerhan (2006) and Gallo et al. (2007). Previous results from this campaign were presented by Hynes et al. (2004); see also Corbel et al. (2008).
2 Observations
2.1 HST ultraviolet data
Ultraviolet photometry used the Advanced Camera for Surveys (ACS; Boffi et al. 2007) onboard the Hubble Space Telescope (HST). The observations performed are summarised in Table 1. V404 Cyg is a faint UV source and reddened, so five orbits were used covering the F250W and F330W filters.
| Date | UT Start | Duration (s) | Filter |
|---|---|---|---|
| 2003 July 28 | 19:13:10 | 200 | F330W |
| 2003 July 28 | 19:19:08 | 400 | F250W |
| 2003 July 28 | 19:28:22 | 200 | F330W |
| 2003 July 28 | 19:34:20 | 400 | F250W |
| 2003 July 28 | 20:28:46 | 200 | F330W |
| 2003 July 28 | 20:34:44 | 400 | F250W |
| 2003 July 28 | 21:09:32 | 200 | F330W |
| 2003 July 28 | 22:00:19 | 400 | F250W |
| 2003 July 28 | 22:09:33 | 200 | F330W |
| 2003 July 28 | 22:25:28 | 400 | F250W |
| 2003 July 28 | 22:34:42 | 200 | F330W |
| 2003 July 28 | 22:40:40 | 400 | F250W |
| 2003 July 28 | 23:38:31 | 980 | F250W |
| 2003 July 29 | 01:18:45 | 980 | F250W |
| 2003 July 29 | 04:26:38 | 980 | F250W |
We used standard ACS techniques to reduce the data. Individual images had been pre-processed to the flat-fielded stage using the automatic pipeline, CALACS; we found no need to refine this reduction. We then combined all of the images offline into a geometrically corrected master image using Multidrizzle (Koekemoer et al., 2002) with standard settings. We found excellent registration between individual images, so no need to improve the shifts applied.
We performed photometry using the IDL/AstroLib aperture photometry routine aper. As V404 Cyg is faint we used a relatively small aperture to perform photometry, of radius 0.125″, with background defined by a 2.5″ annulus. No stars in the field were bright enough to determine per-field aperture corrections, so we use the tabulated values from Sirianni et al. (2005). This aperture collects about 75 % of the total light, and almost all of the sharp core of the point spread function. We measured the position of the target in the F330W bandpass and then fixed it for F250W, after verifying that it was consistently placed in the two. We note in passing that we do detect both V404 Cyg and the nearby contaminating star. We find an offset of the contaminating star relative to V404 Cyg of sec (″) and ″, an improvement on the relative astrometry of the stars compared to that reported by Casares et al. (1993).
A significant source of systematic uncertainty in ACS photometry is charge transfer inefficiency (CTI) due to radiation damage to the CCDs (Riess & Mack 2004; Pavlovsky et al. 2005), although fortunately the observations were performed early enough in the lifetime of ACS that CTI is unlikely to be a severe problem. The effect is worst at low light levels, so maximised for faint UV sources. CTI is also least well calibrated for these cases, and the correction prescriptions provided by Pavlovsky et al. (2005) formally diverge for negligible sky background or source counts. We face both problems with these data. Sky backgrounds in the near-UV are extremely low, dominated by zodiacal light and earthshine in the F330W bandpass, and geo-coronal emission at shorter wavelengths. Both were essentially unmeasurable in our images, and the background is expected to be dominated by CCD dark current, producing 0.5–2.0 e-/pixel for our exposures. We attempted to estimate the CTI losses in two ways. Firstly, we followed the prescription in Pavlovsky et al. (2005), except that we used the estimated background (including the dominant dark current term) from the ACS Exposure Time Calculator. This prescription predicted losses of %. Based on the actual data shown by Riess & Mack (2004) however, this prescription appears to overestimate the CTI losses for the faintest sources. For the low background case (0.5–1.5 e-/pixel) at source brightnesses up to a few hundred electrons, Riess & Mack (2004) found losses of around 0.035 mag at maximum distance from the readout amplifier. If we rescale this to the times of our observations and positions of the source we expect losses of about 2.5 %. We use these latter estimates to correct our measured source brightnesses and assign an additional error estimate of 2.5 % to account for the uncertainty in applying CTI corrections. The uncertainties in the CTI corrections are much smaller than the statistical uncertainties in the measured fluxes, so this is not the dominant source of uncertainty.
We tabulate our photometric results in Table 2. Since we are measuring counts across a broad bandpass rather than monochromatic fluxes, we tabulate the data in two ways; the corrected number of electrons per second, and the average flux per unit wavelength using photometric zero-points estimated by the ACS pipeline. All have been corrected for CTI, and to a nominal infinite aperture.
| Band | Count rate | Flux |
|---|---|---|
| (s-1) | (erg cm-2 s-1 Å-1) | |
| Observed | ||
| F250W | ||
| F330W | ||
| Synthetic K0 iii | ||
| F250W | 0.073 | |
| F330W | 0.57 | |
| Synthetic K0 iii, truncated at 4200 Å | ||
| F250W | 0.024 | |
| F330W | 0.57 | |
2.2 IAC80 photometry
We obtained simultaneous band observations using the Thomson CCD camera at the 0.8 m IAC80 from 20:50–05:51 UT on the night of 2003 July 28/29. We used 300 s exposures with 52 s readout time between them and bias-corrected and flat-fielded all images in the standard way using IRAF111IRAF is distributed by the National Optical Astronomy Observatories, which are operated by the Association of Universities for Research in Astronomy, Inc., under cooperative agreement with the National Science Foundation.. Seeing conditions were not good enough to cleanly separate the contribution of the target and its nearby (1.4″) line-of-sight star (Udalski & Kaluzni, 1991) so we applied straightforward aperture photometry using a large aperture of 3.5″which adds the flux from both stars as described by Zurita et al. (2004). We determine an average magnitude in acceptably close agreement with Casares et al. (1993), indicating little difference in the optical brightness of the system compared to earlier data.
2.3 WHT optical spectroscopy
To reconstruct the optical SED of the source we use the WHT data from the program. This covered a larger range of wavelengths than the Gemini data, and was simultaneous with the HST observations. These observations used the ISIS dual-arm spectrograph on the WHT. To maximise efficiency and minimise readout time and noise, we used the single red-arm mode with the R316R grating and MARCONI2 CCD. We set exposure times to 200 s, with s dead-time between exposures. To maximise photometric accuracy, we used a 4″ slit, so our spectral resolution was determined by the seeing (median ″), and was typically Å (250 km s-1). We performed bias correction and flat fielding using standard IRAF techniques. The slit was oriented in the same was as in our previous observations and covered the same comparison star. We extracted spectra of both of these stars, and the nearby blended star, with the same techniques previously described (Hynes 2002; Hynes et al. 2002). We performed wavelength calibration relative to a single observation of a CuNe/CuAr lamp and corrected for time-dependent variations in the wavelength calibration using Telluric absorption features. We calibrated the on-slit comparison star relative to Kopff 27 (Stone, 1977), and then calibrated all spectra of V404 Cyg relative to this on-slit comparison.
To compare the WHT data with that from the IAC80 we perform synthetic photometry convolving the spectrum with a bandpass. We found an offset between the two, most likely due to systematic errors in the WHT calibration. Since the IAC80 photometry agrees well with earlier measures we assume that this calibration is correct and rescaled the WHT data up by a factor of 1.3 to agree with the IAC80 band data.
2.4 Gemini data
We used additional optical spectroscopy obtained with the R831 grating and standard EEV CCDs of the GMOS spectrograph on Gemini-N to extend our continuum lightcurve. Exposure times were 40 s and we binned and windowed the images to reduce the dead-time between exposures to 12 s. With a 5″ slit and 1.1″ median seeing we obtained a spectral resolution of 5.0 Å (230 km s-1). We performed data reduction, spectral extraction, and wavelength and flux calibration in the same way as for the WHT data. Wavelength calibration used a CuAr lamp, and we performed flux calibration relative to the same on-slit comparison star as used for the WHT observations, and applied the same rescaling to ensure consistency with IAC80 photometry.
2.5 Chandra X-ray data
We use data taken from two recent Chandra observations of V404 Cyg, one on 2000 April 26 for 10,295 s (Garcia et al. 2001, Kong et al. 2002), and another on 2003 July 28/29 for a total of 61,200 s (Hynes et al., 2004). The first observation used 1/4 sub-array mode, with time resolution of 1.14 s; while the second used 1/8 sub-array mode, with a resolution of 0.4 s. In the original set, 1587 counts were reported, while the second had 1941 counts. We reanalyzed the standard pipeline-processed level-2 data from both data sets in CIAO v3.2. The extraction aperture was set to a radius of 6-pixels and we retained only events between 0.3–7.0 keV to reduce the background. The background can be particularly significant for the S3 chip, so we used large background regions with a 48-pixel radius. The background produced approximately 4.6 counts in the source aperture for the 2003 observation, and 0.2 counts in the 2000 observation.
2.6 VLA radio data
VLA data were obtained in the A configuration from 29 July 00:20 UT until 14:15 UT. The data were reduced and each time bin imaged using standard procedures within AIPS. Absolute flux calibration was obtained relative to 3C 286.
2.7 WSRT radio data
The Westerbork Synthesis Radio Telescope (WSRT) observed V404 Cyg from 28 July 17:13 UT till 29 July 05:33 UT, corresponding to the period D1–F1–D2–F2 in Hynes et al. (2004) and labelled in Fig. 1. We used two frequencies: 4.8 and 1.4 GHz, with hours on source per frequency. The first hour was unusable because the source was too low on the horizon. The full 4.8 GHz observation (with useful coverage 18:40–05:13 UT) gives a flux density of mJy. At 1.4 GHz the average flux density was mJy.
2.8 Published Non-simultaneous Data
We supplement our dataset with non-simultaneous points from the literature to fill in gaps in coverage. The most comprehensive coverage of the optical-IR SED is from Casares et al. (1993), who present and photometry from a coordinated campaign obtained on 1990 June 10. These points do raise some concern that they were taken soon after the outburst and may not be fully quiescent. There is also a large gap, 13 years, relative to the recent data. Nonetheless, we find excellent agreement in between our simultaneous IAC80 photometry and the earlier data. Recent Spitzer data in the mid-IR have also been presented by Muno & Mauerhan (2006) and reanalysed by Gallo et al. (2007). We include these 4.5, 8.0, and 24 m photometry in the SED using Gallo’s data which differ significantly only in the 24 m measurement.

3 The UV, Optical, and IR Spectral Energy Distribution
3.1 Contamination of the band by H
Using the WHT spectrum we can estimate the contribution of line emission to the photometry and correct for this effect. The strongest line is H with an equivalent width of 16 Å. This translates to a change in magnitude of 0.01 mag, and we correct for this before using these data in the SED.
Casares et al. (1993) found a stronger line during 1990–91 with average equivalent width 38.7 Å. This suggests a larger contribution to the earlier photometry of %, and we use this value to correct the photometry of Casares et al. (1993). We note that in both cases this contamination is effectively negligible in comparison to other uncertainties.
3.2 Constraints on the optical disc contribution from variability
We expect the optical emission in quiescent BHXRTs to be a combination of light from the disc and light from the companion star. In the case of V404 Cyg, this is overwhelmingly dominated by the companion. Traditionally measures of the disc fraction use veiling of the photospheric lines of the companion star and are dependent on having high resolution spectra at the time of the observation. They can be rather sensitive to assumptions about the spectrum of the companion star (Hynes et al. 2006). Casares et al. (1993) investigated several methods of fitting the veiling at different wavelengths within the optical spectrum. Despite large uncertainties in their results, they conclude on approximate values of , , and , where the values refer to the fractional contribution of the disc to the total222Casares et al. (1993) quote slightly different values as they define the veiling as the disc light as a fraction of the stellar light. In the near-IR, Shahbaz et al. (1996) put an upper limit on the band veiling of .
We cannot make a reliable determination of the disc fraction from our low resolution spectroscopy, but can instead use a different method to place a lower limit on the disc fraction. The optical continuum is significantly variable, and the variability presumably must be attributed to the disc. If we assume that the optical continuum lightcurve consists of three components: companion star, slowly varying disc light, and flickering disc light, then the fraction of light due to the flickering component provides a robust lower limit on the disc fraction.
We show IAC80 photometry together with WHT and Gemini continuum lightcurves in Fig. 1. Our observations were centred around photometric phase 0.65 using the ephemeris of Casares & Charles (1994) implying that the ellipsoidal modulation should be rising from the deeper minimum at phase 0.5 to the maximum at phase 0.75. This rising trend and the approximate amplitude of ellipsoidal modulations expected are consistent with the general upward trend we observe. For a long period system such as V404 Cyg, we can approximate the ellipsoidal modulation within a night by a linear trend so we remove the slowly varying light by subtracting a linear fit to the lower envelope of the continuum lightcurve. We find that the remaining flickering component is about 4 percent of the total light in both the WHT and Gemini segments of the lightcurve and correlates very well with the X-ray variations (as also found for the H emission by Hynes et al. 2004). This 4 % flickering light is actually not far off of spectroscopic estimates based on veiling near H as discussed above. This makes it plausible that flickering light source does contribute most of the disc light in the optical.
3.3 The stellar contribution
We do not have sufficient information to independently constrain the stellar contribution to the SED at each wavelength, so opt to instead model the stellar spectrum based on estimates of the system parameters. From Casares & Charles (1994) we have a spectral type estimate of G8–K2 III–V. Shahbaz et al. (1994) estimates companion star parameters of M⊙ and R⊙ implying and a giant classification. The SED of a giant star should be the best approximation for V404 Cyg, although strictly it is a stripped giant (King, 1993). For a K0 iii spectral type we find K using the temperature scale derived by van Belle et al. (1999) for G, K, and M giants. We model the spectrum of the companion by interpolating on the grid of model atmosphere spectra of late-type giants of Hauschildt et al. (1999) after logarithmically re-binning the models to .

Casares et al. (1993) estimated the interstellar extinction to be based primarily on comparing the colour with that expected for a K0 iii star after correcting for their estimates of disc contamination. We tested this by fitting the model K0 iii spectrum described above to the full set of BVRJHK magnitudes (folding the model spectrum with bandpasses to generate synthetic photometry) constraining the fit to preferably lie within ranges implied by the disc contamination constraints of Casares et al. (1993) and Shahbaz et al. (1996) and shown in Fig. 2 by vertical bars. Our fit confirms the earlier estimate with a formal best fit for , shown in Fig. 2. The residuals scatter both above and below the line indicating that intrinsic variability and/or calibration uncertainties are playing a role, so we do not attempt to estimate an error on the extinction but we do show companion spectra reddened by and to indicate the sensitivity to extinction. Extinctions much outside of this range would require attributing a larger fraction of the light to the disc than has previously been estimated.
The alternate G8 and K2 possibilities are almost indistinguishable from K0, so we do not show them. The K0 iii stellar spectrum clearly provides a good description of the UV to near-IR data, consistent with previous estimates that the companion dominates the light in both the optical and infrared. We expand the view in Fig. 3 to include both near to mid-IR data from Spitzer and near-UV data from HST. As found by Muno & Mauerhan (2006), an IR excess does appear to be seen by Spitzer. A weak UV component also seems to be present, although this is not as pronounced as seen in other quiescent BHXRTs (McClintock & Remillard 2000; McClintock et al. 2003; Hynes et al. in prep.) The F250W data (the highest frequency) shown in Fig. 3 has already been corrected for an estimate of the red-leak as will be discussed in Section 3.5.
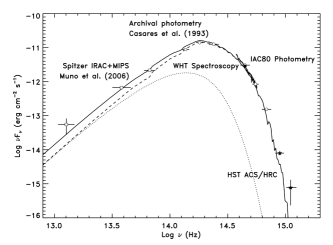
3.4 The mid-IR excess
The Spitzer data clearly lie above a plausible extrapolation of the companion star spectrum alone (Fig. 3). Given the insensitivity of the IR spectrum to the temperature of the companion and interstellar extinction, we cannot adjust the companion spectrum in any way to fit these IR data. While these were not simultaneous with the optical data, we do not expect the continuum brightness of the companion to vary from epoch to epoch. Small variations due to ellipsoidal modulations will be present as a function of orbital phase, but these are less than (Shahbaz et al., 1994).


Muno & Mauerhan (2006) interpreted the mid-IR excess seen in V404 Cyg as the tail of a Shakura-Sunyaev accretion disc. This model, however, predicts a UV excess which is inconsistent with our HST observations, exceeding our F330W measurement by an order of magnitude and the F250W by two orders. During quiescence instead most of the disc is expected to be in a cool state, 2000–3000 K, with a more isothermal temperature distribution (see Hynes et al. 2005 and references therein). The contamination from this material will then be most pronounced in the mid-IR as it is cooler than the companion star, but no UV excess will be present.
We use a solid line in Fig. 3 to show a model including a 2000 K blackbody in addition to the companion star spectrum discussed above. This can adequately fit both the near-IR to UV SED and the Spitzer near-IR data (it is less successful at 24 m). The blackbody flux is consistent with a disc of radius cm tilted at an inclination of 56∘ (Shahbaz et al., 1994) and at a distance of 3.5 kpc. For the system parameters discussed above, this corresponds to about 60 percent of the radius of the Roche lobe of the black hole. This is a very plausible size for a quiescent accretion disc.
We note that while Muno & Mauerhan (2006) preferred a Shakura-Sunyaev disc model for the IR excess in V404 Cyg specifically, in other systems they invoked a much cooler circum-binary disc. Such a disc would remain a possibility in the light of our UV observations as it would not contribute to the UV flux.
The difficulty in fitting the 24 m point supports a more controversial interpretation as proposed by Gallo et al. (2007). The flux in this band is rather close to an extrapolation of the flat radio spectrum raising the possibility that the IR excess could be due to synchrotron jet emission. The major difficulty in quantifying this is that the radio is known to be strongly variable (Section 5) and was not observed simultaneously with the 24 m point. We will return to this topic in Section 6.3.
3.5 The UV excess
Our data also provide tenuous evidence for a UV excess. One possible explanation for this is red-leaks in the UV bandpasses (Chiaberge & Sirianni, 2007). Although this may make a large contribution in F250W, the effect is not expected for the F330W filter. The estimates for red-leaks from Chiaberge & Sirianni (2007) are of no use as they only consider unreddened stars, so we perform our own calculations. In addition to red-leaks, because the spectrum is so steep in the UV it is hard to gauge the expected flux in a broad-band without performing synthetic photometry.
To better assess the significance of any UV excess, we therefore use synphot (Laidler et al., 2005) to estimate count-rates in each bandpass for our model reddened K0 iii spectrum. We consider two spectra, one with the full spectral coverage, and the other truncated above 4200 Å to disentangle in-band stellar flux from the red-leak. We find that the red-leak is negligible in the F330W bandpass, as expected, and that the in-band stellar flux can account for approximately half of the count-rate seen in this band; this is a little more than a 3 excess. The F250W band appears to have a large contribution from red-leak, about half of the flux in the band. After subtraction of the companion star, both in-band and red-leak, the residual excess is s-1, so is not a significant detection of disc light in this band.
We therefore appear to have a significant detection of a UV excess in the F330W band only, but even this is at the mercy of uncertainties in the companion spectral classification (which do become a concern in the UV) and reddening. We therefore choose not to pursue the spectrum of the UV excess further.
4 The X-ray Spectra and Variability
4.1 X-ray Spectra Analysis
| Model | 0.3–7.0 keV Flux | ||||
| ( cm-2) | (keV) | (erg cm-2 s-1) | |||
| 2000 observation | |||||
| Power-Law | … | 1.00 | |||
| Bremsstrahlung | … | 1.01 | |||
| Raymond-Smith | … | 1.05 | |||
| 2003 observation | |||||
| Power-Law | … | 0.93 | |||
| Bremsstrahlung | … | 0.92 | |||
| Raymond-Smith | … | 1.08 | |||
We extracted spectra for both Chandra observations with CIAO v3.2 and analysed them with XSPEC v12.2. We used standard CIAO techniques to select response files according to the CCD temperature. We considered many spectral models within XSPEC, all with interstellar absorption, and report results from fitting with power-law, bremsstrahlung, and Raymond-Smith models here. Blackbody fits to the data were so poor that we neglect them for discussion. Due to the lower count rate in the 2003 observation, we were prompted to try using CASH statistics in tandem with the Churazov approximation for chi-squared statistics (Cash, 1979; Churazov, 1996). For each set of statistics to be used, we grouped the spectra into at least 15 counts per spectral bin; further binning results in a loss of spectral information. Churazov weighting estimates the weight for a given channel by averaging the counts in surrounding channels. CASH statistics is a method designed to estimate the best-fit parameters using unbinned or slightly binned data, which can be particularly useful when the source yields few photons. We also checked the consistency of CASH with unbinned data, and found the results to be equivalent.
All models except the blackbody model give acceptable fits to both data sets with the power-law providing the best fit. Both statistical methods provide results that are equivalent to previously published results by Kong et al. (2002) for the 2000 observation. The best-fitting model is shown in Fig. 4. For the 2003 observation, we find similar results to Corbel et al. (2008), and a plot is also displayed in Fig. 4. Table 3 summarises the results of the spectral fitting.
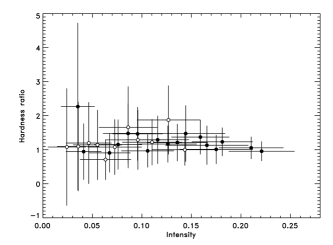
4.2 Color-Intensity Diagram
To test for any variation in the spectrum with luminosity we construct a hardness–intensity diagram. We separated the data into two bandpasses of approximately equal count rates, which were 0.3–1.75 keV (soft) and 1.75–7.0 keV (hard) for each set. To account for the reduction in sensitivity between the two epochs, we used an assumed fixed model of a photo-absorbed power-law to calculate the ratio of expected count rates in these bandpasses between the two observations and hence rescale the 2000 observations to match those from 2003. The resulting hardness–intensity diagram is shown in Fig. 5. We see no variation in hardness either within or between the two observations, the first of which had a substantially higher count rate. This indicates no detectable spectral change over a factor of ten in source luminosity.
5 Radio Spectra and Variability
To constrain the radio spectral shape we first examine each dataset individually. We obtain (where ) from the VLA data and from the WSRT. The difference between them is not statistically significant so we also perform a joint power-law fit to both datasets, allowing the relative normalisation of the two to vary as they sample different portions of the lightcurve. Primarily this is constrained by the VLA data as the uncertainties in the WSRT fluxes are larger. We find a spectral index of . All the fits are consistent with the canonical flat spectrum as commonly seen in hard state black hole binaries.
The VLA data exhibit substantial variability. We show the higher quality 8.5 GHz lightcurve together with that from Chandra in Fig. 1. The radio is clearly strongly variable and shows both large flares and dips not dissimilar to those seen by Chandra. The most dramatic feature rises from almost zero flux to the highest peak in about 30 min, as was also the case in the dataset presented by Miller-Jones et al. (2008). No clear correlation between radio and X-ray is apparent to the eye, however. To further test this, we calculate the cross-correlation function between the X-ray and radio data and show this in Fig. 6. No compelling correlation (or anti-correlation) is present although an unremarkable peak is present at zero lag.

Since WSRT is a linear array, it covers a full synthesis in 12 hours and hence is not capable of the high time-resolution achieved by the VLA. Nevertheless the source does show significant variability over this period, even if a possible correlation with X-ray/optical is difficult to infer. When the observation is split in 2 sub-intervals, 18:40–24:00 and 00:00–05:13, the resulting flux densities are: mJy and mJy respectively. The second interval, covering D2–F2, overlaps with the first part of the VLA observation, which shows a significant increase at 8.5 GHz beginning at 03:00 UT (with a peak flux density of 0.6 mJy). However, the VLA flare only lasts for hour, of which only about one-half was covered by WSRT. Finer sub-intervals proved impractical as there was insufficient coverage of the UV plane to isolate flux from V404 Cyg.
6 The Broad Band Spectral Energy Distribution
6.1 Comparison with existing data
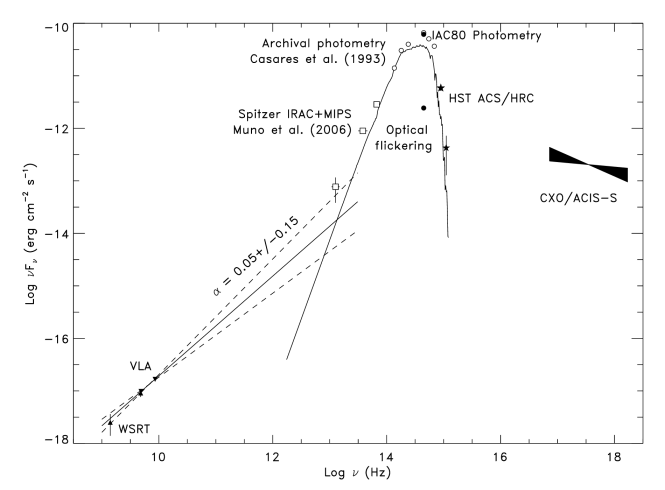
Previous sections of this paper have focused primarily on one or two bands; we will broaden our scope here to questions best addressed with the whole SED. We show the complete radio–X-ray SED in Fig. 7. We have also compiled all the data points, as plotted, in Table 4 to allow easier comparison with future models. We include a point representing just the flickering component in the optical to represent a lower limit on the accretion light. We adopt the extinction curve of Fitzpatrick (1999) in the optical and UV, Indebetouw et al. (2005) for the Spitzer/IRAC data and assume following Chapman et al. (2009). Our dataset should supersede that used by (Narayan et al.1997) for future modelling of V404 Cyg. Compared to earlier work we now have simultaneous X-ray and optical data, shorter wavelength coverage extending into the near-UV, and simultaneous radio observations.
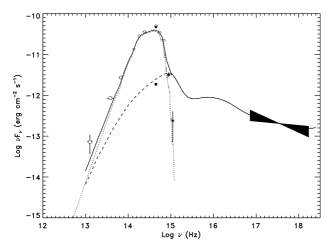
In Fig. 8 we illustrate the additional constraints now possible, showing Model 1 of (Narayan et al.1997) overlaid on our SED after scaling downwards to fit our X-ray spectrum. This is of course not intended to be a detailed model fit. Not only should a new model be computed to fit a lower X-ray luminosity, but there have been refinements in modelling of advective accretion flows in the last decade as well. Our main point is to stress the strong constraint provided by the low near-UV flux. Model 1 was an acceptable fit to the SED data available to (Narayan et al.1997) but clearly over-predicts the near-UV substantially compared to our new data. Alternative models with winds presented by Quataert & Narayan (1999), on the other hand, would be consistent with the UV data. This constraint on the UV to X-ray flux ratio can be used to constrain current and future models.
6.2 The origin of optical flickering
The flux of the optical flickering component falls at an intriguing location in the SED (Fig. 7). It is a little above a straight extrapolation of either the X-ray or radio power-laws. An extrapolation of the radio is plausible, as a flat-spectrum is expected to continue until a break to optically thin synchrotron at higher frequencies. We would not expect a straight extrapolation of the X-ray spectrum at all, and all models for the broad-band SED (e.g. Narayan et al.1997) involve curvature between X-ray and optical bands.) Here correlations are more telling evidence than fluxes. We find an excellent correlation between X-ray and optical continuum (Fig. 1), but no clear correlation between X-ray and radio (and by extension optical). This suggests that the optical variability and the X-ray emission are closely connected, either by direct emission from the same region, as expected from early advection dominated accretion flow (ADAF) models, or indirectly through X-ray irradiation of the disc, as inferred for H emission by Hynes et al. (2004). The X-ray and radio emission, on the other hand, do not obviously appear correlated on the timescales observed (although a correlation on longer timescales is certainly possible) suggesting that the mechanisms for variability in the two are not connected.
6.3 The extent of synchrotron emission
There is clearly a mid-IR excess prominent in the 24 m band. While it is possible to partially explain this with emission from a cool disc, synchrotron emission from the radio jet provides a better description of the excess (Gallo et al., 2007). An extrapolation of the flat spectrum beyond the IR region is problematic for several reasons. We have argued above that the optical variability appears directly or indirectly associated with the X-ray emitting component rather than with the radio. In addition, the low UV flux observed is inconsistent with a straight extrapolation of the flat spectrum all the way to the UV, and problematic even if the spectrum is assumed to break in the optical. This argues that a break in the jet spectrum at longer wavelengths is needed so that the non-stellar optical/UV emission originates from the disc rather than the jet. The most likely interpretation is then that the break from flat spectrum to optically thin synchrotron occurs in the mid to far-IR, although given the large amplitude of radio variability only simultaneous radio and mid-IR observations could address this question conclusively.
7 Conclusions
We have compiled the comprehensive dataset describing the spectral energy distribution of the black hole X-ray binary V404 Cyg in quiescence. This includes new and simultaneous radio, optical, UV, and X-ray data, supplemented with additional non-simultaneous data in the optical through infrared.
Our specific findings are:
-
1.
There is no need for a model to include a substantial contribution from accretion light over the near-UV to optical spectral range. The SED over this range (including the vacuum UV) is well described by a K0 IV star reddened by . The very low UV flux detected only marginally supports an accretion component, and rather tightly constrains some spectral models of quiescent accretion flows.
- 2.
-
3.
The X-ray spectrum is consistent with a power-law as found by all other studies to date. There is no evidence for any spectral variation over the range of a factor of 10 in luminosity that has been observed over two epochs by Chandra.
-
4.
The radio shows a flat spectrum in as is commonly seen in hard state X-ray binaries and associated with a compact jet. The break frequency between a flat and optically thin spectrum most likely occurs in the sub-mm to far-IR regime, but is not conclusively constrained by existing data. The radio is substantially variable but puzzlingly there is no clear correlation with X-ray variability. If the radio variability reflects changes in the jet power, this suggests that the X-ray variations occur independently of changes in the jet, or with a very large lag (many hours) between the two.
Overall, the likely interpretation of the SED is as follows:
-
1.
The K0 iii companion star dominates the light from near-IR to near-UV wavelengths.
-
2.
The cool outer regions of the accretion disc may produce a modest mid-IR excess seen by Spitzer (Muno & Mauerhan, 2006).
-
3.
The inner accretion flow produces highly variable X-ray emission but apparently only weak UV emission. This irradiates the accretion disc and is responsible for emission line variability (Hynes et al., 2004). The optical continuum variability may also arise from reprocessing but direct emission from the inner accretion flow remains a possibility.
-
4.
A compact jet is driven from the inner accretion disc producing variable flat-spectrum radio emission likely extending to the far and possibly mid-IR. The size of the jet is smaller than 4.5 AU (about the binary separation) for a distance of 3.5 kpc (Miller-Jones et al., 2008).
| Observed | Dereddened | ||
| (Hz) | (erg cm-2 s-1 Hz-1) | (erg cm-2 s-1 Hz-1) | |
| Simultaneous Observations | |||
| WSRT (1.4 GHz) | |||
| WSRT (4.8 GHz) | |||
| VLA (4.9 GHz) | |||
| VLA (8.6 GHz) | |||
| IAC80 (R) | |||
| HST (F330W) | |||
| HST (F250W) | |||
| Chandra | |||
| Non-simultaneous Observations | |||
| Spitzer (24 m) | |||
| Spitzer (8 m) | |||
| Spitzer (4.5 m) | |||
| Archival | |||
| Archival | |||
| Archival | |||
| Archival | |||
| Archival | |||
| Archival | |||
Acknowledgements
We are grateful to Valerie Mikles for many helpful comments on this manuscript. Chandra observations were supported by NASA grant GO3-4044X. C. B. acknowledges support from a LaSpace GSRA award. E. G. acknowledges support from a Hubble Fellowship. The WHT is operated on La Palma by the ING in the Spanish Observatorio del Roque de los Muchachos of the Instituto de Astrofísica de Canarias. Gemini observations were obtained under program GN-2003A-Q-12 by the Gemini Observatory which is operated by the Association of Universities for Research in Astronomy, Inc., under a cooperative agreement with the NSF on behalf of the Gemini partnership: the National Science Foundation (United States), the Science and Technology Facilities Council (United Kingdom), the National Research Council (Canada), CONICYT (Chile), the Australian Research Council (Australia), Ministério da Ciência e Tecnologia (Brazil) and SECYT (Argentina)
References
- Boffi et al. (2007) Boffi, F. R., et al. 2007, ACS Instrument Handbook, Version 8.0, Baltimore: STScI
- Bradley et al. (2007) Bradley, C. K., Hynes, R. I., Kong, A. K. H., Haswell, C. A., Casares, J., & Gallo, E. 2007, ApJ, 667, 427
- Casares et al. (1993) Casares, J., Charles, P. A., Naylor, T., & Pavlenko, E. P. 1993, MNRAS, 265, 834
- Casares & Charles (1994) Casares, J. & Charles, P. A. 1994, MNRAS, 271, L5
- Chapman et al. (2009) Chapman, N. L., Mundy, L. G., Lai, S.-P., Evans, N. J., 2009, ApJ, 690, 496
- Chiaberge & Sirianni (2007) Chiaberge, M., Sirianni, M., ACS CCDs UV and Narrow-band Filters Red Leak Check, Instrument Science Report ACS 2007-03, Baltimore: STScI
- Corbel et al. (2008) Corbel, S., Koerding, E., Kaaret, P., 2008, MNRAS, 389, 1697
- Esin et al. (2001) Esin, A. A., McClintock, J. E., Drake, J. J., Garcia, M. R., Haswell, C. A., Hynes, R. I., & Muno, M. P. 2001, ApJ, 555, 483
- Fender et al. (2003) Fender, R. P., Gallo, E., & Jonker, P. G. 2003, MNRAS, 343, L99
- Fitzpatrick (1999) Fitzpatrick, E. L. 1999, PASP, 111, 63
- Gallo et al. (2005) Gallo, E., Fender, R. P., & Hynes, R. I. 2005, MNRAS, 1017
- Gallo et al. (2006) Gallo, E., Fender, R. P., Miller-Jones, J. C. A., Merloni, A., Jonker, P. G., Heinz, S., Maccarone, T. J., & van der Klis, M. 2006, MNRAS, 370, 1351
- Gallo et al. (2007) Gallo, E., Migliari, S., Markoff, S., Tomsick, J. A., Bailyn, C. D., Berta, S., Fender, R., & Miller-Jones, J. C. A. 2007, ApJ, 670, 600
- Garcia et al. (2001) Garcia, M. R., McClintock, J. E., Narayan, R., Callanan, P., Barret, D., & Murray, S. S. 2001, ApJ, 553, L47
- Hauschildt et al. (1999) Hauschildt, P. H., Allard, F., Ferguson, J., Baron, E., & Alexander, D. R. 1999, ApJ, 525, 871
- Hynes et al. (2005) Hynes, R. I., Robinson, E. L., & Bitner, M. 2005, ApJ, 630, 405
- Hynes et al. (2002) Hynes, R. I., Zurita, C., Haswell, C. A., Casares, J., Charles, P. A., Pavlenko, E. P., Shugarov, S. Y., & Lott, D. A. 2002, MNRAS, 330, 1009
- Hynes (2002) Hynes, R. I. 2002, A&A, 382, 752
- Hynes et al. (2004) Hynes, R. I., et al. 2004, ApJL, 611, L125
- Indebetouw et al. (2005) Indebetouw, R., et al. 2005, ApJ, 619, 931
- King (1993) King, A. R. 1993, MNRAS, 260, L5
- Koekemoer et al. (2002) Koekemoer, A. M., Fruchter, A. S., Hook, R. N., & Hack, W. 2002, in Proc. The 2002 HST Calibration Workshop: Hubble after the Installation of the ACS and the NICMOS Cooling System, Eds. S. Arribas, A. Koekemoer & B. Whitmore, 337, Baltimore: STScI
- Kong et al. (2002) Kong, A. K. H., McClintock, J. E., Garcia, M. R., Murray, S. S., & Barret, D. 2002, ApJ, 570, 277
- Laidler et al. (2005) Laidler, V. et al., Synphot User’s Guide, Version 5.0, Baltimore: STScI
- Markoff et al (2001) Markoff, S., Falcke, H., & Fender, R. 2001, A&A, 372, L25
- McClintock & Remillard (2000) McClintock, J. E., & Remillard, R. A. 2000, ApJ, 531, 956
- McClintock et al. (2003) McClintock, J. E., Narayan, R., Garcia, M. R., Orosz, J. A., Remillard, R. A., & Murray, S. S. 2003, ApJ, 593, 435
- Miller-Jones et al. (2008) Miller-Jones, J. C. A., et al. 2008, MNRAS, 388, 1751
- Muno & Mauerhan (2006) Muno, M. P., & Mauerhan, J. 2006, ApJL, 648, L135
- Narayan et al. (1996) Narayan, R., McClintock, J. E., & Yi, I. 1996, ApJ, 457, 821
- (31) Narayan, R., Barret, D., & McClintock, J. E. 1997, ApJ 482, 448
- Narayan & McClintock (2008) Narayan, R., McClintock, J. E. 2008, To appear in “Jean-Pierre Lasota, X-ray binaries, accretion disks and compact stars”, New Astronomy Reviews, Eds. M. A. Abramowicz & O. Straub (arXiv:0803.0322)
- Pavlovsky et al. (2005) Pavlovsky, C., Koekemoer, A. & Mack, J., Eds., HST Data Handbook for ACS v4.0, Baltimore: STScI
- Quataert & Narayan (1999) Quataert, E., & Narayan, R. 1999, ApJ, 520, 298
- Riess & Mack (2004) Riess, A., Mack, J., Time Dependence of ACS WFC CTE Corrections for Photometry and Future Predictions, Instrument Science Report ACS 2004-006, Baltimore: STScI
- Shahbaz et al. (1994) Shahbaz, T., Ringwald, F. A., Bunn, J. C., Naylor, T., Charles, P. A., & Casares, J. 1994, MNRAS, 271, L10
- Shahbaz et al. (1996) Shahbaz, T., Bandyopadhyay, R., Charles, P. A., & Naylor, T. 1996, MNRAS, 282, 977
- Sirianni et al. (2005) Sirianni, M., et al. 2005, PASP, 117, 1049
- Stone (1977) Stone, R. P. S. 1977, ApJ, 218, 767
- Udalski & Kaluzni (1991) Udalski, A., & Kaluzny, J. 1991, PASP, 103, 198
- van Belle et al. (1999) van Belle, G. T., et al. 1999, AJ, 117, 521
- Yuan et al. (2005) Yuan, F., Cui, W., & Narayan, R. 2005, ApJ, 620, 905
- Zurita et al. (2004) Zurita, C., Casares, J., Hynes, R. I., Shahbaz, T., Charles, P. A., & Pavlenko, E. P. 2004, MNRAS, 352, 877