Timing Characteristics of the Hard X-ray Emission from Bright X-ray Pulsars Based on INTEGRAL Data
1 Space Research Institute, Russian Academy of Sciences, Profsoyuznaya ul. 84/32, Moscow 117997, Russia
2 Max-Planck-Institut fur Astrophysik, Karl-Schwarzschild-Str. 1, Postfach 1317, D-85741 Garching, Germany
Received June 17, 2008
We review the results of a timing analysis of the observations for ten bright X-ray pulsars (with fluxes mCrab in the 20-100 keV energy band) that fell within the INTEGRAL field of view from 2003 to 2007. The dependence of the pulse profile on the energy and intrinsic source luminosity has been investigated; particular attention has been paid to searching for changes in the pulse profile near the cyclotron frequency. The dependence of the pulsed fraction for X-ray pulsars on their luminosity and energy band has been studied in detail for the first time.
Key words: X-ray pulsars, neutron stars, timing analysis
∗ E-mail: aal@iki.rssi.ru
INTRODUCTION
According to the universally accepted theory of accretion onto rapidly rotating neutron stars with a strong magnetic field, the infalling matter from the companion star is braked on the Alfven surface by the magnetic pressure, becomes frozen into the magnetic field, and falls along the field lines into narrow ringlike regions at the magnetic poles of the neutron star, producing accretion columns and releasing its gravitational energy in the X-ray wavelength range. In that case, as the pulsar rotates about its axis, an observer will register pulses on the light curve differing in shape and features, depending on the specific physical and geometrical conditions both near the neutron star surface and in the path of signal propagation. The pulsed fraction will depend on the configuration of the emitting regions, the dipole position relative to the observer, the energy, etc.
As was pointed out in early papers on this subject (see, e.g., Wang and Welter 1981; White et al. 1983), the observed pulse profiles differ significantly for different sources, have a wide variety of shapes, depending on the energy and source luminosity, and, in some cases, can shift by as much as 180∘ in phase as the energy band changes. In addition, they are also variable on the scale of a single pulse (see, e.g., Frontera et al. 1985; Tsygankov et al. 2007). Nevertheless, Bulik et al. (2003) made an attempt at a “broad” classification of pulse profiles, according to which each pulsar can be assigned to the subclass of either single- or double-peaked profiles. This classification is based on the fact that an observer sees either one or both magnetic poles, respectively, as the neutron star rotates. This difference may not be so distinct at low energies, but single- and double-peaked profiles can be clearly separated above keV, where the effect of absorption may be neglected, or, in the case of pulsars with a cyclotron feature, above the cyclotron energy.
A strong magnetic field ( G) near the emitting regions on the neutron star surface is the source of peculiar features in the observed properties of X-ray pulsars. In particular, the position of the cyclotron resonance scattering feature in the pulsar spectrum is a direct source of information about the magnetic field strength. In this way, the magnetic field on the X-ray pulsar Her X-1 was measured for the first time (Truemper et al. 1978). In addition, the properties of the accreting plasma can change sharply at the cyclotron frequency, which can be manifested as a change in the beam pattern of emission (Meszaros and Nage 1985). The corresponding changes in the pulse profile near the cyclotron energy were observed in some of the sources (see, e.g., Tsygankov et al. (2006) and references therein).
Basko and Sunyaev (1975, 1976) showed that the beam pattern of emission from an accretion column depends on the presence of a shock in it. Thus, for example, a shock in which the infalling matter is braked emerges above the neutron star surface at a high luminosity ( erg/s). The emitting plasma is accumulated in the zone under the shock and the emission emerges mainly through the side surfaces of a accretion column with a fan beam pattern. At lower luminosities, the matter can be braked near the neutron star surface and a pencil beam pattern of emission will be more likely due to the effects of a strong magnetic field. At intermediate luminosities, the beam pattern will be a combination of fan and pencil beams. The beam pattern and, accordingly, the pulse profile can change with energy band, since the hotter layers of matter are closer to the neutron star surface, where the emission formation conditions can differ from those in higher layers (Basko and Sunyaev 1976).
Obviously, changes in the beam pattern and in the emission formation conditions and geometry will lead to a dependence of the pulsed fraction on both source luminosity and energy. This was recognized and measured by several authors back in the 1980-1990s. However, only with the advent of the modern RXTE and INTEGRAL observatories, with high time and energy resolutions (especially in the hard energy band, where the observed emission is unaffected by photoabsorption and depends only on the system geometry and physical conditions in its formation region), did systematic studies become possible. In particular, using RXTE data, Tsygankov et al. (2007) showed that the pulsed fraction for 4U0115+63 decreases with increasing source luminosity and increases with energy. The increase is not monotonic but has features near the harmonics of the cyclotron absorption line: its excess above the general trend is clearly observed near the fundamental harmonic; similar features are also observed near the higher harmonics, but they can be slightly shifted relative to the center of the cyclotron line harmonic. An increase in the pulsed fraction with energy was also reported for several other pulsars: GX 1+4 (Ferrigno et al. 2007), OAO 1657-415 (Barnstedt et al. 2008), and EXO 2030+375 (Klochkov et al. 2008a).
This is the next paper in our series of papers (Tsygankov et al. 2007; Lutovinov and Tsygankov 2008) devoted to the investigation of the pulse profiles and pulsed fractions for X-ray pulsars. Using the methods proposed and described by Tsygankov et al. (2007), we investigated the ten (4U 0115+63, V 0332+53, A 0535+262, Vela X-1, Cen X-3, GX 301-2, OAO 1657-415, Her X-1, GX 1+4, EXO 2030+375) brightest (with fluxes mCrab) X-ray pulsars based on INTEGRAL data in the hard ( keV) energy band. Here, we analyze in detail the dependence of the pulsed fraction for X-ray pulsars on their luminosity and energy band and the effect of resonance absorption near the cyclotron line on it for the first time. In addition, we obtained pulse profiles for the above pulsars in several energy bands, relative intensity maps of pulse profiles, and dependences of the pulsed fraction (PF) on energy for all of the possible observed states and luminosities and compiled the corresponding catalog. Since this is a fairly large data set and in order not to overload the paper, we provide here only the averaged (if the profile did not change significantly with luminosity) or most typical pulse profiles, intensity maps, and PF dependences on the energy. The complete catalog is freely accessible at http://hea.iki.rssi.ru/integral/pulsars and can be used to construct and test radiation models for X-ray pulsars.
OBSERVATIONS AND DATA ANALYSIS
Data from the IBIS telescope (the ISGRI detector; Lebrun et al. 2003) of the INTEGRAL observatory (Winkler et al. 2003) were used to investigate the pulse profiles in the hard X-ray energy band.
Table 1. Bright X-ray pulsars from INTEGRAL data
| Pulsar | Observation, | Middle | Exposure, | Flux, | Luminosity, |
| name | orbits | of observations, MJD | ks | erg s-1 cm-2 | erg s-1 |
| 1 | 2 | 3 | 4 | 5 | 6 |
| 4U 0115+63 | 238 | 53273.6 | 97.0 | ||
| 272 | 53376.5 | 23.7 | |||
| 273 | 53379.3 | 42.5 | |||
| 274 | 53380.3 | 15.9 | |||
| V 0332+53 | 278 | 53394.2 | 41.9 | ||
| 284 | 53411.0 | 107.7 | |||
| 285 | 53413.1 | 11.6 | |||
| 286 | 53416.3 | 16.2 | |||
| 287-288 | 53420.6 | 27.6 | |||
| 352 (low) | 53613.7 | 34.1 | |||
| A 0535+262 | 352 (medium) | 53614.5 | 51.0 | ||
| 352 (high) | 53615.4 | 42.0 | |||
| 58 | 52734.3 | 7.2 | |||
| 81 | 52804.1 | 60.0 | |||
| 82 | 52807.5 | 106.5 | |||
| 83 | 52809.5 | 150.8 | |||
| 84 | 52812.7 | 61.5 | |||
| 85 | 52816.7 | 79.9 | |||
| 86 | 52819.1 | 148.1 | |||
| 87 | 52822.3 | 57.8 | |||
| 88 | 52825.0 | 88.6 | |||
| 137 | 52971.4 | 111.1 | |||
| 138-140 | 52978.5 | 248.1 | |||
| 146 | 52997.5 | 5.2 | |||
| 149 | 53006.4 | 5.5 | |||
| 154 | 53021.3 | 5.9 | |||
| 157 | 53030.3 | 8.7 | |||
| Vela X-1 | 161 | 53042.2 | 6.8 | ||
| 171 | 53071.6 | 5.0 | |||
| 186 | 53119.2 | 5.5 | |||
| 203 | 53168.5 | 9.8 | |||
| 217 | 53209.7 | 7.1 | |||
| 250 | 53308.5 | 8.0 | |||
| 256 | 53326.6 | 8.4 | |||
| 262 | 53344.5 | 7.6 | |||
| 267 | 53361.4 | 28.4 | |||
| 275 | 53383.6 | 10.4 | |||
| 301 | 53460.9 | 4.9 | |||
| 373-383 | 53693.1 | 783.0 |
| 1 | 2 | 3 | 4 | 5 | 6 |
| 398 | 53751.1 | 4.7 | |||
| 433-440 | 53865.9 | 749.5 | |||
| 445 | 53891.6 | 24.7 | |||
| 446 | 53894.8 | 7.0 | |||
| 192 | 53136.1 | 94.5 | |||
| 194-197 | 53146.8 | 349.3 | |||
| 198-200 | 53157.0 | 264.0 | |||
| Cen X-3 | 201-205 | 53165.5 | 175.8 | ||
| 325 | 53533.9 | 44.7 | |||
| 327 | 53539.9 | 80.1 | |||
| 330 | 53549.0 | 62.6 | |||
| 46 | 52700.5 | 4.0 | |||
| 76 | 52789.5 | 44.8 | |||
| 77 | 52791.1 | 29.5 | |||
| 78 | 52796.0 | 24.6 | |||
| 91 | 528343.0 | 34.2 | |||
| 150 | 53009.8 | 33.4 | |||
| 176 | 53087.4 | 103.9 | |||
| 213 | 53198.0 | 3.3 | |||
| 267 | 53361.1 | 3.6 | |||
| GX 301-2 | 268 | 53362.5 | 4.9 | ||
| 283 | 53407.4 | 3.2 | |||
| 322 | 53524.9 | 112.4 | |||
| 323 | 53528.2 | 104.4 | |||
| 325 | 53533.4 | 31.4 | |||
| 326 | 53536.8 | 73.3 | |||
| 330 | 53549.4 | 63.6 | |||
| 407 | 53778.4 | 3.1 | |||
| 444 | 53888.8 | 3.1 | |||
| 463 | 53946.1 | 3.1 | |||
| 517 | 54108.5 | 8.6 | |||
| 36-38 | 52671.8 | 142.1 | |||
| 46-47 | 52701.1 | 145.4 | |||
| 50-52 | 52714.6 | 169.4 | |||
| 60-61 | 52742.8 | 66.3 | |||
| 103 | 52870.0 | 110.6 | |||
| 105-110 | 52883.3 | 151.9 | |||
| 116 | 52908.4 | 48.6 | |||
| 119 | 52916.7 | 53.1 | |||
| 175 | 53085.2 | 36.4 |
| 1 | 2 | 3 | 4 | 5 | 6 |
| 224 | 53232.5 | 75.6 | |||
| 233 | 53256.9 | 17.9 | |||
| 283-284 | 53409.9 | 72.2 | |||
| 285-289 | 53420.4 | 231.7 | |||
| OAO 1657-415 | 290-294 | 53434.1 | 230.0 | ||
| 295-299 | 53450.5 | 182.9 | |||
| 303-307 | 53474.3 | 168.3 | |||
| 345 | 53594.9 | 24.5 | |||
| 347 | 53599.7 | 81.2 | |||
| 350 | 53608.7 | 91.4 | |||
| 364 | 53650.1 | 83.6 | |||
| 409 | 53785.1 | 69.1 | |||
| 412 | 53794.8 | 44.7 | |||
| 472-473 | 53974.8 | 56.4 | |||
| 525 | 54131.4 | 91.6 | |||
| 531 | 54149.5 | 79.7 | |||
| 536 | 54164.6 | 81.7 | |||
| 540 | 54176.1 | 49.4 | |||
| 339 | 53575.8 | 132.3 | |||
| Her X-1 | 340 | 53577.8 | 19.5 | ||
| 341 | 53582.4 | 40.4 | |||
| 342 | 53584.2 | 67.9 | |||
| 46 | 52699.4 | 100.0 | |||
| 60-64 | 52746.9 | 149.3 | |||
| 119-122 | 52923.1 | 283.3 | |||
| 164-165 | 53053.8 | 207.2 | |||
| 168 | 53064.1 | 74.0 | |||
| 172-173 | 53078.5 | 152.4 | |||
| 175 | 53084.9 | 38.9 | |||
| 178-179 | 53095.3 | 231.4 | |||
| GX 1+4 | 181 | 53103.7 | 95.4 | ||
| 183 | 53108.5 | 48.3 | |||
| 185 | 53114.8 | 29.9 | |||
| 225-234 | 53248.5 | 691.2 | |||
| 235-237 | 53267.3 | 291.7 | |||
| 240-241 | 53281.1 | 250.8 | |||
| 242-246 | 53291.2 | 238.6 | |||
| 297-299 | 53453.7 | 158.1 | |||
| 303-305 | 53471.3 | 181.4 | |||
| 306-308 | 53479.2 | 277.9 | |||
| 475-477 | 53985.2 | 211.5 |
| 1 | 2 | 3 | 4 | 5 | 6 |
|---|---|---|---|---|---|
| 67 | 52761.8 | 64.4 | |||
| 80 | 52801.2 | 129.2 | |||
| 159-160 | 53040.9 | 249.4 | |||
| 190 | 53130.2 | 122.8 | |||
| EXO 2030+375 | 218 | 53214.2 | 99.0 | ||
| 251-255 | 53319.2 | 339.4 | |||
| 437-438 | 53870.3 | 126.4 | |||
| 452-453 | 53914.9 | 16.5 | |||
| 462 | 53942.9 | 70.1 | |||
| 470 | 53967.6 | 140.1 | |||
| 486 | 54015.2 | 133.6 |
| In the 3-100 keV energy band. | |
| In the 3-100 keV energy band assuming the distance to | |
| the source to be known (see table 2). |
The IBIS data were processed for a timing analysis using software developed and maintained in the National Astrophysical Institute in Palermo, Italy (http://www.pa.iasf.cnr.it/~ ferrigno/INTEGRALsoftware.html); a description of the data processing technique can be found in Segreto and Ferrigno (2007) and Mineo et al. (2006). Since one of our main objectives was to search for a correlation between timing and spectral characteristics of the emission, we also performed a comprehensive spectral analysis (in particular, we searched for and determined the parameters of cyclotron features) for the entire set of sources under study using the same software as that applied for our timing analysis. In accordance with the user’s guide for the INTEGRAL data processing software, the corresponding component at a 2% level was added in the XSPEC package to take into account the systematic uncertainty in our spectral analysis.
A log of pulsar observations is presented in Table 1. Its columns give (1) the source names, (2) INTEGRAL observatory orbit numbers, (3) dates of observations (in MJD), (4) exposure times, (5) source fluxes, and (6) source luminosities (calculated by assuming the distance to the source to be known) in the keV energy band. The published sources of distances to the objects under study are presented in Table 2.
Table 2
| Source name | Distance, kpc | Reference |
|---|---|---|
| 4U 0115+63 | 7 | Negueruela and Okazaki (2001) |
| V 0332+53 | 7 | Negueruela et al. (1999) |
| A0535+262 | 2.6 | Janot-Pacheco et al. (1987) |
| Vela X-1 | 2 | Sadakane et al. (1985) |
| Cen X-3 | 8 | Krzeminski (1974) |
| GX 301-2 | 5.3 | Kaper et al. (1995) |
| OAO 1657-415 | 6.4 | Chakrabarty et al. (2002) |
| Her X-1 | 6 | Howarth and Wilson (1983) |
| GX 1+4 | 6 | Chakrabarty and Roche (1997) |
| EXO 2030+375 | 7.1 | Wilson et al. (2002) |
It should be noted that since different authors used different models (Gaussian or Lorentzian profiles) in fitting the cyclotron line, there is a spread in its energies for the same sources and their states in the literature. Here, we used a Lorentzian profile in the form
| (1) |
where is the line center, is the line depth, and is the line width (Mihara et al. 1990). In our spectral analysis, we added this component to the “standard” fit for X-ray pulsars (a power law with a high-energy cutoff; White et al. 1983).
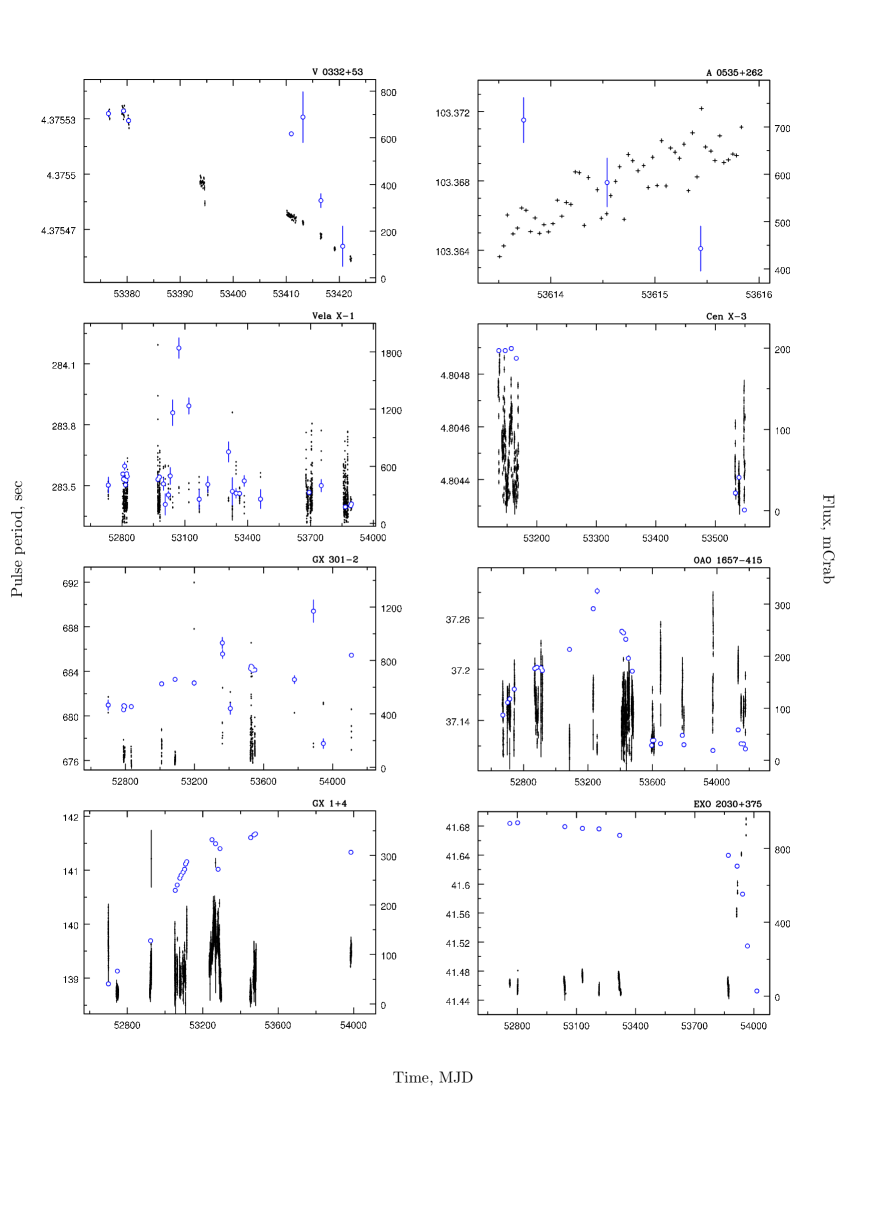
The time dependences of the observed source flux in the 20-60 keV energy band and the pulse period are shown in Fig. 1. The pulsar 4U 0115+63 was observed by INTEGRAL for a fairly short time interval in September 2004, in which its intensity and pulse period underwent no significant changes; for the pulsar Her X-1, the corresponding periods and fluxes were obtained by Klochkov et al. (2008b).
Our main results are the pulse profiles in wide energy channels (20-30, 30-40, 40-50, 50-70, 70-100 keV), the relative intensity maps in “energy – pulse phase” coordinates from IBIS data, and the dependencies of PF (calculated as , where and are the source intensities at the maximum and minimum of the pulse profile) on energy and luminosity. The intensity maps were obtained by convolving the pulsar light curve corrected for the background emission in narrow energy channels (the width was chosen to provide an optimal significance and was about 5 keV) whose centroid shifted from channel to channel by 2-3 keV. Each profile was constructed in units relative to the mean count rate in a given channel. We give the resulting map normalized to unity (all intensities were divided by the maximum value over the entire map). Such a representation reflects well the evolution of the profile structure (the change in the relative contribution of different peaks etc.). For each source, the results mentioned above are either averaged if the pulse profile did not change significantly with luminosity or most typical for different states (the source state is given in the corresponding captions to the figures). The dotted lines in the corresponding figures indicate the positions of the harmonics of the cyclotron absorption line (if it is observed in the spectrum). Note that the background is difficult to properly subtract at high energies ( keV, depending on the source spectrum and intensity) and, therefore, the formal values of PF can exceed 100% in some cases due to insufficient statistics. In current paper all relative intensity maps are presented in a black-and-white style; more brighter colors correspond to regions of higher intensities. The color maps are available in the electronic publication.
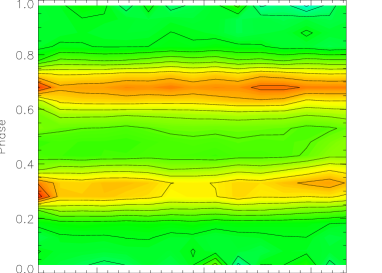
To illustrate the operation of the method used and to estimate the accuracy and validity of our timing analysis, we performed the corresponding calculations for the pulsar NP0532 in the Crab Nebula. This source was observed by INTEGRAL once in several months to calibrate the instruments. Figure 2 shows the pulse profile in the wide 20-50 keV energy channel and its relative intensity map. The profile has a characteristic double-peaked shape with a slight increase in the relative intensity of the second (relative to the zero phase we chose) peak with energy, which is clearly seen from the intensity map (Fig. 2b).

In Fig. 3a, the filled circles indicate the time dependence of the intrinsic pulsar period that was measured and reduced to the Solar system barycenter by the methods used here; the solid line represents an extrapolation of the pulsar period measurements in the radio frequency band by the Jodrell Bank Observatory in the form where is the time in MJD (Lyne et al., 1993; http://www.jb.man.ac.uk/pulsar/crab.html). Figure 3b shows the deviations of the periods measured by INTEGRAL from the extrapolation. The dashed line indicates the deviations of the actual period measurements by the Jodrell Bank Observatory from the same extrapolation. We see excellent agreement between the radio and gamma-ray measurements. Note also the detection of a pulsar glitch by both observatories at MJD .
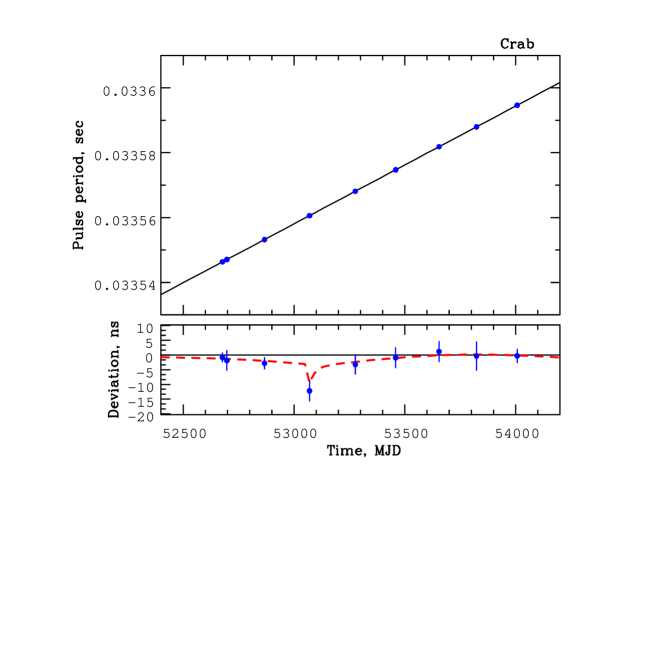
Comparison of the data obtained suggests that the pulse period determined for the pulsar NP0532 by INTEGRAL coincides with a high accuracy (a typical difference s) with that measured in the radio frequency band.
RESULTS
We studied X-ray pulsars in binary systems of various classes; however, all of these sources are united by the fact that a relatively high ( mCrab) flux is observed from them in the hard X-ray energy band and one or more harmonics of the cyclotron absorption resonance line are present in the spectra of most of them (see, e.g., Coburn et al. 2002; Filippova et al. 2005). Since our analysis required high statistics, the chosen sources either had long exposure times or were investigated during their outburst activity. Below, we briefly present the results obtained for each X-ray pulsar; our attention was focused on analyzing the dependences of PF on the energy and source luminosity.
4U 0115+63
The transient X-ray pulsar 4U 0115+63 was observed by INTEGRAL during an intense outburst in September 2004 at the decay phase, when the source luminosity was erg/s. The pulse profile characteristic of such a luminosity level in hard energy channels, along with the relative intensity map and the energy dependence of PF, are shown in Fig. 4. Note that the pulse profile properties and the PF variation over a wide range of pulsar luminosities, energies, and time were studied in detail by Tsygankov et al. (2007) based on the RXTE data obtained during the 1999 and 2004 outbursts. In particular, these authors found that a “wavelike” behavior of the profile with changing energy is observed over the entire luminosity range of the pulsar 4U 0115+63. The effect lies in the fact that each line of the level of equal intensity of the main peak does not lie at one phase for different energies but slightly shifts alternatively in one and the other directions. Interestingly, such a phase variability of the main peak is repeatable in energy and its period roughly coincides with the energy separation between the harmonics of the cyclotron absorption line in the pulsar spectrum (Fig. 4). The detection of a strong dependence of PF on energy and luminosity, according to which PF decreases with increasing luminosity and increases with energy, is no less important and interesting. In the latter case, this increase is not uniform but has local maxima near the cyclotron line harmonics (see, e.g., Figs. 3 and 4 from Tsygankov et al. 2007). Such a behavior of PF is confirmed by INTEGRAL data (Fig. 4).
Note that 4U 0115+63 was the first X-ray pulsar for which such peculiarities of PF were detected. Subsequently, similar dependences were found for several other X-ray pulsars with cyclotron lines in their spectra (see below).
V 0332+53
Like 4U 0115+63, the X-ray pulsar V 0332+53 was observed during an intense outburst in a wide range of fluxes from to mCrab (20-60 keV energy band), which corresponds to a spread in luminosities from to erg/s (assuming the distance to the pulsar to be kpc). Three harmonics of the cyclotron absorption line were identified in its spectrum (Coburn et al. 2005); the position of the fundamental harmonic is not constant with luminosity (Mihara et al. 1998). Tsygankov et al. (2006) were the first to show that the cyclotron energy in the source spectrum decreases linearly with increasing luminosity during outbursts. Dramatic changes in the pulse profile with luminosity and energy, especially near the cyclotron feature, were also found. In this study, we obtained a set of pulse profiles and relative intensity maps for the entire INTEGRAL data set (see http://hea.iki.rssi.ru/integral/pulsars). Here, as an illustration, we present only the results obtained for high (orbit 273, Fig. 5) and low (orbit 284, Fig. 6) states, where changes in the profile with luminosity are clearly seen.
Despite the above dramatic changes in the pulse profile, the energy dependences of PF are very similar in both cases: a general increase with energy and local features (maxima) near the cyclotron absorption line (Figs. 5 and 6). Interestingly, their positions are almost independent of the source luminosity and are shifted toward the higher energies with the center at keV.
A0535+262
The X-ray pulsar A0535+262 was observed by INTEGRAL near the maximum of its outburst in August-September 2005. Although the total exposure time was not very long, we arbitrarily divided it into three parts, depending on the source luminosity (see Table 1) and searched for pulsations and constructed the pulse profiles in each of them. The derived pulse profile is a fairly wide ( period) peak with two maxima and an indistinct dip in intensity between them (Fig. 7). The width of the dip increases with energy, while the amplitude of the second maximum decreases, as can be clearly seen from the relative intensity map(Fig. 7). In softer channels, the pulse profile is considerably more complex (Caballero et al. 2008).
The source spectrum exhibits two harmonics of the cyclotron absorption line ( and keV); the position of the fundamental harmonic measured using data from the Suzaku observatory remains almost constant in a wide range of luminosities (Terada et al. 2006). However, Caballero et al. (2008) pointed out a possible change in the position of the cyclotron line from keV during the precursor to keV during the main outburst. It is seen from the intensity map that the relative contribution of peaks in the profile is changed when crossing the cyclotron energy, that is typical for other pulsars from current review.
The source PF increases with energy; no distinct features are observed near the cyclotron line harmonics, which is most likely because the line depth is not so high and the line is fairly wide.
A change in the pulse period of the source with its intensity during the outburst is clearly seen from Fig. 1. Such a spin-up of the neutron star can be roughly described in terms of the theory for angular momentum transport from the disk to the neutron star (Ghosh and Lamb 1979):
| (2) |
where is the magnetic moment of the neutron star with magnetic field and radius , is a dimensionless function of the fastness parameter , is the distance to the system, and is its X-ray flux. Determining the magnetic field of the neutron star from a spectral analysis, we can estimate the distance to the binary system from Eq. (2) to be kpc, which agrees, within the error limits, with the results of optical observations (Janot-Pacheco et al. 1987).
Vela X-1
During almost the entire period of its INTEGRAL observations, the X-ray pulsar Vela X-1 exhibited an intense outburst activity (see, e.g., Krivonos et al. 2003) accompanied by significant changes in its pulse period (Fig. 1). At the same time, the shape of the source spectrum was almost constant, as were the positions of the two cyclotron line components at energies and keV (Filippova et al. 2005). Note that the absorption line at keV had long believed to be the fundamental harmonic of the cyclotron line and only the RXTE (Kreykenbohm et al. 2002) and INTEGRAL (Filippova et al. 2005) observations revealed a weaker lower harmonic at energies 24-26 keV.
The source pulse profile has a fairly complex morphology and depends strongly on the energy band: at low energies, the profile is an asymmetric five-peaked one with its gradual simplification to a double-peaked sinusoidal profile above keV (see, e.g., Kreykenbohm et al. (2002) and references therein). The evolution of the pulse profile in hard ( keV) energy channels is shown in Fig. 8. Emission pulsations from the source are detected up to keV with a double-peaked profile: the first peak is triangular in shape with a gradual rise and a sharp decay; the second peak is almost symmetric relative to its maximum. We see from the intensity map that the relative intensity of the first peak increases with energy, having a maximum near the first cyclotron line harmonic, while its maximum approaches that of the first peak in phase (Fig. 8). PF for Vela X-1 is rather high compared to other pulsars, % in the 20-30 keV energy band, and gradually increases with energy, having a local maximum near 50 keV, where the second cyclotron line harmonic is observed in the source spectrum (Fig. 8).
Cen X-3
Although the X-ray pulsar Cen X-3 is believed to be a persistent source, its intensity can change dramatically (by more than a factor of 10) both during the orbital cycle and on long time scales. These changes can be accompanied by significant changes in the pulse period (Fig. 9). Nagase et al. (1992) detected a possible cyclotron absorption line in the source spectrum at energy keV, which was confirmed by Santangelo et al. (1998). Subsequently, Burderi et al. (2000) showed that the position of the cyclotron line depends strongly on the pulse phase and can change with the range from to keV. Despite dramatic changes in the intensity of Cen X-3 during its INTEGRAL observations, we found no significant changes in the position of the cyclotron line with a mean energy of keV associated with them.
The source pulse profile depends on the orbital phase and energy band: in a high state, the profile is double-peaked at low energies; the relative intensity of the peaks changes with increasing energy and the main peak disappears almost completely at high energies (above keV) (Nagase et al. 1992). The X-ray pulsar 4U 0115+63 exhibits a similar behavior (Tsygankov et al. 2007). PF for the source is rather high (% at 20-30 keV) and increases monotonically with energy without any features (Fig. 9).
GX 301-2
The pulse profile for the X-ray pulsar GX 301-2 has been adequately investigated over a wide energy range (see, e.g., Borkus et al. 1998; Tsygankov et al. 2004). It has a double-peaked sinusoidal shape with a constant ratio of the peak intensities at different energies. Analysis of the behavior of the cyclotron line revealed a strong variability of its position in the pulsar spectrum, depending on the pulse phase and intrinsic source luminosity (La Barbera et al. 2005). Thus, for example, the cyclotron line energy in a state with a low luminosity ( erg/s) was keV, while it was keV at maximum luminosity ( erg/s). Similar changes in the cyclotron energy with luminosity were also revealed by the INTEGRAL observatory (Filippova et al. 2005).
Despite significant changes in the flux from the source, especially near the periastron and apoastron, its INTEGRAL pulse profile remains fairly stable (see Fig. 10 and http://hea.iki.rssi.ru/integral/pulsars), while PF increases with energy almost linearly. Below, we will show that, in this case, it depends significantly on the source luminosity.
OAO 1657-415
Despite the fairly long INTEGRAL exposure time for this pulsar and the hard spectrum of this object, as yet no cyclotron absorption line has been reliably detected in its spectrum (Filippova et al. 2005; Barnstedt et al. 2008). This may be indicative of a fairly strong magnetic field near the neutron star surface, just as is observed with INTEGRAL in other pulsars (see, e.g., Tsygankov and Lutovinov 2005a, 2005b). Note also that the pulsar exhibited a dramatic variability, both aperiodic one and one related to the orbital cycle, during its INTEGRAL observations. However, the pulse period changes revealed no correlation between them and the changes in the source flux (Fig. 11).
The pulse profile is in the shape of a wide asymmetric peak with two maxima in the standard X-ray energy band whose peculiarity is a dip at phase 0.4-0.5 (see, e.g., Lutovinov et al. 1994). The amplitude of the second maximum decreases as we pass to the harder energies, the dip is essentially “smeared”, and the pulse profile turns into an asymmetric one with a maximum near phase 0.25 (Fig. 11); PF increases with energy monotonically, without any features (see Fig. 11 and Barnstedt et al. (2008)).
Her X-1
The X-ray pulsar Her X-1 is the first source with a cyclotron resonance scattering feature detected in its spectrum (Truemper et al. 1978). Over several decades, the properties of this source have been studied by many authors based on data from various X-ray observatories. However, only in recent years has serious progress been achieved in this question: in particular, Staubert et al. (2007) showed that, in contrast to bright pulsars, the energy of the fundamental cyclotron line harmonic in Her X-1 is directly proportional to the source luminosity, while using data from the Suzaku observatory, Enoto et al. (2008) have recently confirmed the presence of a second cyclotron line harmonic in the spectrum at keV, the possible existence of which was previously claimed by Di Salvo et al. (2004) based on BeppoSAX data. This discovery makes this object the sixth in the list of pulsars with the detected second cyclotron frequency harmonic.
The pulsar Her X-1 is one of the few X-ray sources with variability simultaneously on three different time scales: the pulse period, the orbital period, and the super-orbital period related to accretion disk precession. The source pulse profile depends strongly on both energy (Fig. 12) and phase of the super-orbital period (http://hea.iki.rssi.ru/integral/pulsars); it was analyzed in detail (including phase-resolved spectroscopy) on the basis of INTEGRAL data (Klochkov et al. 2008b). Here, we will note the behavior of PF with energy: apart from its increase with energy, a local feature at energies keV (Fig. 12) located near the cyclotron absorption line is present on the plot. This feature can be interpreted either as a local maximum shifted relative to the fundamental harmonic toward the lower energies or as a local PF minimum shifted toward the higher energies.
GX 1+4
Ferrigno et al. (2007) claimed the possible detection of a cyclotron feature in the source spectrum based on INTEGRAL data at keV. Previously, the magnetic field was estimated only by indirect methods (see, e.g., Cui 1997); its strength turned out to be an order of magnitude larger than the above value. Note that based on first 2.5 years of the INTEGRAL observations, Filippova et al. (2005) detected no cyclotron feature in the source spectrum.
As regards the changes in the pulse profiles, many authors (see, e.g., Greenhill et al. (1998) and references therein) showed that the profile clearly depends not only on the source intensity but also on the spin-up. According to IBIS data, the source pulse profile is single-peaked with a slight tendency for the separation into two sub-peaks with increasing energy (Figs. 13 and 14). In some cases (Fig. 13), the separation into two sub-peaks is observed even in the softest available energy channel. A detailed analysis of the double-peaked pulse profile structure based on INTEGRAL data can be found in Ferrigno et al. (2007). PF is practically independent of the energy and source luminosity; note only its local increase near the energy 45 keV (Fig. 13) in March 2003.
Throughout the history of its studies, the pulsar GX1+4 had unique spin-up and spin-down characteristics. During its INTEGRAL observations, the pulsar spun down almost uniformly approximately until May 2004, following which the pulse period remained relatively constant. At the spin-down phase, the period increased with a mean rate of 1.8 s/yr.
EXO 2030+375
Like the sources 4U 0115+63 and V 0332+53, the X-ray pulsar EXO 2030+375 is a member of a binary system with a Be star and manifests itself during outbursts; in contrast to the two previous objects, the outburst observed from EXO 2030+375, can be both normal, with an intensity mCrab, and giant, when the flux from the source increases almost to 1 Crab. During one of such giant outbursts (), the INTEGRAL observatory detected a significant spin-up of the neutron star (Fig. 1), which, in addition, correlated linearly with the rise in the source luminosity (see also Klochkov et al. 2007).
EXO 2030+375 is one of the first X-ray pulsars to be systematically studied in the area of the dependence of the pulse profile on the intrinsic luminosity (Parmar et al. 1989). The authors found that the profile changes both with luminosity and with energy in the standard X-ray energy band. Significant changes in the pulse profile with source luminosity are also observed in the hard energy band (Figs. 15 and 16), with the energy dependences of PF being similar in both cases. For a bright state during an outburst, this dependence is given in Klochkov et al. (2008a). These authors also detected a possible cyclotron absorption line in the source spectrum. This feature manifests itself only in a narrow range of pulse phases at energy keV. Unfortunately, such a high energy does not allow the features in the dependence of PF on energy at the cyclotron frequency observed in other pulsars to be detected at a statistically significant level.
CONCLUSIONS
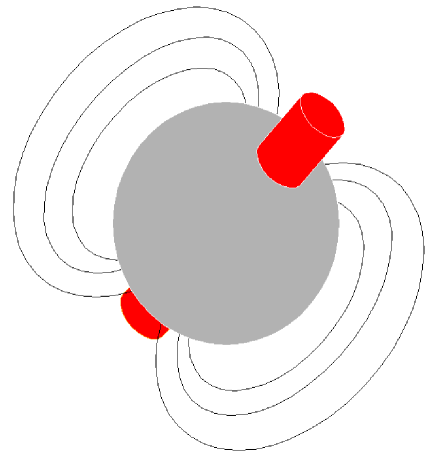
We analyzed in detail the timing characteristics of the hard ( keV) X-ray emission from ten bright X-ray pulsars observed by the INTEGRAL observatory. In particular, we have investigated the dependence of PF on the luminosity and energy band for the first time and showed that PF increases with energy for all pulsars; in many cases, this increase is not monotonic, exhibiting local features near the cyclotron line harmonics, which is most likely attributable to the effect of resonance absorption. In addition, we compiled a catalog of pulse profiles in five hard energy channels (20-30, 30-40, 40-50, 50-70, and 70-100 keV) for all the observed states of the pulsars under study and their luminosity levels (http://hea.iki.rssi.ru/integral/pulsars). A characteristic feature of most of the double-peaked pulse profiles is a decrease in the relative intensity of one of the peaks with increasing energy and decreasing source luminosity. Such a behavior and the increase in PF with energy noted above can be qualitatively explained in terms of a simple geometric model proposed by Tsygankov et al. (2007) and Lutovinov and Tsygankov (2008). In this model, accretion columns whose height depends on the pulsar luminosity are formed at the poles of a neutron star with a dipole magnetic field; the rotation axis of the neutron star is inclined with respect to the magnetic dipole axis and the observer in such a way that the latter can see the accretion column over its entire height at one of the poles and only its upper part at the other pole (see Fig. 17). Since the temperature of the accretion column increases toward its base (Basko and Sunyaev 1976), high-energy photons are emitted from regions close to the neutron star surface, while “soft” photons are formed in the upper part of the column. Thus, an observer will see two formation regions of soft emission and only one formation region of hard emission, which will correspond to a change of the pulse profile from double-peaked to single-peaked with increasing energy. As the luminosity decreases, the column height also decreases; the visible part of the second column decreases and it can disappear altogether from the observer’s field of view at some time, which also leads to the transition from a double-peaked pulse profile to a single-peaked one. The observed increase in PF with energy can also be naturally explained in terms of this model: at higher energies, the contrast between the minimum and maximum visible surfaces of the accretion columns is highest. Note that a similar model was proposed by David et al. (1998) to explain the dependence of the pulse profile for the X-ray pulsar GX1+4 on its intensity.
It should be noted that the simple model described above gives only qualitative (in the first approximation) explanations for some of the observed effects. During further (quantitative) modeling, the temperature distribution along the column, the beam pattern of emission, its dependence on energy and luminosity, the bending of light rays in strong gravitational fields near the neutron star surface, etc. should be included in the model.
The increase in PF with energy may also be related to the characteristic shape of the spectra for X-ray pulsars with an exponential cutoff at high energies. The local PF features near the cyclotron line harmonics may be associated with changes in the opacity of matter at these energies and its strong dependence on the viewing angle. In that case, the cyclotron line parameters (energy, optical depth, equivalent width, etc.) will change significantly over one rotation (pulse) of the neutron star (Tsygankov et al. 2009, prepared for publication).
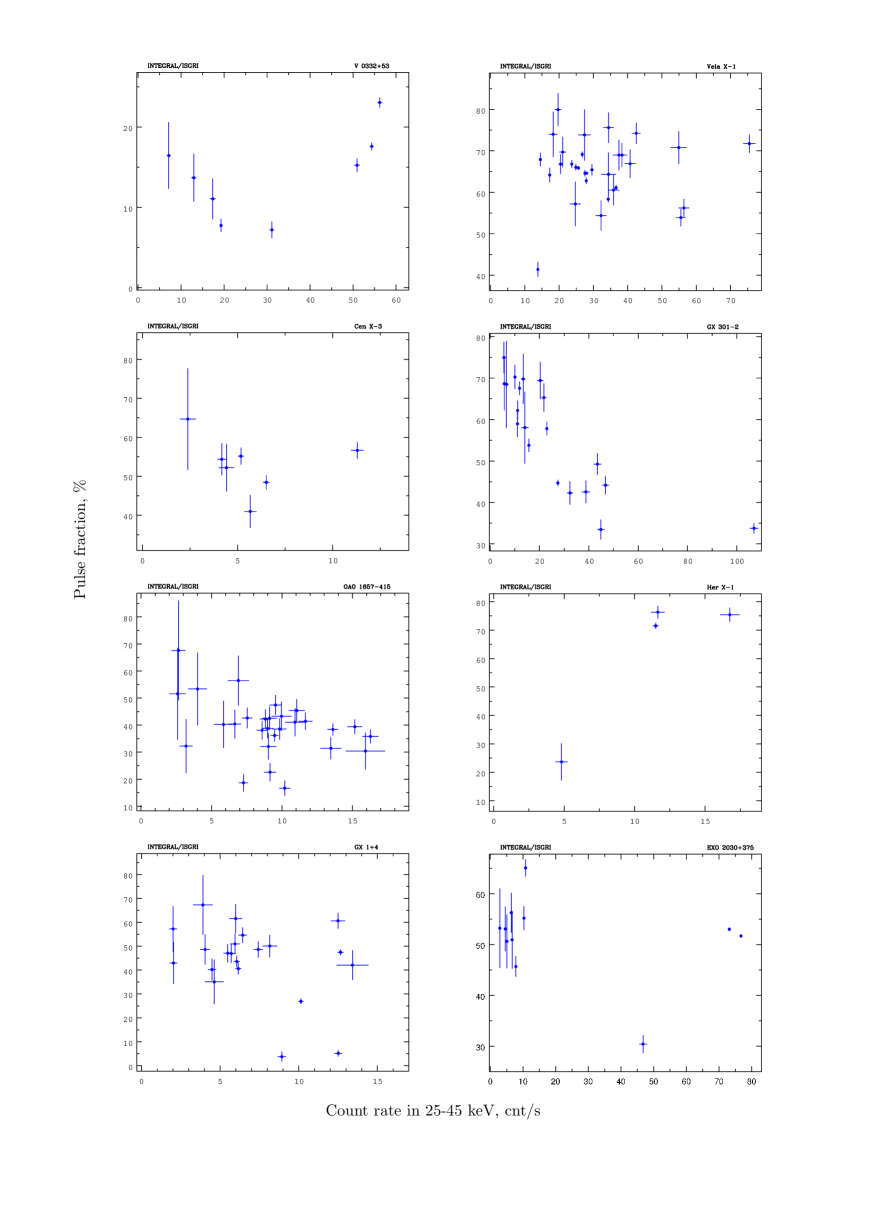
The Dependence of PF on Source Intensity
As we showed above, the pulse profiles for X-ray pulsars often depend on their intensity, which, in turn, can change PF. To test and illustrate this assumption, we constructed the dependence of PF in the 25-45 keV energy band on the source intensity in the same band for the entire set of available data (in contrast to Fig. 1, the results of this analysis are also presented for the pulsar Her X-1, which was observed in different states, and are not presented for the pulsar A0535+63, for which the dynamic range of observed INTEGRAL fluxes was too small for any changes in PF to be observed).
X-ray pulsars for which PF decreases with source luminosity can be separated from the set of results presented in Fig. 18: GX 301-2 and OAO1657-415. Such a behavior of PF can be explained in terms of the model described above. Pulsars that exhibit a fairly large spread in PF at close luminosities but show no general trend in the wide dynamic range of observed fluxes represent another group: Vela X-1, Cen X-3, and GX 1+4. In this case, the source luminosity is most likely insufficient for the formation of an accretion column and the emission is formed near the neutron star surface (the latter is indirectly confirmed by the absence of any change in the position of the cyclotron line with luminosity for Cen X-3 and Vela X-1); the observed changes in PF may be related to local inhomogeneities of the stellar wind or accretion flows. For the X-ray pulsar Her X-1, the sharp decrease in PF observed during a low on state may stem from the fact that at this moment the emission is partially scattered in the corona at the edge of a precessing accretion disk (Jones and Forman 1976). The PF dependence obtained for the pulsar V 0332+53 is most difficult to explain: PF decreases with increasing luminosity at low luminosities, as is expected from the model described above, but it increases with luminosity at high luminosities.
ACKNOWLEDGMENTS
We thank U. Poutanen, M. Revnivtsev, A. Serber, and V. Suleimanov for useful discussions of results and valuable remarks. This work was supported by grant no. NSh-5579.2008.2 from the President of Russia, the “Origin and Evolution of Stars and Galaxies” Program of the Presidium of the Russian Academy of Sciences, and the Russian Foundation for Basic Research (projects no. 07-02-01051 and 08-08-13734). We used data from the INTEGRAL Science Data Center (Versoix, Switzerland) and the Russian INTEGRAL Science Data Center (Moscow, Russia). We are grateful to the software developers from the National Astrophysical Institute in Palermo (Italy). This work was performed in part during visits to the International Space Science Institute (ISSI, Bern), to which we express our deep gratitude.
REFERENCES
1. A. La Barbera, A. Segreto, A. Santangelo, et al., Astron. Astrophys. 438, 617 (2005).
2. J. Barnstedt, R. Staubert, A. Santangelo, et al., Astron. Astrophys. 486, 293 (2008).
3. M. M. Basko and R. A. Sunyaev, Astron. Astrophys. 42, 311 (1975).
4. M. M. Basko and R. A. Sunyaev, Mon. Not. R. Astron. Soc. 175, 395 (1976).
5. V. V. Borkus, A. S. Kaniovsky, R. A. Sunyaev et al., Pis’ma Astron. Zh. 24, 83 (1998) [Astron. Lett. 24, 60 (1998)].
6. T. Bulik, D. Gondek-Rosinska, A. Santangelo, et al., Astron. Astrophys. 404, 1023 (2003).
7. L. Burderi, T. Di Salvo, N. R. Robba, et al., Astrophys. J. 530, 429 (2000).
8. I. Caballero, A. Santangelo, P. Kretschmar, et al., Astron. Astrophys. 480, L17 (2008).
9. D. Chakrabarty and P. Roche, Astrophys. J. 489, 254 (1997).
10. D. Chakrabarty, Z. Wang, A.M. Juett, et al., Astrophys. J. 573, 789 (2002).
11. W. Coburn, W. A. Heindl, R. E. Rothschild, et al., Astrophys. J. 580, 394 (2002).
12. W. Coburn, P. Kretschmar, I. Kreykenbohm, et al., Astron. Telegrams 381, 1 (2005).
13. W. Cui, Astrophys. J. 482, 163 (1997).
14. P. David, P. Laurent, M. Denis, et al., Astron. Astrophys. 332, 165 (1998).
15. T. Enoto, K. Makishima, Y. Terada, et al., Publ. Astron. Soc. Japan 60, S57 (2008).
16. C. Ferrigno, A. Segreto, A. Santangelo, et al., Astron. Astrophys. 462, 995 (2007).
17. E. V. Filippova, S. S. Tsygankov, A. A. Lutovinov, and R. A. Sunyaev, Pis’ma Astron. Zh. 31, 729 (2005) [Astron. Lett. 31, 729 (2005)].
18. F. Frontera, D. dal Fiume, E. Morelli, and G. Spada, Astrophys. J. 298, 585 (1985).
19. P. Ghosh and F. Lamb, Astrophys. J. 234, 296 (1979).
20. J. G. Greenhill, D. Galloway, and M. C. Storey, Publ. Astron. Soc. Australia 15, 254 (1998).
21. I. D. Howarth and B. Wilson, Mon. Not. R. Astron. Soc. 204, 1091 (1983).
22. E. Janot-Pacheco, C. Motch, and M. Mouchet, Astron. Astrophys. 177, 91 (1987).
23. C. Jones and W. Forman, Astrophys. J. 209, 131 (1976).
24. L. Kaper, H. J. G. Lamers, E. Ruymaekers, et al., Astron. Astrophys. 300, 446 (1995).
25. D. Klochkov, D. Horns, A. Santangelo, et al., Astron. Astrophys. 464, 45 (2007).
26. D. Klochkov, A. Santangelo, R. Staubert, and C. Ferrigno, Astron. Astrophys. 491, 833 (2008a).
27. D. Klochkov, R. Staubert, K. Postnov, et al., Astron. Astrophys. 482, 907 (2008b).
28. I. Kreykenbohm, W. Coburn, J. Wilms, et al., Astron. Astrophys. 395, 129 (2002).
29. R. Krivonos, N. Produit, I. Kreykenbohm, et al., Astron. Telegrams 211, 1 (2003).
30. W. Krzeminski, Astrophys. J. 192, L135 (1974).
31. F. Lebrun, J. P. Leray, P. Lavocat, et al., Astron. Astrophys. 411, L141 (2003).
32. A. A. Lutovinov, S. A. Grebenev, M. N. Pavlinsky, and R. A. Sunyaev, Pis’ma Astron. Zh. 20, 631 (1994) [Astron. Lett. 20, 538 (1994)].
33. A. A. Lutovinov and S. S. Tsygankov, AIP Conf. Proc. 1054, 191 (2008).
34. A. Lyne, R. Pritchard, and F. Graham-Smith, Mon. Not. R. Astron. Soc. 265, 1003 (1993).
35. P. Meszaros and W. Nage, Astrophys. J. 299, 138 (1985).
36. T. Mihara, K. Makishima, T. Ohashi, et al., Nature 346, 250 (1990).
37. T. Mihara, K. Makishima, and F. Nagase, Adv. Space Res. 22, 987 (1998).
38. T. Mineo, C. Ferrigno, L. Foschini, et al., Astron. Astrophys. 450, 617 (2006).
39. F. Nagase, R. H. D. Corbet, C. S. R. Day, et al., Astrophys. J. 396, 147 (1992).
40. I. Negueruela and A. T. Okazaki, Astron. Astrophys. 369, 108 (2001).
41. I. Negueruela, P. Roche, J. Fabregat, and M. J. Coe, Mon. Not. R. Astron. Soc. 307, 695 (1999).
42. A. N. Parmar, N. E.White, and L. Stella, Astrop hys. J. 338, 373 (1989).
43. K. Sadakane, R. Hirata, J. Jugaku, et al., Astrophys. J. 288, 284 (1985).
44. T. Di Salvo, A. Santangelo, and A. Segreto, Nucl. Phys. B Proc. Suppl. 132, 446 (2004).
45. A. Santangelo, S. del Sordo, A. Segreto, et al., Astron. Astrophys. 340, 55 (1998).
46. A. Segreto and C. Ferrigno, in Proc. of the 6th INTEGRAL Workshop The Obscured Universe, Ed. by S. Grebenev, R. Sunyaev, and C. Winkler, ESA SP-662 (Noordwijk, 2007), p. 633; arXiv:0709.4132 (2007).
47. R. Staubert, N.I. Shakura, K.A. Postnov, et al., Astron. Astrophys. 465, 25 (2007).
48. Y. Terada, T. Mihara, M. Nakajima, et al., Astrophys. J. 648, 139 (2006).
49. J. Truemper,W. Pietsch, C. Reppin, et al., Astrophys. J. 219, 105 (1978).
50. S. S. Tsygankov and A. A. Lutovinov, Pis’ma Astron. Zh. 31, 99 (2005a) [Astron. Lett. 31, 88 (2005)].
51. S. S. Tsygankov and A. A. Lutovinov, Pis’ma Astron. Zh. 31, 427 (2005b) [Astron. Lett. 24, 380 (1998)].
52. S. S. Tsygankov, A. A. Lutovinov, S. A. Grebenev, et al., Pis’ma Astron. Zh. 30, 596 (2004) [Astron. Lett. 30, 540 (2004)].
53. S. S. Tsygankov, A. A. Lutovinov, E. M. Churazov, and R. A. Sunyaev, Mon. Not. R. Astron. Soc. 371, 19 (2006).
54. S. S. Tsygankov, A. A. Lutovinov, E. M. Chupazov, and R. A. Sunyaev, Pis’ma Astron.Zh. 33, 417 (2007) [Astron. Lett. 33, 368 (2007)].
55. Y.-M. Wang and G. L. Welter, Astron. Astrophys. 102, 97 (1981).
56. N. White, J. Swank, and S. Holt, Astrophys. J. 270, 771 (1983).
57. C. A. Wilson, M. H. Finger, M. J. Coe, et al., Astrophys. J. 570, 287 (2002).
58. C. Winkler, T. J.-L. Courvoisier, G. Di Cocco, et al., Astron. Astrophys. 411, L1 (2003).