11email: B. Stelzer, stelzer@astropa.unipa.it 22institutetext: SUPA, School of Physics & Astronomy, University of St. Andrews, North Haugh, St.Andrews KY 16 9SS, United Kingdom
A Chandra and Spitzer census of the young star cluster
in the reflection nebula NGC 7129
Abstract
Context. The reflection nebula NGC 7129 has long been known to be a site of recent star formation as evidenced, e.g., by the presence of deeply embedded protostars and HH objects. However, studies of the stellar population produced in the star formation process have remained rudimentary. A major step forward was made with recent Spitzer imaging of the region.
Aims. This study represents the next step towards a systematic assessment of the pre-main sequence population in NGC 7129. Completeness of the pre-main sequence sample is necessary for studying key features that allow to understand the star forming process, such as disk evolution, dynamical evolution and mass function. At a presumed age of Myr, NGC 7129 is in the critical range where disks around young stars disappear.
Methods. We make use of X-ray and IR imaging observations to identify the pre-main sequence stars in NGC 7129. We define a sample of Young Stellar Objects based on color-color diagrams composed from IR photometry between and m, from 2 MASS and Spitzer, and based on X-ray detected sources from a Chandra observation.
Results. This sample is composed of Class II and Class III candidates. It has been selected from infrared sources in the Chandra field ( objects with photometry in all four Spitzer/IRAC bands, objects with near-IR photometry) and the X-ray sources detected with Chandra. The sample is estimated to be complete down to . The most restricted and least biased sub-sample of pre-main sequence stars is composed of lightly absorbed ( mag) stars in the cluster core. This sample comprises Class II and Class III sources, it has a disk fraction of %, and a median X-ray luminosity of .
Conclusions. Despite the various uncertainties related to the sample selection, absorption, mass distribution, distance and, consequently, the computation of disk fraction and X-ray luminosities, the data yield consistent results. In particular, we confirm the age of Myr for the NGC 7129 cluster. The derived disk fraction is similar to that of Orionis, smaller than that of Cha I ( Myr), and larger than that of Upper Sco ( Myr). The X-ray luminosity function is similar to that of NGC 2264 ( Myr) but fainter than that of the Orion Nebula Cluster ( Myr). The pre-main sequence census should be further refined and extended with optical photometric and spectroscopic searches for cluster members.
Key Words.:
X-rays: stars – Infrared: stars – stars: pre-main sequence, formation1 Introduction
Young stars undergo various phases on their way to the main-sequence. Their different evolutionary stages are recognized by specific observational features, such as excess emission over the expectation for a stellar photosphere that arises from circumstellar matter. Initially, Young Stellar Objects (YSOs) are embedded in envelopes of cold and dusty material that emit prominently at infrared (IR) and sub-millimeter wavelengths. The youngest, protostellar phases are termed Class 0 and Class I in a classification scheme based on the spectral energy distribution (SED) (Lada, 1987). As their evolution proceeds, disk accretion and reprocessing of stellar light in the disk become the identifying feature and the YSO is of Class II. Finally, when all circumstellar matter has dispersed or accreted onto the star a Class III object is left that is unconspicuous at IR bands as its SED is purely photospheric.
Low sensitivity of mid-IR detectors have long hampered systematic searches for the signatures of circumstellar matter revealing young stars in their accretion and/or embedded phases. The launch of Spitzer has dramatically increased the census of YSOs in various star forming regions (see e.g. Evans et al., 2009, and references therein). However, as suggested above, IR observations have no potential for discriminating young stars after the disk has dispersed from evolved stars. Therefore, a YSO census based on IR data alone is highly biased and other techniques are needed to reveal the Class III population. Diskless stars can, indeed, be identified on basis of their strong X-ray emission, a prevalent characteristic for the whole pre-main sequence (pre-MS) evolution. X-ray and IR observations provide thus complementary tools to identify the complete pre-MS population. Knowing all members of a given star forming region is essential for understanding fundamental problems such as disk evolution, dynamical evolution and the initial mass function.
We present here a Chandra X-ray and Spitzer IR census of the star cluster in NGC 7129. According to Racine (1968), the NGC 7129 reflection nebula in Cepheus is located at a distance of kpc. Shevchenko & Yakubov (1989) published a value of pc. Both distance estimates are based on optical photometry of few stars and ought to be considered quite uncertain. NGC 7129 is dominated by the young B-type stars BD +65 1637 (SVS 7) and BD +65 1638 (SVS 8) in a cavity surrounded by dense molecular ridges that form the interface with the molecular cloud (Miskolczi et al., 2001). A third Herbig Be star, LkH 234 (SVS 12), is located on the eastern end of the ridge. SVS 12 was presumably formed in the ridge following compression of material (Bechis et al., 1978). Further signs of very recent star formation in NGC 7129 are deeply embedded protostars identified in IR images (Weintraub et al., 1994; Cabrit et al., 1997), and a large outflow initially thought to originate from SVS 12, but later assigned to an embedded pre-MS object IRS 6 located of the Herbig star (Cabrit et al., 1997; Fuente et al., 2001). The region also contains the probably youngest intermediate-mass object known at present, the Class 0 star FIRS-2 (Eiroa et al., 1998; Fuente et al., 2005). Several Herbig-Haro outflows (Hartigan & Lada, 1985; Strom et al., 1986; Miranda et al., 1993) and a cluster of low-mass pre-MS stars are associated with NGC 7129. The most recent census of optical emission line stars counts objects (Magakian et al., 2004).
Spitzer imaging observations for NGC 7129 have been reported by Gutermuth et al. (2004) and Muzerolle et al. (2004). With a combination of IR photometry from ground-based observations, 2 MASS and IRAC a total of objects with circumstellar disks could be identified, half of them in the pc wide cluster core. The longer wavelength images obtained with MIPS are dominated in the central region of NGC 7129 by nebular emission. Therefore, MIPS could detect YSOs only in the outer parts of the reflection nebula. The discovery of over protostars in the outskirts of the cluster led Muzerolle et al. (2004) to suggest that the area of active star formation in NGC 7129 extends over a large area of pc.
NGC 7129 has now been studied at virtually all wavelengths from the sub-millimeter (Font et al., 2001) to optical bands but a systematic investigation of X-ray emission from the pre-MS population is absent from the literature. We close this important gap with a Chandra observation of NGC 7129 that we combine with Spitzer photometry and data at other wavelengths from the literature for the few previously known cluster members. This new assessment of the cluster population is a solid basis for future optical photometric and spectroscopic observations with the aim to confirm the new members. Sect. 2 describes the X-ray data analysis. We give a brief description of the Spitzer photometry provided to us by R.Gutermuth (Sect. 3) and of the optical catalog of NGC 7129 (Sect. 4). We present our selection criteria for YSOs and the resulting census of NGC 7129 members in Sect. 5. In Sect. 6 the results are presented. We discuss selected SEDs, derive the disk fraction and the X-ray luminosity function for the pre-MS cluster, and add a note on the X-ray emission from protostars. A summary and conclusions are given in Sect. 7.
2 Chandra data analysis
A ksec long Chandra observation targeting the Herbig star SVS 12 was carried out on Mar 11, 2006 (start of observation UT 14h29m18s). The observation was obtained within a survey for X-ray emission from Herbig stars, and the data for the three B-type stars in the field-of-view were presented by Stelzer et al. (2009). The prime instrument for this observation was ACIS-S3 because of the higher sensitivity at low energies of the ACIS spectroscopic array with respect to the imaging array. ACIS-S2 and all four ACIS-I chips were turned on as well.
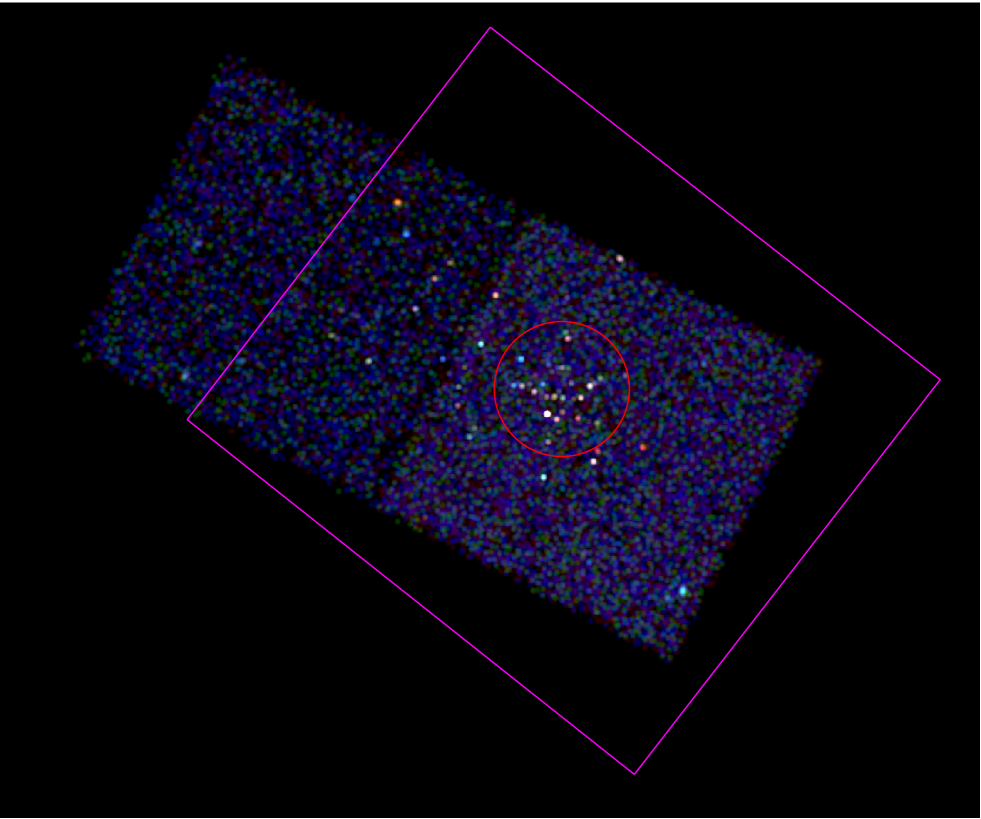
SVS 12 lies at the heart of the NGC 7129 reflection nebula giving serendipitously access to study for the first time the X-ray emission from the associated young star cluster. The cluster core was estimated by Gutermuth et al. (2004) from band star counts to comprise a pc radius, corresponding to less than at the distance of kpc. Therefore, most X-ray sources are expected to be located on a single ACIS chip. We analysed only data from ACIS-S3 and ACIS-S2 that overlap (partially) with the Spitzer survey. Fig. 1 shows the Chandra ACIS-S2 and ACIS-S3 image with the Spitzer/IRAC field overlaid. The cluster core of radius (Gutermuth et al., 2004) is marked as red circle.
The data analysis was performed with the CIAO software
package111CIAO is made available by the CXC and can be downloaded
from
http://cxc.harvard.edu/ciao/download/ version 4.0.
We started our analysis with the level 1 events file provided by the
Chandra X-ray Center (CXC).
In the process of converting the level 1 events file to a level 2 events file
for each of the observations we performed the following steps:
We removed the pixel randomization which is automatically applied by the CXC pipeline
in order to optimize the spatial resolution.
We filtered the events file for event grades
(retaining the standard grades , , , , and ),
and applied the standard good time interval file.
Events flagged as cosmic rays were not removed in our analysis. In principle, such events
can lead to the detection of spurious sources. However, if identified on the position of a
bright X-ray source, the flag is often erroneous (as a result of the event pattern used for
the identification of cosmic rays).
Source detection was carried out in the keV band for the ACIS-S3 and ACIS-S2 chips with the wavdetect algorithm (Freeman et al., 2002) using an image with spatial resolution of /pixel and a congruent, monochromatic exposure map for keV. The wavdetect algorithm correlates the data with a mexican hat function to search for deviations from the background. This method is well suited for separating closely spaced point sources. We used wavelet scales between and in steps of . The detection significance was set to to avoid spurious detections.
We cleaned the resulting source list on basis of the individual signal-to-noise (S/N) of each detection. First, the point-spread-function (PSF) was computed for each X-ray position. A circular source photon extraction region was defined as the area that contains % of the PSF. The background was extracted individually from a squared region centered on the source extraction area and several times larger than the latter one. If detected X-ray sources are in the selected background area a circular area around them was eliminated from the background region. The S/N was computed from the counts summed in the source and background areas, respectively, after applying the appropriate area scaling factor to the background counts. In general, the background is negligibly low. We removed all objects with S/N as likely spurious from the wavdetect X-ray source list. In Table 2 we provide the final list of X-ray sources.
There are only X-ray sources with more than counts in the keV band (sources NGC 7129-S3-X2,..-X12,…-X13,…-X23 and NGC 7129-S2-X9) such that a detailed spectral analysis is not feasible for most objects. We have extracted and analysed the X-ray spectra for the five brightest sources mentioned above. An individual response matrix and auxiliary response were extracted for each of them using standard CIAO tools. Each spectrum was binned to a minimum of or more counts per bin depending on the photon statistics. As the background of ACIS is very low ( count in the source extraction area) it can be neglected. We fitted each spectrum in the XSPEC 12.4.0 environment with a one-temperature thermal model spectrum (Raymond & Smith, 1977) subject to photo-absorption (wabs * apec). More complex spectral models are not considered due to the low statistics of these data. Fig. 2 shows the data with the best fit spectral models and residuals. For NGC 7129-S3-X12 and NGC 7129-S3-X13, that are partially overlapping, we have used the photon extraction regions defined by Stelzer et al. (2009). All five spectra are compatible with and in the range of keV.


In cases of low photon statistics it is common practice to examine X-ray hardness ratios. We define three energy bands: soft ( keV), medium ( keV) and hard ( keV) from which we construct two colors following Albacete Colombo et al. (2007), and . Fig. 3 shows the hardness ratio diagram where a grid calculated from a one-temperature thermal model with photo-absorption is overlaid. The majority of X-ray sources is compatible with a temperature of keV and moderate () absorption. For three of the five sources discussed in the previous paragraph, the and derived from Fig. 3 agree within the % confidence level with the values obtained from the spectral fitting. For NGC 7129-S3-X12 and NGC 7129-S3-X13 the XSPEC fits yield a cooler and less absorbed spectrum than the hardness ratios. These are the two stars with the best photon statistics and a approach may not be appropriate.
Column densities and temperatures inferred from X-ray hardness ratios can in principle be used to derive X-ray luminosities of individual stars when the statistics are too poor for detailed spectral analysis. However, as seen above in the comparison to the spectral results for the brightest stars, even the use of hardness ratios may be associated with large uncertainties. Furthermore, not all data points lie in the region covered by physically reasonable models (see Fig. 3). For the calculation of X-ray luminosities of objects outside the grid we use the median temperature and absorbing column of the sample with net source counts, while for all objects on the grid we use their individual and estimates. Moreover, we anticipate in Fig. 3 a trend of higher absorption for Class II with respect to Class III sources. (The YSO classification scheme is described in Sect. 5.) Therefore, we compute separate medians for these two YSO groups. We find for Class II a median of and for Class III of . These differences can probably be ascribed to additional absorbing material in the circumstellar environment of Class II stars. The median temperatures are keV and keV for Class II and III, respectively. A difference in between these two groups is not expected. We refrain from analysing its significance because the X-ray luminosity depends very little on the temperature in this range.
With the values of and described in the previous paragraph, a count-to-flux conversion factor is obtained for each X-ray source with PIMMS222The Portable Interactive Multi-Mission Simulator (PIMMS) is accessible at http://asc.harvard.edu/toolkit/pimms.jsp from a one-temperature Raymond-Smith model. The corresponding X-ray luminosities are given in col. 9 of Table 2. Evidently, these numbers are associated with large errors.
As an alternative, we apply also a different method to derive the column density, by computing individual estimates based on the of each star using a gas-to-dust conversion law of (e.g. Predehl & Schmitt, 1995). Note that the ratio may vary for different star forming environments as shown by Vuong et al. (2003) but an assessment of its value in NGC 7129 is out of reach with the presently available data. The optical extinctions are obtained from dereddening of the objects in the vs. diagram, and is, obviously, available only for X-ray sources with near-IR photometry. A comparison of the X-ray luminosity function derived with these two approaches is given in Sect. 6.3.

3 Infrared catalog (Spitzer and 2 MASS)
NGC 7129 was observed by the Spitzer Space Telescope with IRAC in four wavelength bands from to m and with MIPS at m. These observations are part of the Spitzer Young Stellar Cluster Survey, initially presented by Megeath et al. (2004) and further analysed by Gutermuth et al. (2004), Muzerolle et al. (2004), and Gutermuth et al. (2009). Henceforth, we refer to the latter paper as G09. The Astronomical Observation Request (AOR) number and dates of the Spitzer observations are AOR 3655168 from 2003-12-24 and AOR 3663616 from 2003-12-29.
Our analysis is based on a catalog comprising data from 2 MASS and IRAC and MIPS photometry kindly provided by R.Gutermuth prior to publication. The IRAC and MIPS fluxes have been measured by Gutermuth et al. using the photometry tool PhotVis, which is based on DAOPHOT routines ported to IDL. The magnitudes are corrected for aperture losses and calibrated using large-aperture measurements of standard stars. The Spitzer sources were visually inspected and non-stellar contaminations rejected. To obtain near-IR counterparts to the Spitzer sources, G09 matched their positions with 2 MASS using for the cross-identification radius a maximum of in the case of IRAC and in the case of MIPS. For more details on the IR photometry, see Gutermuth et al. (2004) and G09.
The combined 2 MASS and Spitzer catalog of NGC 7129 contains objects, of which are detected in at least one Spitzer band and are detected in all four IRAC bands. The catalog includes the YSO classification discussed in detail by G09; see Sect. 5.6.
4 Optical catalog
NGC 7129 is poorly characterized in the optical. We have compiled a list of studies that have identified pre-MS stars in the cluster. This list will be used to provide optical counterparts for the sample of YSOs that we define in Sect. 5.
The bright B-type star SVS 8, the two Herbig stars SVS 7 and SVS 12, and evidence for some other emission line stars were reported by Herbig (1960). Several far-IR sources lack optical counterparts indicating that they are deeply embedded in the reflection nebula. Most optial imaging surveys carried out in NGC 7129 used narrow band filters to search for Herbig-Haro objects (e.g. Strom et al., 1986; Eiroa et al., 1992). Three emission line stars are reported by Miranda et al. (1993) together with four Herbig-Haro objects. Photometric measurements in the bands were presented by Magakian et al. (2004) for stars in the central region of the cluster, most of them newly discovered by means of slitless H spectroscopy.
5 YSO census in NGC 7129
Our census of the YSO population in NGC 7129 is based on new X-ray and IR data that yield complementary information. We consider as YSOs (1) those X-ray sources that have IR properties compatible with young stars (Sect. 5.2), and (2) those IR objects that show evidence for emission in excess of the photospheric value irrespective of whether they are detected in X-rays or not (Sect. 5.3). The first group comprises, in principle, all types of YSOs from Class 0/I protostars to Class III objects, while the second group is biased against the identification of the diskless Class III objects. Our criteria for the classification of the YSOs on basis of IR photometry are described in Sect. 5.1 followed by the a description of the selected sample (Sects. 5.2 and 5.3). We identify contaminating foreground and background objects in Sect. 5.4 and discuss the completeness and spatial distribution of the sample in Sect. 5.5. In Sect. 5.6 our results are compared to a more complex selection process applied by G09.
5.1 IR classification criteria for YSOs
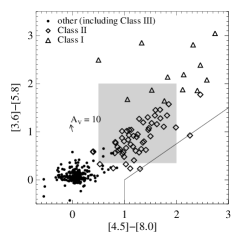
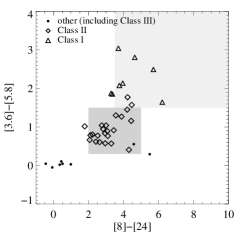
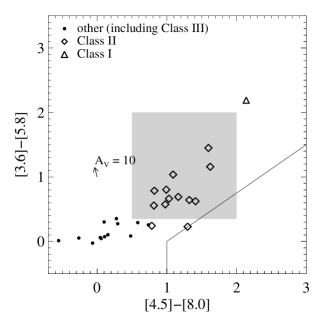
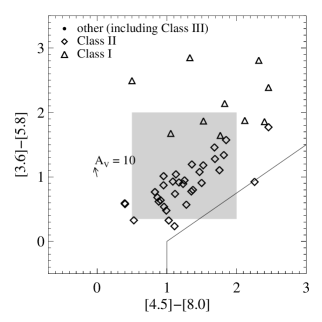
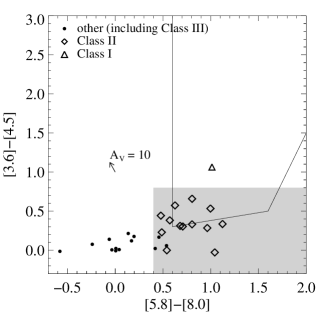
Color-color diagrams can be used to examine the evolutionary status of YSOs (e.g. Allen et al., 2004) and to discriminate contaminating background objects. Fig. 4 shows a selection of color-color diagrams based on IRAC photometry for the NGC 7129 region. We determined the reddening vector for the IRAC bands with the extinction law of Indebetouw et al. (2005). Our first criterion to identify stars with circumstellar excess emission is based on the vs. diagram. We consider Class II candidates all objects with error bars contained in the region defined by Caramazza et al. (2008) and shaded in Fig. 4 (see e.g. Megeath et al., 2004; Hartmann et al., 2005, for previous similar definitions for Class II mid-IR colors given in the literature). We consider candidate Class 0/I protostars all objects with . As outlined by White et al. (2007), the unambiguous distinction between Class II and Class 0/I is not trivial and requires good SED coverage and information from spectroscopy. Detailed analyses of SEDs for young stars show that there is some overlap of the Class 0/I and Class II populations as far as their IRAC colors are concerned (Caramazza et al., 2008). In fact, it is evident from Fig. 4 that the Class 0/I group may also contain reddened Class II stars. Similarly, some protostars may be located below the chosen cutoff line. The unambiguous distinction of Class 0/I and Class II for NGC 7129 has to be postponed until spectroscopy is available.
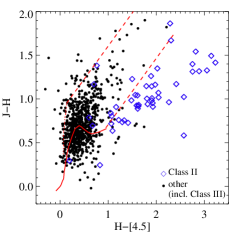
In a second step we examine the near-IR photometry. Generally, in near-IR color-color diagrams objects to the lower right of the reddening band are considered to have circumstellar disks responsible for the red excess emission. For the vs. diagram we interpolated the reddening law of Rieke & Lebofsky (1985) to the m filter of IRAC. To exclude objects below the dwarf locus and likely from the background we impose as constraint . We then added all objects above that line but below the reddening band in the vs. diagram to the list of Class II candidates. In principle, this diagram does not allow to distinguish Class II from protostars. However, the fact that none of the IRAC selected Class 0/I candidates is in the vs. area shown in Fig. 4 makes us confident that Class 0/I make a very small contribution to the near-IR selected YSO sample. In fact, only one of the Class 0/I candidates selected from the IR catalog on basis of IRAC colors has photometry, and it has , thus lying outside the region plotted in the third panel of Fig. 4. (This object is outside the Chandra FOV and, therefore, not listed in our data tables.) We conclude that most protostars are too faint for 2 MASS. In fact, in the sample that we use for scientific analysis (see Sect. 5.5) there is none of the Class 0/I sources because we could not determine their mass.
The sample from which our IR selected YSO candidates are drawn consists of the objects with photometry in all four IRAC bands and the objects with photometry at , , and . Our YSO classification results in Class II candidates and Class 0/I candidates across the field covered by IRAC. The remaining IR sources are mostly not related to NGC 7129 but they include also the Class III cluster members. In Sect. 5.2 we make use of the X-ray data to identify those latter ones.
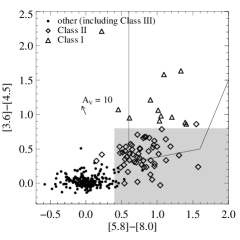
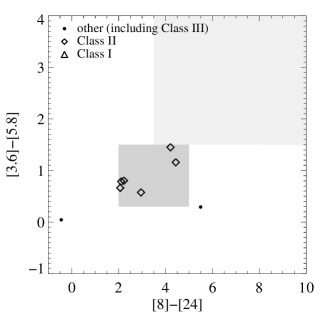
We have not used MIPS data in our classification scheme because the majority of the objects have no m detection. However, as a cross-check we show in the rightmost diagram of Fig. 4 a color-color diagram with the reddest color available in the IR catalog, . The Class II and the Class 0/I regions defined by Muzerolle et al. (2004) are highlighted with different grey-shades. The agreement between our individual classifications and the highlighted areas is very good. There are only two Class III (or foreground) objects with very red color such that the MIPS data is inconsistent with our classification from shorter wavelengths. These objects may have transition disks (Class II/III).
5.2 YSO candidates among detected X-ray sources
The X-ray source list (Table 2) was cross-correlated with the 2 MASS point source catalog (Cutri et al., 2003). We computed the median position offset between the X-ray sources and their 2 MASS counterparts, and shifted the X-ray positions by this boresight value (; ). For our search radius of the majority of the X-ray emitters () have 2 MASS counterparts. Most () of these counterparts are found within of the X-ray position, and only one counterpart is at from the X-ray position. Then we searched for matches between the X-ray sources and the 2 MASS positions given in the combined 2 MASS/Spitzer catalog introduced in Sect. 3. All but X-ray sources have a mid-IR counterpart in at least one Spitzer filter. For the cross-correlation of the X-ray sources with the optical positions from the catalogs described in Sect. 4 we allowed for a maximum matching radius of . This yielded photometry for nine X-ray sources. To this we add the optical photometry for the Herbig star SVS 7 from Hillenbrand et al. (1992) and that for the B-type star SVS 8 from Racine (1968).
Identifiers from published catalogs and the offset between X-ray and optical/IR sources are listed in Table 3. A compilation of the optical and IR photometry for all X-ray sources in NGC 7129 is given in Table 4. We count Class II and Class 0/I candidates among the X-ray detections. The X-ray sources for which either 2 MASS or IRAC photometry is complete and that are not classified Class 0/I or II are considered Class III candidates. Another X-ray sources remain unclassified. In col. 13 of Table 4 we report the YSO classification for each individual object. Class II sources with incomplete IRAC photometry and selected only on basis of near-IR data are labeled with an asterisk. The names of the stars reported in this table go back to various literature sources. Some stars had been identified already in the near-IR survey by Strom et al. (1976). These stars carry ‘SVS’ numbers in col. 2 of Table 3. Labels ‘HL85-N’ and ‘HL85-S’ refer to the northern and southern fields observed by Hartigan & Lada (1985). ‘MEG93’ stands for Miranda et al. (1993), and ‘MMN’ numbers are stars from Magakian et al. (2004).
Color-color diagrams of the X-ray sources are shown in the left column of Figs. 5 and 6. While Fig. 5 show the diagrams used for the YSO classification, Fig. 6 provides a cross-check of the resulting YSO status in colors not used for the selection process. It demonstrates that our classification is consistent with the expectation from photometry (no Class III candidate is in the area for T Tauri stars) and the expectation from MIPS photometry (only one Class III candidate is red at ).


5.3 X-ray undetected YSO candidates
As described in Sect. 5.1 we have used the IR photometry to identify YSOs with excess emission from circumstellar disks or envelopes in the Spitzer sample. There are Class 0/I and Class II candidates within the Chandra FOV but not detected in X-rays. Their optical and IR photometry is summarized in Table 6, where objects are labeled by their running number in the catalog of R.Gutermuth. Similar to the case of the X-ray detected ones, the majority of Class II is selected by their IRAC colors and only of them (labeled with an asterisk in col. 14 of Table 6) are classified solely on basis of near-IR photometry. Five stars have optical photometry in the catalogs described in Sect. 4, and magnitudes for SVS 12 are extracted from Hillenbrand et al. (1992). The position of the X-ray undetected YSO candidates in the IR color-color diagrams are shown in the right column of Figs. 5 and 6. By definition this sample does not contain Class III stars. Again, our classification scheme is supported by the MIPS data, as the Class 0/I and Class II objects separate according to the empirical locations determined by Muzerolle et al. (2004).
We computed upper limits for the X-ray count rate of the undetected YSO candidates using the algorithm of Kraft et al. (1991). For the conversion into X-ray flux we followed the procedure described in Sect. 2 for the detected sources, i.e. we estimate in two ways: (A) We assumed a -T RS-model with and corresponding to the median of the values measured in the sample of X-ray detected Class II sources given in Sect. 2, and (B) we adopted for the -T model the median but individual values for each star obtained from its . Then, for both approaches we computed a count-to-flux conversion factor with PIMMS. The X-ray parameters for the undetected YSO candidates are summarized in Table 5. We discuss possible effects on the X-ray luminosity upper limits resulting from the assumed column density in Sects. 6.3 and 6.4.
5.4 Contamination of the YSO sample
The IR emitters comprise also extragalactic background objects, galactic background stars and foreground dwarf stars. Various authors have investigated the position of contaminating background AGN and galaxies in the IRAC color-color diagrams, and we use their results. Stern et al. (2005) have identified an area populated by broad-line AGNs enclosed in the solid line in the vs. diagram. A brightness cutoff can be used to discriminate AGN from YSO candidates on a statistical basis. Star forming galaxies appear very red at mid-IR wavelengths and are usually found in the lower right area delineated by the solid lines in the vs. diagram (Gutermuth et al., 2008). We elaborate on the problem of the sample contamination in Sect. 5.4 after the YSO candidate sample of NGC 7129 has been defined.
In addition to the region marked by the solid line in the vs. diagram a brightness limit of mag and mag (Jørgensen et al., 2006; Hernández et al., 2007) has been used to identify contaminating background AGN. Only two X-ray detected YSO candidates in the highlighted region and undetected YSO candidates are fainter than these magnitudes. They are flagged in Tables 4 and 6. None of these objects has a 2 MASS counterpart, and we consider them likely AGNs. The vs. diagram demonstrates that none of our YSO candidates is in the area of the extragalactic PAH sources to the right and below the solid line defined by Gutermuth et al. (2008).
The contribution of extragalactic objects to the X-ray emitters can also be estimated from distributions taking into account the limiting flux of the observation. We use the expression given by Feigelson et al. (2005) to make a rough estimate of the sensitivity limit in the Chandra observation. Using the median absorption, , derived from the hardness ratios of the X-ray sources, we find . From the source counts in the Chandra Deep Field North (Brandt et al., 2001) we expect extragalactic objects in the combined ACIS-S2 and ACIS-S3 fields. However, at large off-axis angles the sensitivity is significantly lower than the number given above, and in practice, most of the detected X-ray sources are found within or near the cluster core. Thus, the true contamination is likely smaller. Indeed, most X-ray sources with large distance from the cluster center are not part of the mass limited sample that we define in Sect. 5.5. They have no near-IR photometry from which we could estimate the mass, i.e. they are faint, just as expected for extragalactic objects. For an area the size of the NGC 7129 cluster core only extragalactic contaminant is predicted. To summarize, both the considerations of the IR colors and magnitudes and the X-ray sensitivity limit indicate that the fraction of AGN and background galaxies among our candidate NGC 7129 members is probably small.
The sample of X-ray selected Class III objects may also contain contaminating objects in the foreground of the cluster. The contribution of foreground field stars can be judged using the results from the ROSAT/NEXXUS survey: The typical X-ray luminosity for field stars is for F/G dwarfs, for K dwarfs, and for M dwarfs (Schmitt & Liefke, 2004, their Fig.6). Comparing with the average X-ray luminosity in our sample (), we would thus be able to detect field F/G dwarfs for distances pc, K dwarfs for pc, and M dwarfs for pc. Based on the luminosity function in the solar neighbourhood, the space density of dwarf stars peaks in the M dwarf regime at pc-3 (Reid & Gizis, 1997), and is significantly lower for F/G/K stars (Reid et al., 2002). In the core radius of for NGC 7129, we therefore expect field stars with detectable X-ray emission. Although this estimate has been derived based on typical numbers, not taking into account the significant spread in X-ray luminosities at a given spectral type, the result is safely below 1 and thus negligible.
5.5 Completeness and spatial distribution
For a meaningful comparison of the YSO populations the possible differences in the completeness of X-ray and IR selected samples must be taken into account. In this section we define several sub-samples for NGC 7129 on basis of the stars identified as NGC 7129 candidate members in Sects. 5.1 to 5.4. The selection criteria and the composition of these samples are summarized in Table 1 and the individual stars of each sample are listed in Table 7.
| ——- Sample characteristics ——- | Class II | Class III | Total | |||||
| mag | core | () | () | () | ||||
| 26 | (13/13) | 25 | (25/0) | 51 | (38/13) | |||
| 13 | (9/4) | 21 | (21/0) | 34 | (30/4) | |||
| 16 | (7/9) | 16 | (16/0) | 32 | (23/9) | |||
| 7 | (5/2) | 14 | (14/0) | 21 | (19/2) | |||
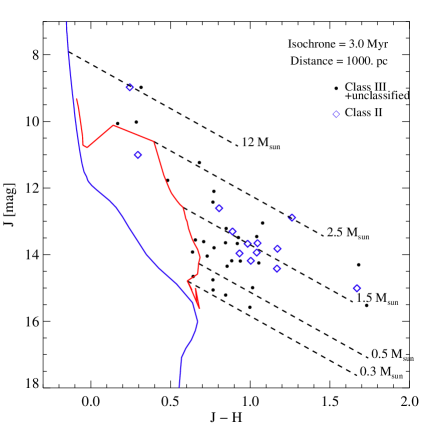
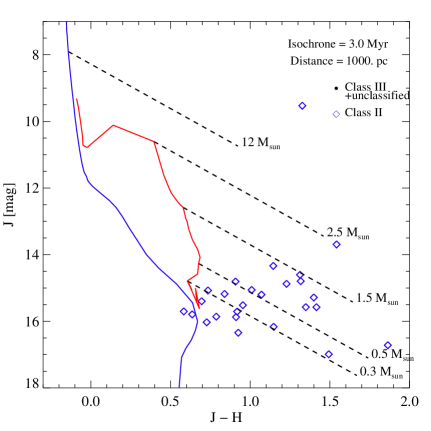
First, we estimate the mass distribution of the YSO candidates from a comparison of their IR photometry with the predictions from evolutionary calculations. We assume a cluster age of Myr and an adequate combination of evolutionary models: Low-mass stars at an age of few Myrs are still in their pre-MS phase, and we use the model from Siess et al. (2000) converted to the observational plane using the calibration given by Kenyon & Hartmann (1995). The Siess et al. calculations extend up to , i.e. they do not cover the full mass range of our sample. For the high-mass stars we use the calculations from Marigo et al. (2008). At the high-mass end of the Myr isochrones the Siess calculations are in good agreement with the Marigo model. Therefore, we use the Siess isochrone for and the Marigo isochrone for higher masses.
From the vs. diagram (Fig. 7) it emerges that all X-ray detected stars in NGC 7129 with known and magnitudes have according to the evolutionary calculations. In the Orion Nebula Cluster (ONC), at Myr just slightly younger than NGC 7129, stars with corresponding to the sensitivity limit derived in Sect. 5.4, have a mass of (Preibisch et al., 2005). Therefore, we take the X-ray sample to be complete down to this mass. About half of the YSOs that are not detected with Chandra are fainter in than predicted for a cluster member of . X-ray non-detected YSOs below the reddening track of an star according to the Siess et al. (2000) model are dropped from the sample for further analysis.
Obviously, the sample defined this way comprises only stars with available photometry in the and bands. This is not a serious limitation because Spitzer sources without known magnitude are likely fainter than our mass cutoff. The resulting sample consists of X-ray sources ( Class II and Class III) and X-ray undetected Class II YSOs selected from their Spitzer colors; see first row in Table 1. By introducing this sensitivity cutoff the four AGN candidates discussed in Sect. 5.4 are also dropped. No Class 0/I sources are in the mass-limited sample because none of them have photometry.
There is evidence for higher average extinction in the YSO sample that have X-ray upper limits with respect to the sample of X-ray sources (see Fig. 7 and Fig. 6 top panel). About half of the Class II stars are in the upper limit sample, while Class III stars are by definition present only in the X-ray detected sample. This might imply that the sensitivity limit is different for the two object groups. Class III sources with large extinction may, indeed, be absent from the sample because high column density impedes the X-ray photons from being observed. To eliminate a possible bias we define a ‘lightly absorbed’ sample limited by mag. There are very few X-ray undetected YSOs with low extinction above our mass cutoff (Fig. 7 bottom), supporting our estimate that the X-ray observation is (nearly) complete down to . The mass-limited, lightly absorbed sample consists of Class II sources ( of which not detected in X-rays) and Class III sources; second row in Table 1.
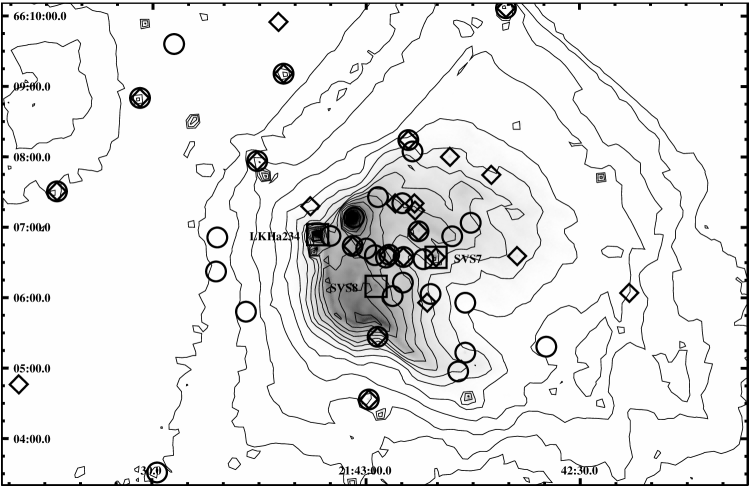
We move now on to consider the spatial distribution of the YSO population in NGC 7129. Gutermuth et al. (2004) noticed that there is an accumulation of Class II YSOs around SVS 12, at the outskirts of and pointing away from the molecular cloud. This is also the direction where most X-ray sources, apart from those in the cluster core, are found. A map with the cloud contours and our mass-limited sample is shown in Fig. 8. To eliminate effects related to a possible difference in the spatial distribution of YSOs in different evolutionary stages we define a sample limited by the cluster core radius as described by Gutermuth et al. (2004), henceforth called the ‘core sample’. The mass limited core sample is composed of X-ray emitters, of which are Class II objects and are Class III. These numbers represent a fraction of % and % of the total sample of X-ray detections for Class II and Class III, respectively (cf. Table 4). The mass-limited core sample, therefore, seems to reflect roughly the spatial distribution of X-ray bright Class II and Class III in NGC 7129. In addition to those X-ray sources, the mass-limited core sample includes Class II objects not detected with Chandra (see third row in Table 1). Finally, for the reasons outlines above, we apply an extinction cutoff to this sample. This defines the most restricted sample used in this work, the mass-limited, lightly absorbed core sample. It comprises Class II (of which undetected in X-rays) and Class III, and is summarized in the last row of Table 1.
5.6 Comparison to the classification scheme of Gutermuth et al.
Gutermuth et al. (2008) have devised a complex scheme for the classification of YSOs that was subsequently revised and applied to a wide range of nebulous star forming environments (G09). In this scheme the distinction between Class 0/I and Class II sources is based on the color rather than on the color, thus reducing effects of the reddening that are more severe at shorter wavelengths (Flaherty et al., 2007). In a second step, the near-IR photometry is used to deredden the stars and to identify excess emission at wavelengths shorter than . Finally, G09 use MIPS photometry to identify deeply embedded protostars without detectable emission in the IRAC bands. We refer to G09 for details of the procedure. Here, we present a brief comparison of the results for the case of NGC 7129.
Overall, we found our classification scheme to be consistent with the more exhaustive approach used by G09. Specifically, most of the objects classified as likely extragalactic are common to both studies. Among the Class 0/I candidates of our list, are classified Class I by G09, one is Class 0, one is Class II and two are flagged as shock source. Better agreement is found for the Class II and Class III samples that are more relevant to our study than the protostars. In particular, the mass-limited and the core sample defined in Sect. 5.5 are very clean. Our Class II core sample comprises only two objects that carry different flags in the scheme of G09 (one detected in X-rays and one not detected). Conversely, G09 assign Class II status to three X-ray undetected objects in the cluster core that are not identified as YSOs by our procedure. One of them has no 2 MASS photometry, and would not have been selected into our mass-limited sample. Therefore, the Class II sample size is almost identical for the two selection approaches. In the framework of this paper an accurate YSO classification is relevant only for the evaluation of the disk fraction, and in practice, the differences are not significant (see Sect. 6.2).
6 Results
6.1 SEDs
We examined the SEDs of all sources from Tables 4 and 6. Due to the limited spectral range covered by the available photometry of most sources we abstain from a systematic analysis and search only for outstanding objects. In particular, we are interested to identify objects with ‘holes’ in the SED (i.e. excess emission is only visible at the longest wavelengths) and embedded objects or objects with edge-on disks (i.e. with strongly increasing flux levels towards longer wavelengths). This exercise was limited to sources for which the data cover at least the wavelength range from to m with a minimum of datapoints. These limits were imposed to guarantee a minimum amount of information about both the stellar photosphere and the circumstellar environment.
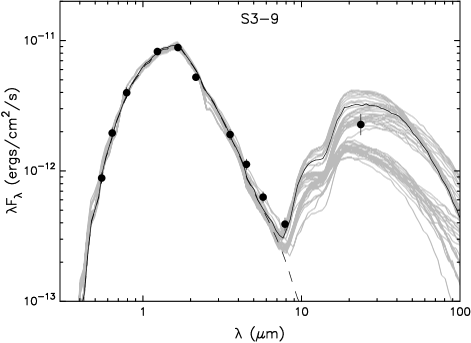
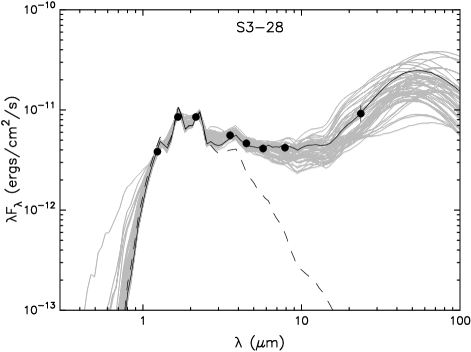
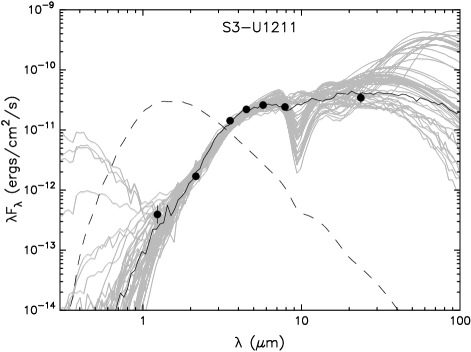
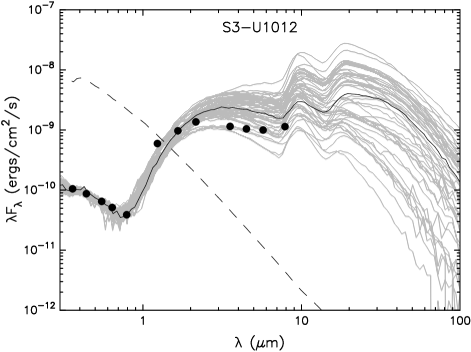
Three objects clearly stand out based on their SED characteristics: NGC 7129-S3-X28 and NGC 7129-S3-X9 from the X-ray detected sample, and NGC 7129-S3-U1211 from the non-detections in X-rays. These objects were selected for further analysis. We added object NGC 7129-S3-U1012 (identified with the Herbig star LkH 234), which is the brightest source in our sample at all IRAC wavelengths.
For these four objects we compare the observed SED with the grid of model SEDs, pre-computed using a Monte Carlo radiation transfer code, provided by Robitaille et al. (2006, 2007)333The SED fitter is available under http://caravan.astro.wisc.edu/protostars/. Interpreting SEDs using radiative transfer code is subject to degeneracies, as discussed in detail in the literature (Chiang et al., 2001). Spatially resolved multi-wavelength observations can break the degeneracies (Watson et al., 2007) but are only available for relatively few object. Therefore, we do not attempt to derive a unique model solution for the observed SED. Instead, the following analysis is based on the best-fitting models according to for each object, selected from a grid of pre-computed YSO models. For more information on the specifications and limitations of the model grid see Robitaille et al. (2006, 2007). In Fig. 9 we show the observed SEDs and the best fitting models for each of the four stars. We have applied generic errors of % for all IRAC fluxes and % for all MIPS fluxes to account for calibration uncertainties. (These errors are significantly higher than the nominal errors in all cases.) As can be seen, all four objects are adequately matched by a significant number of models.
The multi-parameter fit produces partly ambiguous results; we limit the discussion to those parameters which are well-constrained by the procedure. While the near-IR photometry mostly constrains the photospheric properties of the central objects, the fluxes at mid-IR wavelengths are strongly sensitive to the inner disk geometry, i.e. flaring, inclination, inner disk radius. In addition, the fluxes in our wavelength coverage are affected by the accretion rate. At m the envelope begins to contribute significantly, thus allowing us to constrain the evolutionary state of the object. The lack of longer wavelength data precludes putting limits on global parameters of disk and envelope (see Wood et al., 2002, for further information). In the following we briefly discuss the results for each of the four objects shown in Fig. 9. The limitations of the model fit (e.g. finite resolution and parameter coverage of the grid) sometimes do not allow a perfect fit of all datapoints. These type of models do also not take into account variability or 3D structure in the disk.
Source NGC 7129-S3-X9 is identified with an H emission line star ( Å; see Magakian et al., 2004). Optical photometry in bands is available, which has allowed us to estimate the mass of the central source, which is around 1 (). NGC 7129-S3-X9 does not show IR excess for m, but a strong excess level is seen at 24m. This is the hallmark sign of a disk with an inner opacity hole, often called ‘transition disk’ in the literature. Indeed, in its broadband shape, this SED resembles the ones measured for TW Hya (Calvet et al., 2002) and CoKu Tau/4 (D’Alessio et al., 2005). Possible explanations for opacity holes include the presence of a massive planet or a stellar companion. The best-fitting SED models give an inner disk radius of 10 AU ( AU). This is times larger than the sublimation radius that usually limits the extent of the inner dust disk.
The SED for object NGC 7129-S3-X28 is significantly increasing between and m. The datapoints are well-reproduced by models for a disk with a high degree of flaring (i.e. the scale height increases strongly with increasing distance from the star) embedded in an envelope. The best estimate for the mass of the central object is but optical photometry is required for a more reliable assessment. The high m flux indicates that this object is possibly in an early evolutionary state. Indeed, in the vs. diagram it is just at the intersection between the canonical areas for Class II and Class 0/I objects.
Object NGC 7129-S3-U1211 has been classified as Class 0/I source in Sect. 5.3. This is confirmed by the SED fit. This is one of the objects with the steepest SED slope in our sample. The flux levels increase steeply from near-IR wavelengths to m. For this object, most parameters are poorly constrained. As can be seen in the plot, the photospheric fluxes are strongly suppressed by circumstellar extinction. Optical and sub-millimeter measurements would permit to put more reliable limits on the physical properties of the source.
For NGC 7129-S3-U1012 (alias SVS 12) optical photometry was presented by Hillenbrand et al. (1992) in their study of Herbig stars. These data are combined with 2 MASS and IRAC photometry in Fig. 9. The best-matching SEDs constrain the mass of the central object to . Most of the best fitting models have a disk inclination , i.e. close to edge-on. The disk thus suppresses the observable photospheric flux responsible for the optical emission. It may even be conjectured that the non-detection of SVS 12 in X-rays results from the absorption of its coronal emission. Recall, however, that the presence of an X-ray production mechanism on Herbig stars is not obvious; we refer to Stelzer et al. (2009) for more details on this subject.
6.2 Disk fraction
In the total sample of YSOs for which a mass could be estimated from the vs. diagram, we count Class II objects and Class III objects (see first row of Table 1). This corresponds to a disk fraction of %. The uncertainty represents the % confidence limit for a binominal distribution. Considering only the mass-limited core sample there are Class II and Class III objects. Therefore, the disk fraction for the core of NGC 7129 is %. In the mass-limited lightly absorbed core sample, there are Class II and Class III sources, and we derive a disk fraction of %. We recall, that this last sample is the least biased one but, obviously, also the least complete one in terms of number of cluster members.
Gutermuth et al. (2004) have estimated the fraction of disk-bearing stars in the core of NGC 7129 using a sample selected from the vs. diagram with a brightness ( mag) and extinction ( mag) cutoff. With help of a control field they estimated that % in the sample without IR excess emission are background objects, and derive a disk fraction of %. This number is statistically similar to the value obtained for our mass-limited core sample without extinction cutoff. For the absorption limited case we obtain a smaller disk fraction than Gutermuth et al. (2004). The use of X-ray emission as a diagnostic for identifying the young diskless population allows us to reduce the uncertainties due to background contamination. Note that, there are no significant differences in the derived disk fraction between our YSO classification method and the more sophisticated approach of G09. Using their YSO status together with our sample restrictions (mass-limit, extinction limit and confinement in the core), we find a disk fraction of %.
We compare the disk fraction in NGC 7129 with literature values for other clusters and star forming regions in the same age range. Given the possibility of a mass dependence in the disk lifetimes, care has to be taken to compare similar mass regimes. The majority of the sources in NGC 7129 have masses between and (see Fig. 7). For consistency reasons, we limit ourselves to disk fractions estimated based on Spitzer/IRAC data.
In Cha I ( Myr), the disk fraction is roughly at 50% with an error bar of % from 0.1 to 3 (Damjanov et al., 2007; Luhman et al., 2008). This sample is dominated by stars with sub-solar masses; there are indications that the number is somewhat higher for . In the cluster IC 348, at Myr, the total fraction of objects harboring disks is %. Here the stars with have a significantly lower disk fraction of % (Lada et al., 2006). The cluster Ori with an estimated age of 3 Myr has been found to have a disk fraction of % for stars with , and % for (Hernández et al., 2007). Finally, the disk fraction in the 5 Myr old Upper Sco star forming region is % for , and close to zero for higher mass stars (Carpenter et al., 2006).
As seen from this list, the disk fraction declines steeply with age between 1 and 5 Myr (see also Haisch et al., 2001). The value we derive for the disk fraction of the absorption limited core sample of NGC 7129 with is clearly higher than in Upper Sco and lower than in Cha I and IC 348. Therefore, the age of NGC 7129 is probably in between that of those regions, and similar to Ori, i.e. Myr.
6.3 X-ray luminosity functions
Using the ASURV environment (Feigelson & Nelson, 1985), we have computed the XLF for the two core samples of NGC 7129, the mass-limited and the mass- and absorption-limited one. Three stars with mag are not considered in this part of the analysis as they are hot stars according to Fig. 7 and their X-ray emission may not originate in the corona but in winds. The two X-ray detected hot stars are identified with the dominating B-type stars of the reflection nebula, SVS 8 and SVS 7, and the hot star not detected with our algorithm is the Herbig star SVS 12. The X-ray emission of all three stars has been discussed in detail by Stelzer et al. (2009).
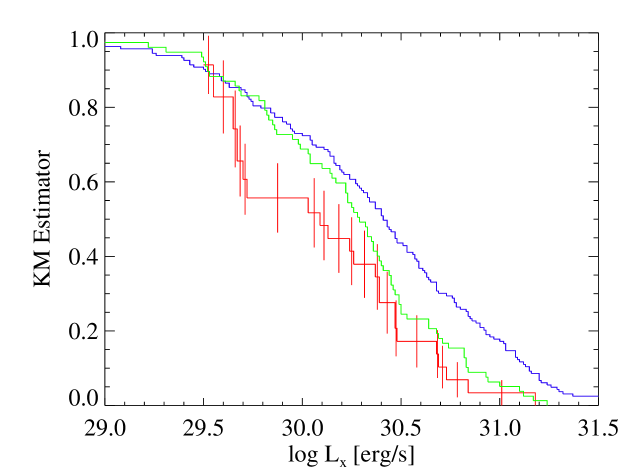
The XLF for the mass-limited core sample of NGC 7129 with X-ray luminosities using the obtained from the hardness ratios is shown in the top panel of Fig. 10. Without the three hot stars this sample consists of stars composed of Class III and Class II sources. Eight of the latter ones have X-ray upper limits. The median X-ray luminosity is . For comparison we also show the XLF for two other samples of young stars, the ONC and NGC 2264. The data for the ONC were extracted from the Chandra Orion Ultradeep Project (COUP) (see Getman et al., 2005b). After eliminating the probable non-members identified by Getman et al. (2005a) from the COUP source list, we have limited the XLF of the ONC to stars with masses in the range . As described in Sect. 5.4 this is the approximate mass range covered by the NGC 7129 sample. Similarly, the XLF of NGC 2264 shown in green in Fig. 10, obtained with data from Flaccomio et al. (2006), is restricted to stars with spectroscopically determined masses between and . In this mass range, the median X-ray luminosity for the ONC is and for NGC 2264 it is . The precise choice of the upper mass bound for the two comparison clusters is not a concern. We have lowered it to and found no dramatic change of the median X-ray luminosities.
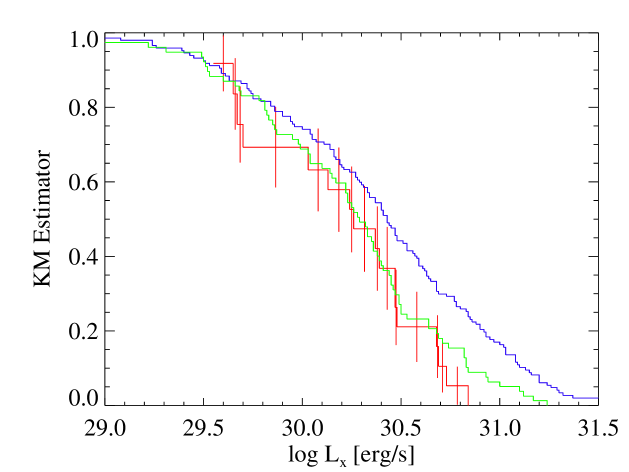
In the lower panel of Fig. 10 we show the mass-limited lightly absorbed core sample of NGC 7129 together with the ONC and NGC 2264 samples to which the same restrictions have been applied (i.e. mass range of and mag). The median X-ray luminosity for this NGC 7129 sample is higher than for the one without limitations on the absorption () because it has fewer upper limits. For the ONC less than % of the sample is removed due to the absorption cutoff and there is no change in the median . In NGC 2264 all stars have mag.
As mentioned in Sect. 2 the column densities (derived from the hardness ratios) that are used to compute the X-ray luminosities are associated with large uncertainties, and as a cross-check we have applied an independent method to derive values from the optical extinction extracted from near-IR photometry. The XLF for the mass-limited core sample and that for the mass-limited lightly absorbed core sample of NGC 7129 computed with those latter estimates both have a median of . This shows that the XLF are relatively stable despite the considerable uncertainties in the computation of the luminosities.
Various uncertainties are related to the calculation of the XLFs, such that the similarity to that of the other clusters is remarkable. We can speculate on the origin of the remaining differences. A possible contribution is from the uncertain mass estimates by means of photometric observations. In addition, the uncertain distance estimate for NGC 7129 may play a role. To bring its XLF up by a factor the distance would have to be kpc instead of the canonical value of kpc. While this does not seem impossible, an investigation of the consequences (that include a higher mass limit for our observations) is clearly unfeasible with the presently available data. Spectroscopic observations of NGC 7129 will shed light on this issue.
6.4 X-ray emission from protostars
None of the Class 0/I candidates is detected in X-rays. The only X-ray detected object classified Class 0/I according to our IR selection does not survive our contamination tests and is flagged as AGN in Table 4. We have derived upper limits on the order of for the undetected Class 0/I candidates. However, the extinction of these embedded objects is likely to be much higher than the assumed median of the X-ray detected Class II sources, and consequently the X-ray luminosities are probably higher than estimated. For mag, a moderate absorption for a protostar, the gas column density is expected to be , and the upper limits to the X-ray luminosities higher by a factor four with respect to the values given in Table 5, i.e. . This is in the middle of the range of X-ray luminosities for Class 0/I sources seen in the ONC (Prisinzano et al., 2008). Therefore, the non-detection of most Class 0/I sources in NGC 7129 is not surprising. There is also no X-ray source at the position of the Class 0 object FIRS-2.
7 Summary
We present a combined X-ray and near/mid-IR census of the young star cluster associated with the reflection nebula NGC 7129. YSOs are characterised by excess emission in the IR due to the presence of disks and elevated levels of X-ray emission due to enhanced coronal activity compared with field stars. Thus, the two wavelength regimes provide complementary information which, in principle, allow us to obtain a complete census of the cluster population.
In a ksec long Chandra observation pointed at the Herbig star SVS 12 we find in total X-ray sources, from which are matched with 2 MASS photometry. X-ray sources have a counterpart seen in at least one IRAC or MIPS band in the Spitzer catalog kindly provided to us by R.Gutermuth (see also G09).
Based on literature recommendations, we define a set of criteria to distinguish between Class I/II objects (with disks and/or envelope) and diskless Class III objects from their color in IRAC and 2 MASS photometry. For Class III candidates we require, besides their detection in X-rays, that either 2 MASS or IRAC photometry is complete. After likely extragalactic sources have been removed, there are Class 0/I, Class II and Class III candidates among the X-ray detections. In addition, we have identified Class 0/I candidates and Class II candidates without X-ray detection in the Spitzer/2 MASS catalog.
Based on a comparison with evolutionary tracks, we estimate that this sample is complete down to . The mass-limited census () is composed of 26 Class II and 25 Class III objects, from which 16 Class II and 16 Class III are densely clustered within around the center of the cloud. The sample may not be complete for strongly absorbed cluster stars. Therefore, we defined an absorption limited subsample, that comprises Class II and Class III sources. Spectroscopy is required to further assess the completeness and properties of this sample.
From our census, we estimate the disk fraction in NGC 7129 to be %. This is lower than the disk fraction of Cha I and IC 348 ( Myr), higher than the disk fraction of Upper Sco ( Myr), and comparable with the disk fraction of Ori ( Myr). Therefore, the age of NGC 7129 is likely to be Myr. The same age is suggested by the XLF that we find to be similar to that of the Myr old NGC 2264 cluster but fainter than that of the ONC ( Myr).
For both methods used to derive the luminosities, the XLF of the mass-limited core sample in NGC 7129 are somewhat lower than those of NGC 2264 and the ONC. Better agreement with NGC 2264 is obtained for the lightly absorbed mass-limited core sample, indicating that this sample is likely representative for the cluster.
Based on the broadband shape of their SED, we identify four peculiar sources. Further analysis using the grid of model SEDs by Robitaille et al. (2006) reveals that one object is a clear candidate for a ‘transition’ disk with an inner opacity hole (radius AU). For the well-known HAeBe star LkH 234 we find evidence for an edge-on disk which blocks the optical light from the central object.
The presently available data set is subject to various uncertainties related with the cluster properties (such as mass distribution or distance) and with the X-ray data itself (such as the spectral shape of the sources). This underlines the need to characterize the cluster members with optical photometric and spectroscopic observations.
| ID | X-ray position | Offax | Expo | Rate | signif | S/N | ||
| [] | [s] | [ cts/s] | [erg/s] | |||||
| NGC7129-S3-X1 | 21 42 59.62 | +66 04 33.9 | ||||||
| NGC7129-S3-X2 | 21 42 47.09 | +66 04 57.8 | ||||||
| NGC7129-S3-X3 | 21 42 46.09 | +66 05 13.8 | ||||||
| NGC7129-S3-X4 | 21 42 34.73 | +66 05 18.8 | ||||||
| NGC7129-S3-X6 | 21 42 58.39 | +66 05 27.3 | ||||||
| NGC7129-S3-X7 | 21 43 18.10 | +66 05 35.1 | ||||||
| NGC7129-S3-X8 | 21 42 49.89 | +66 05 42.7 | ||||||
| NGC7129-S3-X9 | 21 43 16.86 | +66 05 48.6 | ||||||
| NGC7129-S3-X10 | 21 42 56.28 | +66 06 02.0 | ||||||
| NGC7129-S3-X11 | 21 42 50.96 | +66 06 03.8 | ||||||
| NGC7129-S3-X12 | 21 42 58.82 | +66 06 10.2 | ||||||
| NGC7129-S3-X13 | 21 42 58.60 | +66 06 10.3 | ||||||
| NGC7129-S3-X14 | 21 43 21.07 | +66 06 22.8 | ||||||
| NGC7129-S3-X15 | 21 42 57.22 | +66 06 34.8 | ||||||
| NGC7129-S3-X16 | 21 42 50.19 | +66 06 35.0 | ||||||
| NGC7129-S3-X17 | 21 42 58.77 | +66 06 36.8 | ||||||
| NGC7129-S3-X18 | 21 42 56.77 | +66 06 37.2 | ||||||
| NGC7129-S3-X19 | 21 42 59.99 | +66 06 42.5 | ||||||
| NGC7129-S3-X20 | 21 43 01.89 | +66 06 44.7 | ||||||
| NGC7129-S3-X21 | 21 43 20.90 | +66 06 51.8 | ||||||
| NGC7129-S3-X22 | 21 43 05.01 | +66 06 53.2 | ||||||
| NGC7129-S3-X23 | 21 42 47.92 | +66 06 52.9 | ||||||
| NGC7129-S3-X24 | 21 42 59.78 | +66 06 55.7 | ||||||
| NGC7129-S3-X25 | 21 42 52.65 | +66 06 57.2 | ||||||
| NGC7129-S3-X26 | 21 42 54.92 | +66 07 21.1 | ||||||
| NGC7129-S3-X27 | 21 43 05.18 | +66 07 33.9 | ||||||
| NGC7129-S3-X28 | 21 43 15.31 | +66 07 56.9 | ||||||
| NGC7129-S3-X29 | 21 42 53.49 | +66 08 05.2 | ||||||
| NGC7129-S3-X30 | 21 43 11.62 | +66 09 11.4 | ||||||
| NGC7129-S3-X31 | 21 42 46.09 | +66 05 56.3 | ||||||
| NGC7129-S3-X32 | 21 42 54.84 | +66 06 13.5 | ||||||
| NGC7129-S3-X35 | 21 42 51.96 | +66 06 33.4 | ||||||
| NGC7129-S3-X36 | 21 42 54.75 | +66 06 35.3 | ||||||
| NGC7129-S3-X37 | 21 42 55.72 | +66 06 45.0 | ||||||
| NGC7129-S3-X38 | 21 43 07.15 | +66 06 54.0 | ||||||
| NGC7129-S3-X39 | 21 42 46.91 | +66 06 57.4 | ||||||
| NGC7129-S3-X40 | 21 42 45.32 | +66 07 04.4 | ||||||
| NGC7129-S3-X41 | 21 42 38.91 | +66 07 08.7 | ||||||
| NGC7129-S3-X42 | 21 43 19.39 | +66 07 21.4 | ||||||
| NGC7129-S3-X43 | 21 42 58.34 | +66 07 26.3 | ||||||
| NGC7129-S3-X45 | 21 42 54.08 | +66 08 14.9 | ||||||
| NGC7129-S3-X47 | 21 42 58.26 | +66 05 40.0 | ||||||
| NGC7129-S3-X48 | 21 42 55.87 | +66 05 42.8 | ||||||
| NGC7129-S3-X50 | 21 43 03.01 | +66 06 55.9 | ||||||
| NGC7129-S3-X51 | 21 43 01.71 | +66 07 08.9 | ||||||
| NGC7129-S3-X52 | 21 42 40.34 | +66 10 07.2 | ||||||
| NGC7129-S3-X53 | 21 42 24.73 | +66 01 41.0 | ||||||
| NGC7129-S3-X56 | 21 43 29.28 | +66 03 31.5 | ||||||
| NGC7129-S3-X58 | 21 42 19.32 | +66 07 26.6 | ||||||
| NGC7129-S2-X1 | 21 43 31.80 | +66 08 50.5 | ||||||
| NGC7129-S2-X2 | 21 43 24.89 | +66 07 34.1 | ||||||
| NGC7129-S2-X3 | 21 43 20.37 | +66 08 20.2 | ||||||
| NGC7129-S2-X4 | 21 43 27.02 | +66 09 36.5 | ||||||
| NGC7129-S2-X5 | 21 43 43.43 | +66 07 30.7 | ||||||
| NGC7129-S2-X7 | 21 43 53.11 | +66 08 09.8 | ||||||
| NGC7129-S2-X8 | 21 43 33.96 | +66 10 43.4 | ||||||
| NGC7129-S2-X9 | 21 43 36.29 | +66 11 32.9 | ||||||
| NGC7129-S2-X10 | 21 44 29.55 | +66 07 06.8 | ||||||
| NGC7129-S2-X14 | 21 44 26.43 | +66 10 29.1 | ||||||
| (a) - The X-ray luminosities were computed using the and obtained from the hardness ratios as described in | ||||||||
| Sect. 2. is given only for objects selected as pre-MS candidates with the criteria described in Sect. 5. | ||||||||
| NGC7129-… | Name | ||
|---|---|---|---|
| [] | [] | ||
| …-S3-X1 | HL85-S 25 | ||
| …-S3-X2 | |||
| …-S3-X3 | HL85-S II | ||
| …-S3-X4 | |||
| …-S3-X6 | |||
| …-S3-X7 | |||
| …-S3-X8 | |||
| …-S3-X9 | MMN-19 | ||
| …-S3-X10 | |||
| …-S3-X11 | |||
| …-S3-X12 | |||
| …-S3-X13 | SVS 8 | ||
| …-S3-X14 | |||
| …-S3-X15 | |||
| …-S3-X16 | SVS 7 | ||
| …-S3-X17 | |||
| …-S3-X18 | |||
| …-S3-X19 | |||
| …-S3-X20 | |||
| …-S3-X21 | |||
| …-S3-X22 | |||
| …-S3-X23 | |||
| …-S3-X24 | |||
| …-S3-X25 | MMN-6 | ||
| …-S3-X26 | |||
| …-S3-X27 | |||
| …-S3-X28 | |||
| …-S3-X29 | MMN-9 | ||
| …-S3-X30 | MMN-17 | ||
| …-S3-X31 | |||
| …-S3-X32 | MMN-10 | ||
| …-S3-X35 | |||
| …-S3-X36 | MEG93 Star 2 | ||
| …-S3-X37 | |||
| …-S3-X38 | |||
| …-S3-X39 | |||
| …-S3-X40 | |||
| …-S3-X41 | |||
| …-S3-X42 | |||
| …-S3-X43 | |||
| …-S3-X45 | |||
| …-S3-X47 | |||
| …-S3-X48 | |||
| …-S3-X50 | |||
| …-S3-X51 | SVS 13 | ||
| …-S3-X52 | SVS 2 | ||
| …-S3-X53 | |||
| …-S3-X56 | |||
| …-S3-X58 | |||
| …-S2-X1 | HL85-N 27 | ||
| …-S2-X2 | |||
| …-S2-X3 | |||
| …-S2-X4 | |||
| …-S2-X5 | MMN-22 | ||
| …-S2-X7 | |||
| …-S2-X8 | |||
| …-S2-X9 | SVS 15 | ||
| …-S2-X10 | |||
| …-S2-X14 |
| NGC7129-… | YSO | AGN? | |||||||||||
|---|---|---|---|---|---|---|---|---|---|---|---|---|---|
| [mag] | [mag] | [mag] | [mag] | [mag] | [mag] | [mag] | [mag] | [mag] | [mag] | [mag] | Class | ||
| …-S3-X1 | II | ||||||||||||
| …-S3-X2 | III | ||||||||||||
| …-S3-X3 | III | ||||||||||||
| …-S3-X4 | III | ||||||||||||
| …-S3-X6 | II∗ | ||||||||||||
| …-S3-X7 | III | ||||||||||||
| …-S3-X8 | III | ||||||||||||
| …-S3-X9 | III | ||||||||||||
| …-S3-X10 | III | ||||||||||||
| …-S3-X11 | III | ||||||||||||
| …-S3-X12 | … | ||||||||||||
| …-S3-X13 | III | ||||||||||||
| …-S3-X14 | III | ||||||||||||
| …-S3-X15 | III | ||||||||||||
| …-S3-X16 | II | ||||||||||||
| …-S3-X17 | III | ||||||||||||
| …-S3-X18 | II∗ | ||||||||||||
| …-S3-X19 | III | ||||||||||||
| …-S3-X20 | II∗ | ||||||||||||
| …-S3-X21 | III | ||||||||||||
| …-S3-X22 | III | ||||||||||||
| …-S3-X23 | III | ||||||||||||
| …-S3-X24 | … | ||||||||||||
| …-S3-X25 | II | ||||||||||||
| …-S3-X26 | III | ||||||||||||
| …-S3-X27 | II | ||||||||||||
| …-S3-X28 | II | ||||||||||||
| …-S3-X29 | III | ||||||||||||
| …-S3-X30 | II | ||||||||||||
| …-S3-X31 | III | ||||||||||||
| …-S3-X32 | III | ||||||||||||
| …-S3-X35 | III | ||||||||||||
| …-S3-X36 | II | ||||||||||||
| …-S3-X37 | III | ||||||||||||
| …-S3-X38 | … | ||||||||||||
| …-S3-X39 | II | ||||||||||||
| …-S3-X40 | III | ||||||||||||
| …-S3-X41 | … | ||||||||||||
| …-S3-X42 | III | ||||||||||||
| …-S3-X43 | III | ||||||||||||
| …-S3-X45 | II | ||||||||||||
| …-S3-X47 | … | ||||||||||||
| …-S3-X48 | III | ||||||||||||
| …-S3-X50 | … | ||||||||||||
| …-S3-X51 | III | ||||||||||||
| …-S3-X52 | II | ||||||||||||
| …-S3-X53 | II | ||||||||||||
| …-S3-X56 | III | ||||||||||||
| …-S3-X58 | … | ||||||||||||
| …-S2-X1 | II | ||||||||||||
| …-S2-X2 | … | ||||||||||||
| …-S2-X3 | … | ||||||||||||
| …-S2-X4 | III | ||||||||||||
| …-S2-X5 | II | ||||||||||||
| …-S2-X7 | … | ||||||||||||
| …-S2-X8 | 0/I | ||||||||||||
| …-S2-X9 | III | ||||||||||||
| …-S2-X10 | … | ||||||||||||
| …-S2-X14 | … |
| ID | 2 MASS position | Offax | Expo | Rate | ||
| [] | [s] | [ cts/s] | [erg/s] | |||
| NGC7129-S3-U419 | 21 43 01.78 | +66 03 24.4 | ||||
| NGC7129-S3-U546 | 21 42 57.75 | +66 04 23.5 | ||||
| NGC7129-S3-U968 | 21 43 06.96 | +66 06 41.7 | ||||
| NGC7129-S3-U1059 | 21 43 24.90 | +66 07 04.7 | ||||
| NGC7129-S3-U1169 | 21 43 14.83 | +66 07 37.5 | ||||
| NGC7129-S3-U1178 | 21 41 55.30 | +66 07 41.5 | ||||
| NGC7129-S3-U1211 | 21 43 14.17 | +66 07 46.5 | ||||
| NGC7129-S3-U1242 | 21 43 05.92 | +66 07 58.5 | ||||
| NGC7129-S3-U1521 | 21 42 42.86 | +66 09 24.0 | ||||
| NGC7129-S2-U1350 | 21 43 24.13 | +66 08 31.5 | ||||
| NGC7129-S3-U270 | 21 42 59.82 | +66 01 54.9 | ||||
| NGC7129-S3-U500 | 21 43 02.01 | +66 04 02.7 | ||||
| NGC7129-S3-U550 | 21 43 11.17 | +66 04 25.6 | ||||
| NGC7129-S3-U722 | 21 42 54.63 | +66 05 20.3 | ||||
| NGC7129-S3-U815 | 21 42 51.43 | +66 05 56.4 | ||||
| NGC7129-S3-U821 | 21 43 29.32 | +66 05 55.7 | ||||
| NGC7129-S3-U822 | 21 43 04.38 | +66 05 56.4 | ||||
| NGC7129-S3-U840 | 21 42 23.08 | +66 06 04.5 | ||||
| NGC7129-S3-U849 | 21 43 12.30 | +66 06 05.6 | ||||
| NGC7129-S3-U939 | 21 42 38.81 | +66 06 36.0 | ||||
| NGC7129-S3-U1012 | 21 43 06.81 | +66 06 54.3 | ||||
| NGC7129-S3-U1026 | 21 43 12.42 | +66 06 55.9 | ||||
| NGC7129-S3-U1085 | 21 42 53.13 | +66 07 14.8 | ||||
| NGC7129-S3-U1103 | 21 43 07.84 | +66 07 18.5 | ||||
| NGC7129-S3-U1107 | 21 42 55.92 | +66 07 20.9 | ||||
| NGC7129-S3-U1109 | 21 42 53.21 | +66 07 20.9 | ||||
| NGC7129-S3-U1194 | 21 42 42.42 | +66 07 45.2 | ||||
| NGC7129-S3-U1246 | 21 42 48.23 | +66 08 00.6 | ||||
| NGC7129-S3-U1294 | 21 43 02.89 | +66 08 14.2 | ||||
| NGC7129-S3-U1367 | 21 42 17.67 | +66 08 40.3 | ||||
| NGC7129-S3-U1433 | 21 43 14.40 | +66 08 58.7 | ||||
| NGC7129-S3-U1504 | 21 42 53.47 | +66 09 19.7 | ||||
| NGC7129-S3-U1522 | 21 42 41.92 | +66 09 24.5 | ||||
| NGC7129-S3-U1542 | 21 43 05.17 | +66 09 29.4 | ||||
| NGC7129-S3-U1611 | 21 43 02.62 | +66 09 50.7 | ||||
| NGC7129-S3-U1612 | 21 42 40.55 | +66 09 51.8 | ||||
| NGC7129-S3-U1780 | 21 42 59.47 | +66 10 35.8 | ||||
| NGC7129-S2-U613 | 21 43 48.70 | +66 04 46.2 | ||||
| NGC7129-S2-U804 | 21 43 33.12 | +66 05 49.0 | ||||
| NGC7129-S2-U820 | 21 44 05.38 | +66 05 53.3 | ||||
| NGC7129-S2-U1083 | 21 43 29.92 | +66 07 09.2 | ||||
| NGC7129-S2-U1313 | 21 43 26.64 | +66 08 20.5 | ||||
| NGC7129-S2-U1640 | 21 43 12.35 | +66 09 55.5 | ||||
| NGC7129-S2-U1660 | 21 43 47.04 | +66 10 01.2 | ||||
| NGC7129-S2-U1713 | 21 43 49.35 | +66 10 12.9 | ||||
| NGC7129-S2-U2219 | 21 43 38.59 | +66 12 30.6 | ||||
| (a) - The upper limits to the X-ray luminosity were computed using the median of and | ||||||
| from the sample of X-ray detected Class II sources. These numbers may be underestimated if | ||||||
| the extinction is much higher, as is expected for the Class I sources (see Sect. 6.4). | ||||||
| NGC7129-… | Name | YSO | AGN? | ||||||||||||
| [] | [mag] | [mag] | [mag] | [mag] | [mag] | [mag] | [mag] | [mag] | [mag] | [mag] | [mag] | Class | |||
| …-S3-U419 | I | ||||||||||||||
| …-S3-U546 | I | ||||||||||||||
| …-S3-U968 | I | ||||||||||||||
| …-S3-U1059 | I | ||||||||||||||
| …-S3-U1169 | I | ||||||||||||||
| …-S3-U1178 | I | ||||||||||||||
| …-S3-U1211 | I | ||||||||||||||
| …-S3-U1242 | I | ||||||||||||||
| …-S3-U1521 | I | ||||||||||||||
| …-S2-U1350 | I | ||||||||||||||
| …-S3-U270 | II | ||||||||||||||
| …-S3-U500 | II | ||||||||||||||
| …-S3-U550 | II | ||||||||||||||
| …-S3-U722 | II∗ | ||||||||||||||
| …-S3-U815 | MMN-5 | II | |||||||||||||
| …-S3-U821 | II | ||||||||||||||
| …-S3-U822 | II∗ | ||||||||||||||
| …-S3-U840 | MMN-1 | II | |||||||||||||
| …-S3-U849 | II∗ | ||||||||||||||
| …-S3-U939 | HL85-S 14 | II∗ | |||||||||||||
| …-S3-U1012 | SVS 12 | II | |||||||||||||
| …-S3-U1026 | II | ||||||||||||||
| …-S3-U1085 | MMN-7 | II | |||||||||||||
| …-S3-U1103 | II | ||||||||||||||
| …-S3-U1107 | II | ||||||||||||||
| …-S3-U1109 | II | ||||||||||||||
| …-S3-U1194 | II | ||||||||||||||
| …-S3-U1246 | II | ||||||||||||||
| …-S3-U1294 | II∗ | ||||||||||||||
| …-S3-U1367 | II | ||||||||||||||
| …-S3-U1433 | II | ||||||||||||||
| …-S3-U1504 | MMN-8 | II | |||||||||||||
| …-S3-U1522 | II | ||||||||||||||
| …-S3-U1542 | II | ||||||||||||||
| …-S3-U1611 | II | ||||||||||||||
| …-S3-U1612 | II | ||||||||||||||
| …-S3-U1780 | II | ||||||||||||||
| …-S2-U613 | II | ||||||||||||||
| …-S2-U804 | II | ||||||||||||||
| …-S2-U820 | II | ||||||||||||||
| …-S2-U1083 | II | ||||||||||||||
| …-S2-U1313 | II | ||||||||||||||
| …-S2-U1640 | II | ||||||||||||||
| …-S2-U1660 | II | ||||||||||||||
| …-S2-U1713 | II | ||||||||||||||
| …-S2-U2219 | II |
| NGC7129-… | |||
| in core | in core | ||
| mag | |||
| …-S3-X1 | |||
| …-S3-X2 | |||
| …-S3-X3 | |||
| …-S3-X4 | |||
| …-S3-X6 | |||
| …-S3-X9 | |||
| …-S3-X10 | |||
| …-S3-X11 | |||
| …-S3-X13 | |||
| …-S3-X14 | |||
| …-S3-X15 | |||
| …-S3-X16 | |||
| …-S3-X17 | |||
| …-S3-X18 | |||
| …-S3-X19 | |||
| …-S3-X20 | |||
| …-S3-X21 | |||
| …-S3-X22 | |||
| …-S3-X23 | |||
| …-S3-X25 | |||
| …-S3-X26 | |||
| …-S3-X28 | |||
| …-S3-X29 | |||
| …-S3-X30 | |||
| …-S3-X31 | |||
| …-S3-X32 | |||
| …-S3-X35 | |||
| …-S3-X36 | |||
| …-S3-X40 | |||
| …-S3-X43 | |||
| …-S3-X45 | |||
| …-S3-X51 | |||
| …-S3-X52 | |||
| …-S3-X56 | |||
| …-S2-X1 | |||
| …-S2-X4 | |||
| …-S2-X5 | |||
| …-S2-X9 | |||
| …-S3-U815 | |||
| …-S3-U840 | |||
| …-S3-U939 | |||
| …-S3-U1012 | |||
| …-S3-U1085 | |||
| …-S3-U1103 | |||
| …-S3-U1107 | |||
| …-S3-U1109 | |||
| …-S3-U1194 | |||
| …-S3-U1246 | |||
| …-S2-U613 | |||
| …-S2-U820 | |||
| …-S2-U1640 |
Acknowledgements.
We would like to thank R.Gutermuth for having provided a table with the complete Spitzer photometry of NGC 7129 and his YSO classification prior to publication. We appreciate the constructive comments of the anonymous referee that have improved the manuscript. The authors have received partial funding from the FP 6 Marie Curie Research Training Network Constellation under contract MRTN-CT-2006-035890. This paper is based on data obtained with Chandra, Spitzer, and 2 MASS. BS wishes to thank E.Flaccomio, F.Albacete-Colombo and M.Caramazza for stimulating discussions.References
- Albacete Colombo et al. (2007) Albacete Colombo, J. F., Flaccomio, E., Micela, G., Sciortino, S., & Damiani, F. 2007, A&A, 464, 211
- Allen et al. (2004) Allen, L. E., Calvet, N., D’Alessio, P., et al. 2004, ApJS, 154, 363
- Bechis et al. (1978) Bechis, K. P., Harvey, P. M., Campbell, M. F., & Hoffmann, W. F. 1978, ApJ, 226, 439
- Brandt et al. (2001) Brandt, W. N., Alexander, D. M., Hornschemeier, A. E., et al. 2001, AJ, 122, 2810
- Cabrit et al. (1997) Cabrit, S., Lagage, P.-O., McCaughrean, M., & Olofsson, G. 1997, A&A, 321, 523
- Calvet et al. (2002) Calvet, N., D’Alessio, P., Hartmann, L., et al. 2002, ApJ, 568, 1008
- Caramazza et al. (2008) Caramazza, M., Micela, G., Prisinzano, L., et al. 2008, A&A, 488, 211
- Carpenter et al. (2006) Carpenter, J. M., Mamajek, E. E., Hillenbrand, L. A., & Meyer, M. R. 2006, ApJ, 651, L49
- Chiang et al. (2001) Chiang, E. I., Joung, M. K., Creech-Eakman, M. J., et al. 2001, ApJ, 547, 1077
- Cutri et al. (2003) Cutri, R. M., Skrutskie, M. F., van Dyk, S., et al. 2003, 2MASS All Sky Catalog of point sources. (The IRSA 2MASS All-Sky Point Source Catalog, NASA/IPAC Infrared Science Archive. http://irsa.ipac.caltech.edu/appli cations/Gator/)
- D’Alessio et al. (2005) D’Alessio, P., Hartmann, L., Calvet, N., et al. 2005, ApJ, 621, 461
- Damjanov et al. (2007) Damjanov, I., Jayawardhana, R., Scholz, A., et al. 2007, ApJ, 670, 1337
- Eiroa et al. (1992) Eiroa, C., Gomez de Castro, A. I., & Miranda, L. F. 1992, A&AS, 92, 721
- Eiroa et al. (1998) Eiroa, C., Palacios, J., & Casali, M. M. 1998, A&A, 335, 243
- Evans et al. (2009) Evans, N. J., Dunham, M. M., Jørgensen, J. K., et al. 2009, ApJS, 181, 321
- Feigelson et al. (2005) Feigelson, E. D., Getman, K., Townsley, L., et al. 2005, ApJS, 160, 379
- Feigelson & Nelson (1985) Feigelson, E. D. & Nelson, P. I. 1985, ApJ, 293, 192
- Flaccomio et al. (2006) Flaccomio, E., Micela, G., & Sciortino, S. 2006, A&A, 455, 903
- Flaherty et al. (2007) Flaherty, K. M., Pipher, J. L., Megeath, S. T., et al. 2007, ApJ, 663, 1069
- Font et al. (2001) Font, A. S., Mitchell, G. F., & Sandell, G. 2001, ApJ, 555, 950
- Freeman et al. (2002) Freeman, P. E., Kashyap, V., Rosner, R., & Lamb, D. Q. 2002, ApJS, 138, 185
- Fuente et al. (2005) Fuente, A., Neri, R., & Caselli, P. 2005, A&A, 444, 481
- Fuente et al. (2001) Fuente, A., Neri, R., Martín-Pintado, J., et al. 2001, A&A, 366, 873
- Getman et al. (2005a) Getman, K. V., Feigelson, E. D., Grosso, N., et al. 2005a, ApJS, 160, 353
- Getman et al. (2005b) Getman, K. V., Flaccomio, E., Broos, P. S., et al. 2005b, ApJS, 160, 319
- Gutermuth et al. (2004) Gutermuth, R. A., Megeath, S. T., Muzerolle, J., et al. 2004, ApJS, 154, 374
- Gutermuth et al. (2009) Gutermuth, R. A., Megeath, S. T., Myers, P. C., et al. 2009, ArXiv e-prints
- Gutermuth et al. (2008) Gutermuth, R. A., Myers, P. C., Megeath, S. T., et al. 2008, ApJ, 674, 336
- Haisch et al. (2001) Haisch, Jr., K. E., Lada, E. A., & Lada, C. J. 2001, ApJ, 553, L153
- Hartigan & Lada (1985) Hartigan, P. & Lada, C. J. 1985, ApJS, 59, 383
- Hartmann et al. (2005) Hartmann, L., Megeath, S. T., Allen, L., et al. 2005, ApJ, 629, 881
- Herbig (1960) Herbig, G. H. 1960, ApJS, 4, 337
- Hernández et al. (2007) Hernández, J., Hartmann, L., Megeath, T., et al. 2007, ApJ, 662, 1067
- Hillenbrand et al. (1992) Hillenbrand, L. A., Strom, S. E., Vrba, F. J., & Keene, J. 1992, ApJ, 397, 613
- Indebetouw et al. (2005) Indebetouw, R., Mathis, J. S., Babler, B. L., et al. 2005, ApJ, 619, 931
- Jørgensen et al. (2006) Jørgensen, J. K., Harvey, P. M., Evans, II, N. J., et al. 2006, ApJ, 645, 1246
- Kenyon & Hartmann (1995) Kenyon, S. J. & Hartmann, L. 1995, ApJS, 101, 117
- Kraft et al. (1991) Kraft, R. P., Burrows, D. N., & Nousek, J. A. 1991, ApJ, 374, 344
- Lada (1987) Lada, C. J. 1987, in IAU Symposium, Vol. 115, Star Forming Regions, ed. M. Peimbert & J. Jugaku, 1–17
- Lada et al. (2006) Lada, C. J., Muench, A. A., Luhman, K. L., et al. 2006, AJ, 131, 1574
- Luhman et al. (2008) Luhman, K. L., Allen, L. E., Allen, P. R., et al. 2008, ApJ, 675, 1375
- Magakian et al. (2004) Magakian, T. Y., Movsessian, T. A., & Nikogossian, E. H. 2004, Astrophysics, 47, 519
- Marigo et al. (2008) Marigo, P., Girardi, L., Bressan, A., et al. 2008, A&A, 482, 883
- Megeath et al. (2004) Megeath, S. T., Allen, L. E., Gutermuth, R. A., et al. 2004, ApJS, 154, 367
- Meyer et al. (1997) Meyer, M. R., Calvet, N., & Hillenbrand, L. A. 1997, AJ, 114, 288
- Miranda et al. (1993) Miranda, L. F., Eiroa, C., & Gomez de Castro, A. I. 1993, A&A, 271, 564
- Miskolczi et al. (2001) Miskolczi, B., Tothill, N. F. H., Mitchell, G. F., & Matthews, H. E. 2001, ApJ, 560, 841
- Muzerolle et al. (2004) Muzerolle, J., Megeath, S. T., Gutermuth, R. A., et al. 2004, ApJS, 154, 379
- Predehl & Schmitt (1995) Predehl, P. & Schmitt, J. H. M. M. 1995, A&A, 293, 889
- Preibisch et al. (2005) Preibisch, T., Kim, Y.-C., Favata, F., et al. 2005, ApJS, 160, 401
- Prisinzano et al. (2008) Prisinzano, L., Micela, G., Flaccomio, E., et al. 2008, ApJ, 677, 401
- Racine (1968) Racine, R. 1968, AJ, 73, 233
- Raymond & Smith (1977) Raymond, J. C. & Smith, B. W. 1977, ApJS, 35, 419
- Reid & Gizis (1997) Reid, I. N. & Gizis, J. E. 1997, AJ, 113, 2246
- Reid et al. (2002) Reid, I. N., Gizis, J. E., & Hawley, S. L. 2002, AJ, 124, 2721
- Rieke & Lebofsky (1985) Rieke, G. H. & Lebofsky, M. J. 1985, ApJ, 288, 618
- Robitaille et al. (2007) Robitaille, T. P., Whitney, B. A., Indebetouw, R., & Wood, K. 2007, ApJS, 169, 328
- Robitaille et al. (2006) Robitaille, T. P., Whitney, B. A., Indebetouw, R., Wood, K., & Denzmore, P. 2006, ApJS, 167, 256
- Schmitt & Liefke (2004) Schmitt, J. H. M. M. & Liefke, C. 2004, A&A, 417, 651
- Shevchenko & Yakubov (1989) Shevchenko, V. S. & Yakubov, S. D. 1989, Soviet Astronomy, 33, 370
- Siess et al. (2000) Siess, L., Dufour, E., & Forestini, M. 2000, A&A, 358, 593
- Stelzer et al. (2009) Stelzer, B., Robrade, J., Schmitt, J. H. M. M., & Bouvier, J. 2009, A&A, 493, 1109
- Stern et al. (2005) Stern, D., Eisenhardt, P., Gorjian, V., et al. 2005, ApJ, 631, 163
- Strom et al. (1986) Strom, K. M., Strom, S. E., Wolff, S. C., Morgan, J., & Wenz, M. 1986, ApJS, 62, 39
- Strom et al. (1976) Strom, S. E., Vrba, F. J., & Strom, K. M. 1976, AJ, 81, 638
- Vuong et al. (2003) Vuong, M. H., Montmerle, T., Grosso, N., et al. 2003, A&A, 408, 581
- Watson et al. (2007) Watson, A. M., Stapelfeldt, K. R., Wood, K., & Ménard, F. 2007, in Protostars and Planets V, ed. B. Reipurth, D. Jewitt, & K. Keil, 523–538
- Weintraub et al. (1994) Weintraub, D. A., Kastner, J. H., & Mahesh, A. 1994, ApJ, 420, L87
- White et al. (2007) White, R. J., Greene, T. P., Doppmann, G. W., Covey, K. R., & Hillenbrand, L. A. 2007, in Protostars and Planets V, ed. B. Reipurth, D. Jewitt, & K. Keil, 117–132
- Wood et al. (2002) Wood, K., Lada, C. J., Bjorkman, J. E., et al. 2002, ApJ, 567, 1183