Report on the Depth Requirements for a Massive Detector at Homestake
Abstract
This report provides the technical justification for locating a large detector underground in a US based Deep Underground Science and Engineering Laboratory. A large detector with a fiducial mass in the mega-ton scale will most likely be a multipurpose facility. The main physics justification for such a device is detection of accelerator generated neutrinos, nucleon decay, and natural sources of neutrinos such as solar, atmospheric and supernova neutrinos. The requirement on the depth of this detector will be guided by the rate of signals from these sources and the rate of backgrounds from cosmic rays over a very wide range of energies (from solar neutrino energies of 5 MeV to high energies in the range of hundreds of GeV).
For the present report, we have examined the depth requirement for a large water Cherenkov detector and a liquid argon time projection chamber. There has been extensive previous experience with underground water Cherenkov detectors such as IMB, Kamioka, and most recently, Super-Kamiokande which has a fiducial mass of 22 kTon and a total mass of 50 kTon at a depth of 2700 meters-water-equivalent in a mountain. Projections for signal and background capability for a larger and deeper (or shallower) detectors of this type can be scaled from these previous detectors. The liquid argon time projection chamber has the advantage of being a very fine-grained tracking detector, which should provide enhanced capability for background rejection. We have based background rejection on reasonable estimates of track and energy resolution, and in some cases scaled background rates from measurements in water.
In the current work we have taken the approach that the depth should be sufficient to suppress the cosmogenic background below predicted signal rates for either of the above two technologies. Nevertheless, it is also clear that the underground facility that we are examining must have a long life and will most likely be used either for future novel uses of the currently planned detectors or new technologies. Therefore the depth requirement also needs to be made on the basis of sound judgment regarding possible future use of the planned investment. In particular, the depth should be sufficient for any possible future use of these cavities or the level which will be developed for these large structures.
Along with these physics justifications there are practical issues regarding the existing infrastructure at Homestake and also the stress characteristics of the Homestake rock formations. In this report we have examined the various depth choices at Homestake from the point of view of the particle and nuclear physics signatures of interest. We also have sufficient information about the existing infrastructure and the rock characteristics to narrow the choice of levels for the development of large cavities with long lifetimes. We make general remarks on desirable ground conditions for such large cavities and then make recommendations on how to start examining these levels to make a final choice. In the appendix we have outlined the initial requirements for the detectors. These requirements will undergo refinement during the course of the design.
The depth requirements associated with the various physics processes considered in this report are listed in table 6 for water Cherenkov and liquid argon detector technologies. While some of these physics processes can be adequately studied at shallower depths, none of them require a depth greater than 4300 mwe which corresponds to the 4850 ft level at Homestake. It is very important to note that the scale of the planned detector is such that even for accelerator neutrino detection (which allows one to use the accelerator duty factor to eliminate cosmics) a minimum depth is needed to reduce risk of contamination from cosmic rays. After consideration of both the science and the practical issues regarding the Homestake site, we strongly recommend that the geotechnical studies be commenced at the 4850ft level, which we find to be the most suitable, in a timely manner.
This document contains figures in color.
This work was performed under the auspices of the U.S. Department of Energy, Contract No. DE-ACO2-98CH10886 and Contract No. DE-AC02-05CH11231 and No. DE-AC02-07CH11359.
This report was prepared as an account of work sponsored by an agency of the United States Government. Neither the United States Government nor any agency thereof, nor any of their employees, makes any warranty, expressed or implied, or assumes any legal liability or responsibility for the accuracy, completeness, or usefulness of any information, apparatus, product, or process disclosed, or represents that its use would not infringe privately owned rights. Reference herein to any specific commercial product, process, or service by trade name, trademark, manufacturer, or otherwise, does not necessarily constitute or imply its endorsement, recommendation, or favoring by the United States Government or any agency thereof. The views and opinions of authors expressed herein do not necessarily state or reflect those of the United States Government or any agency thereof.
First Edition 23 December 2008.
Second Edition 23 July 2009.
For the second edition, the major change was a changed and clarified description of levels in Table 7. The author list was expanded to correspond to additional contributions to this document. There were a few other minor changes to plots and captions.
I Cosmic ray muon rate in Homestake DUSEL
The most important reason for locating sensitive detectors deep underground is to eliminate the background events caused by cosmic ray muons that originate in the atmosphere of the Earth. We follow the PDG pdg to briefly summarize the rate of cosmic ray muons as a function of depth. Muons are the most numerous cosmic ray charged particles at the surface of the Earth. They are produced in the upper atmosphere by the collision of cosmic ray primaries (protons, and nuclei); and they lose about 2 GeV in the atmosphere before reaching the surface. The integral intensity of vertical muons above 1 GeV/c at sea level is . The energy spectrum is flat below 1 GeV; it steepens gradually from 10 to 100 GeV, and then it steepens further beyond 100 GeV. The muon spectrum structure reflects the energy spectrum of the primaries as well as the energy dependence of the pion interaction cross section in the atmosphere. The energy-averaged angular distribution of muons at ground level is where is the angle with respect to the vertical. Low energy muons have a steeper angular dependence, whereas high energy ones have a flatter dependence.
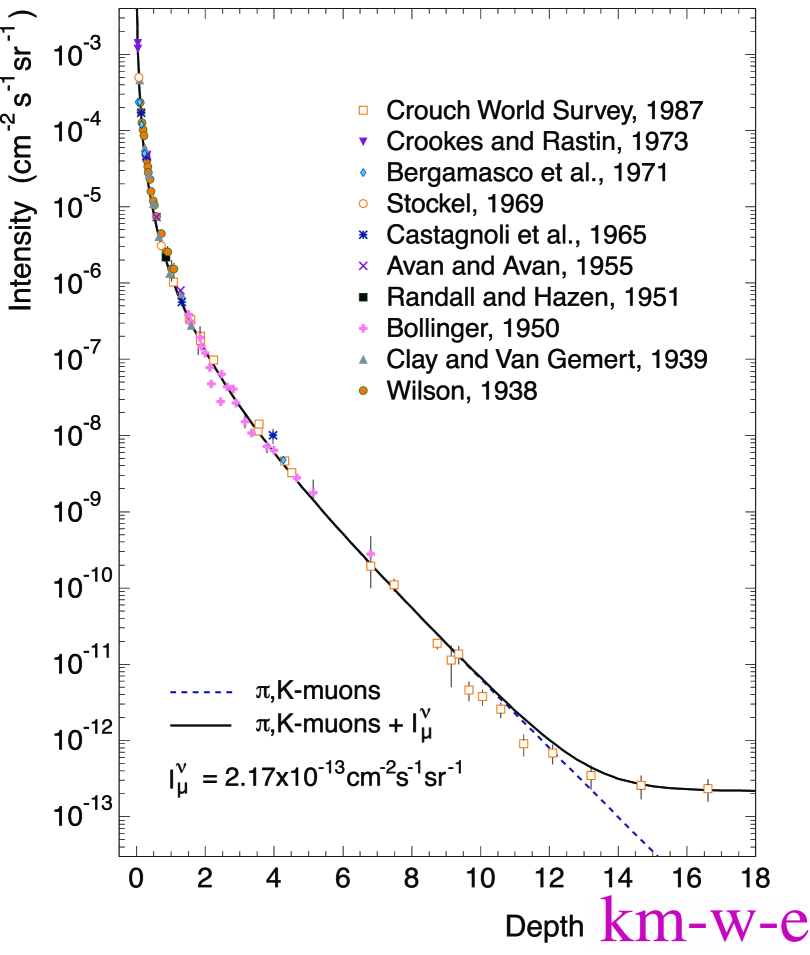
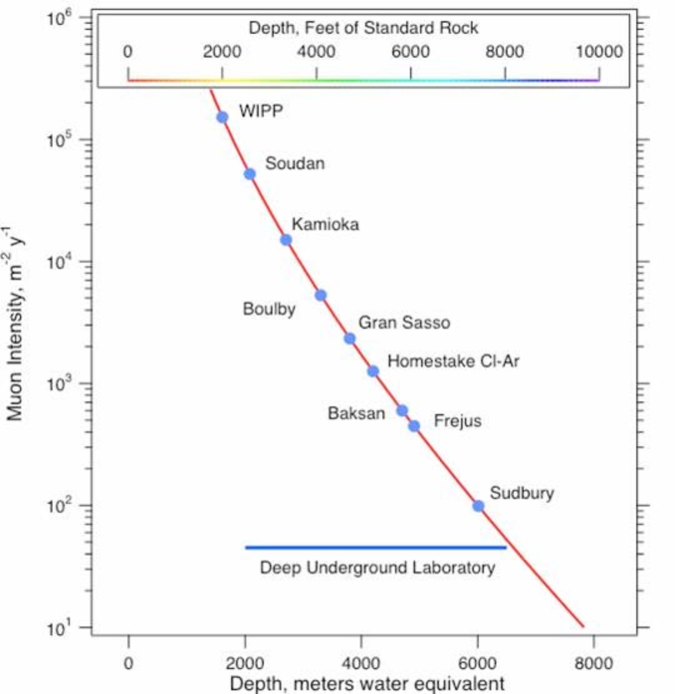
Only muons and neutrinos penetrate to significant depths underground. The muons produce tertiary fluxes of photons, electrons, and hadrons. The goal of the underground laboratory is to reduce all such sources of backgrounds by shielding the detectors under rock. The shielding is commonly expressed as either ft of standard rock (with density of 2.65 gm/cc) or in meters-water-equivalent (mwe). As muons penetrate underground they lose energy by ionization and by radiative processes. One can calculate the rate of muons underground by using a model for the surface flux and a simulation of muon traversal in the rock. A number of reviews exist that have details of such calculations pdg ; gaisser ; bugaev . A detailed compilation of muon rate data as a function of depth exists from crouch and is shown in figure 1. The shielding at various underground laboratory locations is shown in figure 2nrcrep .
An accurate calculation of the muon rate and the energy spectrum at any location within the Homestake mine is possible, but it will require careful modeling of the surface features above the chosen location. For example, the Davis chamber (of the Chlorine experiment) was determined to be at an effective shielding depth of 4200 meters-water-equivalent by examining the density of rock above the site () and the depth of rock along several angular paths lande . Such detailed modeling is underway, but will not be the subject of this report. For the purposes of this report, we have assumed a flat overburden equal to the depth of rock above a given level in the mine with rock density of . Because of surface features at Homestake the overburden could have an error of as much as 200 mwe corresponding to an error of 30% in muon rate at the 4850 ft level (see figure 2nrcrep ). This is sufficient accuracy to determine the depth required for the physics goals given here.
Table 1 shows the calculation of muon flux as a function of depth assuming a flat overburden. The depth levels chosen in the table correspond to the levels that are discussed in Section IV. The average muon energy also needs to be considered for some calculations that involve muon interactions with rocks; it increases with depth from GeV at shallow depths to GeV for depths greater than 3000 mwe.
| Homestake | Depth | Rate |
| depth (ft) | (m.w.e.) | |
| 300 | 265 | 0.75 |
| 1000 | 880 | 0.10 |
| 2600 | 2300 | |
| 3350 | 2960 | |
| 3950 | 3490 | |
| 4100 | 3620 | |
| 4850 | 4290 |
II Detector Technologies
In this section we briefly describe the technique of a water Cherenkov detector and a liquid argon time projection chamber. These are the two technologies under consideration for building a very large detector in DUSEL. We will outline how these detectors work and nature of the cosmic ray and neutrino signals from these devices.
II.1 Water Cherenkov Detector
Large volume water Cherenkov detectors have been operated very productively in particle physics for over 25 years. The first large scale water Cherenkov detector was the IMB detector, constructed in a salt mine in the United States, which began operation in the early 1980’s. Following closely on the IMB, the Kamiokande detector, built in a zinc mine of Japan, began operations. Both detectors’ original purpose was primarily a search for nucleon decay. However, these detectors went on to make important contributions to particle physics with measurements of the atmospheric neutrino flux in the GeV energy range. At Kamiokande, the detector’s energy threshold was successfully lowered far enough to enable ground breaking measurements of the lower energy solar neutrinos in the 10 MeV range using Kamiokande-II. The more recently constructed big brother of Kamiokande, Super-Kamiokande, has gone on to make important contributions in nucleon decay searches and neutrino oscillation physics. Using atmospheric neutrinos, Super-Kamiokande published the first definitive evidence of neutrino flavor oscillations, and therefore non-zero neutrino mass and lepton flavor violations, in 1998.
Some of the virtues of water Cherenkov as technology for massive detectors is the low cost, relative simplicity of design and ease of operation. The active target medium is water, which provides a very abundant, very cheap and easy to handle source for the target material with which to build the massive detectors required for the physics being explored. The wall of the water container is instrumented with photomultiplier tubes (PMTs) whose signals are readout with well understood electronics, which includes charge to digital converters and time to digital converters. The PMT readouts are then used to analyze the arrival time and the number of photons produced by the Cherenkov radiation of charged particle tracks in the water and detected by the PMTs to reconstruct vertex, direction and energy of the track.
Cherenkov photons are generated in water when a charged particle has velocity greater then the speed of light in water , where and are the vacuum speed of light and index of refraction of water respectively. These Cherenkov photons are emitted in a cone around the direction of the charged particle (with charge z) track with a half angle, given by:
where is the particle’s velocity with respect to , and is the wavelength of the Cherenkov light. For highly relativistic particles () and for the nearly pure water in these detectors in the wavelengths of sensitivity for the PMTs resulting in a Cherenkov angle of . The number of Cherenkov photons emitted per unit length (x) traveled per unit photon energy is given by:
For a highly relativistic particle of unit elementary charge traveling in water, several hundred Cherenkov photons will be generated in the wavelength range of PMT sensitivity per centimeter of travel.
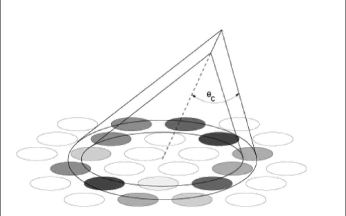
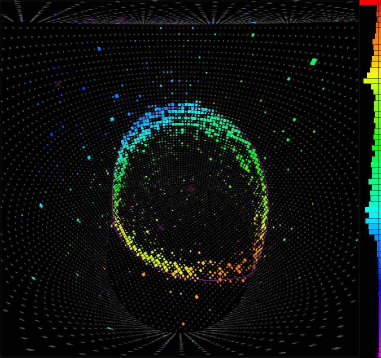
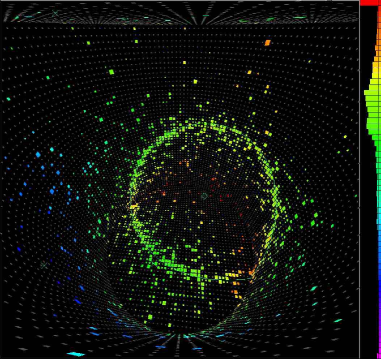
Water Cherenkov detectors use the nature of the Cherenkov light emission described above in a technique called Cherenkov ring imaging. The cone of Cherenkov light produced by the particle’s path inside the water volume of the detector travels through the clear water volume and arrives at the detector wall, where it produces a ring pattern. The PMTs lining the walls of the detector detect this light pattern. The pattern is used to uniquely reconstruct the geometry (vertex, direction and ending point) of the particle’s path as well as estimate the energy and identify the type of the particle (Figure 3).
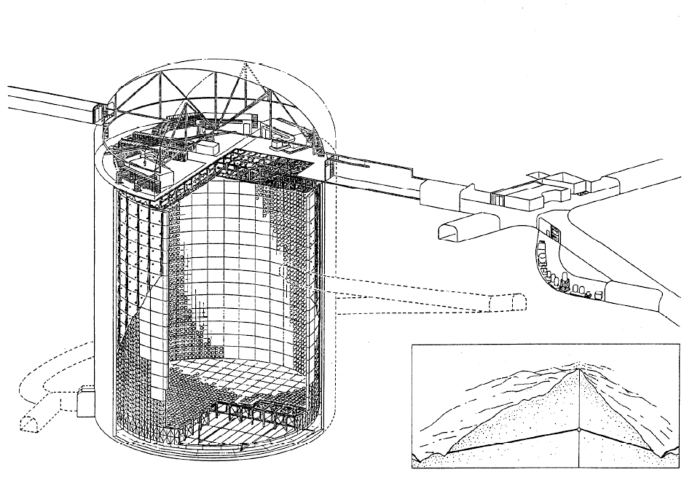
The largest operating water Cherenkov detector, with a completely man-made detector volume, is the Super-Kamiokande detector in Japan. The Super-Kamiokande detector is located in a zinc mine approximately 1 km deep inside a mountain (2700 mwe). The detector volume is a cylinder approximately 41m high and 39m in diameter holding 50 kTon of highly pure water. The walls of active inner region of the detector are lined with more then 11,000 PMTs (each with 50 cm diameter), making about 40% of the wall surface sensitive to Cherenkov photons. The detector is illustrated in Figure 4.
Water Cherenkov detectors use the Cherenkov ring imaging technique in order to search for and measure various physics processes that can occur within the detector volume. For example, a classical mode of proton decay that would be searched for is:
where the gammas are of sufficient energy that they interact within a radiation length or so and produce an electromagnetic shower similar to an electron. The signature in the detector would therefore be three electron-like tracks, with two of the tracks reconstructing to the mass. Neutrino events would be detected by measuring the particle tracks resulting from neutrino interactions within the detector volume, such as the charged current processes:
The direction, energy and flavor of the incoming neutrino () is indicated by measuring the direction, energy and flavor of the lepton () produced by the interacting neutrino. Muons can be distinguished from electromagnetic showering particles, such as electrons and gammas, with high efficiency using the morphology of their respective Cherenkov cones. Muons undergo very little multiple scattering and therefore travel straight and produce a neat outer edge to the ring projected onto the detector walls. In contrast, a particle such as an electron or gamma produces an electromagnetic shower of multiple particles, many of which undergo some multiple scattering as they travel through the water, thus causing a very ragged Cherenkov light cone on the detector walls. Figure 5 illustrates this difference for muons and electrons with event displays for both in the Super-Kamiokande detector.
A cosmic ray muon in a water Cherenkov detector will leave a distinctive signature. Because of the high energies of cosmic ray muons at the depths of interest, a large fraction of the muons will penetrate completely through the detector leaving very large deposits of energy or light. Generally, on the average, half of the photo-multiplier tubes will detect some light from such events. The ring pattern from these muons will be completely filled with large deposits of light at photo-tubes near the exit points of these muons. Muons that stop in the detector will either be absorbed by the oxygen nuclei or decay. The decay will create a low energy electron signature sometime later after the muon stops (with lifetimes of 2.2 microseconds). Muons can also undergo inelastic interactions in the rock surrounding the detector or in the detector. Such events can create neutrons that have delayed hits in the detector. In addition, muon interactions can create light radioactive nuclei that will decay (with wide ranging livetimes) mainly by beta-decay. These spallation product beta decays can cause backgrounds to low energy ( MeV) neutrino events. Depth will reduce the rate of muons as well as the rate of all events associated with the muons. A complete review is in formagio .
After traversal of a cosmic ray muon the photo-multiplier tubes and the electronic readout chain will require some time to recover (generally in the range of 100 ns). This will cause of loss of data for more interesting events such a nucleon decay or neutrinos. The muon, if not properly reconstructed could also cause background. The quantification of this data loss and backgrounds will be in section III.
II.2 Liquid argon TPC
Liquid argon time projection chambers (LArTPCs) record 3 dimensional “photo-like” images of passing particle tracks along with the energy deposited by those tracks. The few-millimeter-scale spatial granularity of a LArTPC combined with energy at each step make it a very powerful detection technique. This technique, pioneered by Carlo Rubbia rubbia and the ICARUS collaborationt600 in Europe, has been tested at the 300 ton scale with successful operation above ground of one module of the ICARUS T600 detector. Modifications to the T600 design to scale to larger sizes that can be build underground are under study in Europe and the US where a staged program of LArTPC detectors is underway.
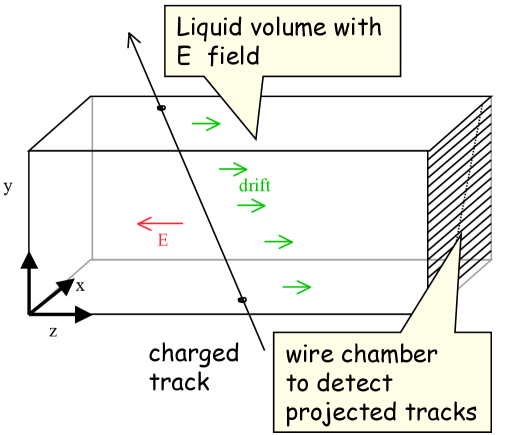
In a time projection chamber ionization, electrons from passing charged particles are drifted by a strong electric field in ultra pure liquid argon to the edge of the detector. A series of wire chamber readout planes then record the passing charge. The time of the charge at the wire plane location is also recorded. From the knowledge of the time and the position on the flat wire plane a 3 dimensional picture of the event can be reconstructed. The technique to read out the “shadow” of the event is illustrated in Figure 6.
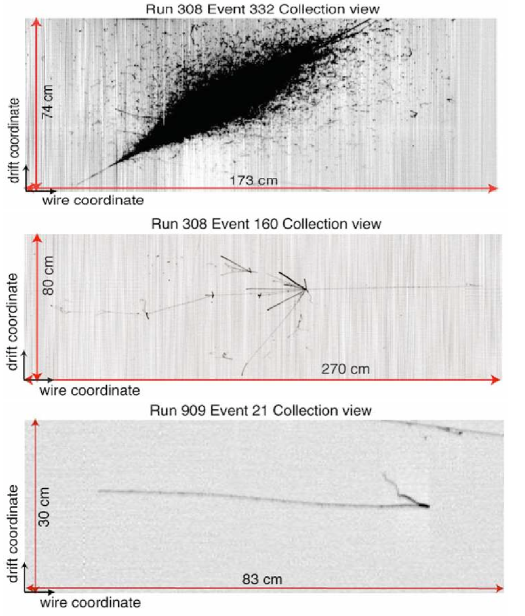
The granularity of track sampling depends upon the distance between readout electrodes on the wire chamber planes which is typically 3-5mm. The final of the typically three readout planes collects the passing charge to record the deposited energy at each step. Figure 7 shows a few examples of events in the ICARUS test detector. The granularity of the detector allows for these detailed images, and the differing intensity of the tracks shows the energy deposition measurement.
The topology of the events and the measurement can be used to differentiate signal from background for neutrino physics measurements and proton decay. For example, a cosmic ray muon will be seen as a clear incoming track, whereas a neutrino event will be a track that originates inside the chambers. As a more complex example, single electrons from charged current interactions of electron type neutrinos can be differentiated from single gamma rays from mis-identified interactions of the muon type neutrino by using the overall event topology and the energy deposition in the first few centimeters of the events. This is difficult to achieve in detectors with limited spatial resolution near the vertex. Single high energy gamma rays will produce electromagnetic showers that are almost indistinguishable from electron induced gamma rays except in detectors with very fine granularity.
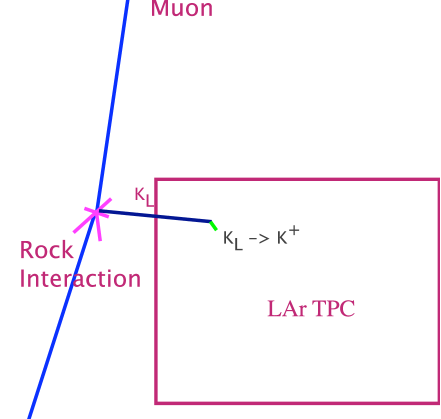
We expect that the fine resolution of the LArTPC will allow very high efficiency for electron neutrino selection compared to a water Cherenkov detector. The combination of signal efficiency and background rejection makes the LArTPC more sensitive to long baseline oscillation physics than a water Cherenkov detector, so that the detector mass needed for liquid argon to reach the same sensitivity is less by a factor of 3 to 6, than for a water Cherenkov detector. Similarly, in the case of proton decay, LArTPCs are sensitive to by detecting and identifying the final state kaon by its signature. The nuclear re-interactions of the kaon in the Argon nucleus are expected to broaden the final state momentum distribution, but the loss in detetion efficiency is expected to be small bueno . The kaon is invisible in a water Cherenkov detector because it is below Cherenkov threshold. It is expected that the LArTPC’s have high efficiency to this decay. The water Cherenkov detector is likely to have much more mass than LArTPCs; nevertheless the high efficiency will allow a LArTPC to have equal or better sensitive to this particular decay mode.
A water Cherenkov detector can be scaled up for large mass, and it has demonstrated high dynamic range in energy, and extensive experience in construction. The liquid argon TPC needs extensive R&D to demonstrate how to scale it up to the needed 50 kTon scale. Nevertheless, it could have unique capability because of the expected high efficiency for important physics goals. Therefore, the two technologies are considered complementary.
With a drift speed of about a meter per millisecond, a LArTPC with a 3-5m drift, as envisioned for these detectors, will have 3-5ms of data to read out, per event. Coincident with the event of interest will be passing cosmic ray background events. While these can in principle be rejected as background via their topology – that they enter from outside the detector, they are a background to consider if there are many to reconstruct and if they overlap an event of interest. Both of these factors are mitigated by overburden to reduce the overall cosmic background rate. How much overburden is needed depends upon the signal process, as described in the sections below.
For the long baseline experiment, very large detectors are needed to obtain sufficient events for the physics of CP violation. The key issues for construction, installation, and operation of the very large LArTPCs envisioned are
-
•
Achieving and maintaining the required purity in the large, non-evacuable cryostats housing the TPCs.
-
•
Development of cold, low-noise electronics with multiplexed readout in the detectors.
-
•
Underground construction of caverns for the LArTPC modules and safety features required for the large volumes of cryogenics needed.
A program of LArTPC development to address these questions is underway in the US. What is learned from the R&D components of this program will guide the design, construction, and installation of an initial 5 kTon and later additional 25 kTon detectors at DUSEL.
Details on the physics sensitivity of the liquid argon detector for nucleon decay, neutrino physics, and astrophysics at a given depth is presented below along with some issues related to construction and operation of the detector underground.
III Depth requirements for physics
In each of the following subsections we examine important physics signatures in the two types of detectors and how they are affected by the depth of the detector. We will generally rely on previously published reports and other material and will not attempt a complete review. Our intention is to arrive at criteria that do not overly depend on detailed software analysis or reconstruction of events for setting the depth requirement. Detailed event reconstruction capability will depend on detector technology and the large number of decisions regarding the design of the detector and electronics. A conservative approach to evaluating cosmogenic background is to rely mainly on measurements such as total energy, time, and position in fiducial volume to distinguish background from signal. If the background rate is satisfactory with such considerations, then a more detailed analysis using improved methods is likely to allow additional reduction of background rates.
III.1 Accelerator neutrinos
In this section we briefly discuss the overburden issue in the context of accelerator neutrinos. The event rate from a Fermilab based broad band neutrino beam has been extensively studied study . There are still many beam optimization issues to be resolved, nevertheless the charged current muon neutrino event rate is summarized for two possible beam choices in table 2. The total rate for a 1 MW beam operation is 20000 events per 100 kTon (fiducial mass) per year with very large effects due to oscillations. 111There will be protons on target if the beam power is 1 MW, proton energy 120 GeV, and running period of sec. We assume a running period of sec per year for our accelerator rate calculations. The fraction of muon neutrinos that convert to electron neutrinos will be small and depends on , the CP angle, and the mass hierarchy. The measurement of these effects is one of the central goals of this project. We do not address the sensitivity issues here. They are addressed in detail in many reportsstudy . Once the cosmic ray background is made negligible for selection of neutrino events, cosmic rays will have no effect on the sensitivity. It is, therefore, very important that the choice of depth be made in such a way as to completely eliminate the possibility of cosmic ray contamination of beam neutrino data.
| Event type | 100 kTon | 100 kTon |
|---|---|---|
| Proton Beam Energy | 120 GeV | 60 GeV |
| Angle | 0.5o | 0o |
| CC | 27000 | 45000 |
| No Oscillations | ||
| CC | 11400 | 21000 |
| With Oscillations |
The background rates in a large detector due to cosmic rays have been calculated for both surface and underground locations for a generic detector in the shape of a cylinder. The reduction of cosmic background can generally be facilitated by: increasing the depth of the detector, event timing with the beam pulse, and an active veto in conjunction with pattern recognition software to remove incoming muon events. The detector-related issues relevant to cosmic ray background are:
-
•
the ability to handle the raw (depth-dependent) background event rate, and
-
•
the ability to reject background events efficiently.
A preliminary evaluation of both data acquisition rates and background rejection capability without overburden leads to the following conclusions:
-
1.
It is not possible to operate a large water Cherenkov detector ( kT) on the surface.
-
2.
A liquid argon TPC could be operated on the surface during a short (sec) beam spillcosmicswriteup if high background rejection factors of () for cosmic muons (photons) can be achieved.
In general, the exceptional performance of a fine-grained tracking detector such as a liquid argon TPC will enable a higher degree of cosmic background rejection at any given depth of overburden. Therefore, we expect that the water Cherenkov detector will require a depth that is greater or equal to that of a liquid argon TPC.
Water Cherenkov detector
For a cylindrical tank of size 50 m height/diameter (approximately 100kT of water) the rate of cosmic muons (with momentum GeV/c) at the surface will be 250 kHz from the top plus 250 kHz from the sides. This implies that during a 10 beam spill there will be an average of 5 muon tracks in the detector per spill. For a single volume water Cherenkov detector in which the photo-multipliers are mounted on the walls looking inwards, each muon on the average will produce a hit in more than 50% of the PMTs. Therefore, each cosmic ray will produce enough light over a period of the crossing time through the detector (200 ns for a 40 m length) that it will render the entire detector ineffective for up to sec. With a rate of MHz at the surface the dead-time fraction is unacceptable. For example, for a detector similar in technology to Super-Kamiokande, the dead-time from the above event rates will exceed 50% sknim . It is considered impractical to mitigate this problem using fast pulse digitizers coupled with significant software and hardware R&D to resolve overlapping pulses to reconstruct multiple simultaneous events with contained vertices. However, the consequences of such electronics and analysis for background rejection and resolution are at present unknown.
Therefore, we will conservatively assume that sufficient overburden is necessary to reduce the cosmic background to a manageable level. The depth required to reduce the number of cosmic events during a sec beam spill to various levels is given in Table 3. A depth of at least meters water equivalent is needed to reduce the muon rate to a level comparable to the rate of events from the neutrino beam so that minimal dependence on pattern recognition (and a modest active veto capability) is needed to separate beam related events.
| Rate(Hz) | In-time cosmics/yr | Depth (mwe) |
|---|---|---|
| 500 kHz | 0 | |
| 3 kHz | 300,000 | 265 |
| 400 Hz | 40,000 | 880 |
| 5 Hz | 500 | 2300 |
| 1.3 Hz | 130 | 2960 |
| 0.60 Hz | 60 | 3490 |
| 0.26 Hz | 26 | 3620 |
| 0.09 Hz | 9 | 4290 |
Liquid argon TPC
A 50 kT liquid argon TPC can be contained in a cylindrical tank of size 35.5 m height/diameter; such a detector on the surface will have a cosmic ray muon rate of 125 kHz from the top and 125 kHz from the sides. An examination of cosmic rays cosmicswriteup in a liquid argon TPC has considered their effects on data acquisition and event reconstruction, and as a source of background. The rate of cosmic rays was shown to be tolerable with the proposed drift-time ( ms) and data acquisition system for cycles up to 5 Hz. In this scheme the detector takes data in a short time interval (currently proposed to be 3 drift times, or about 30 msec) near the beam time. The high granularity of the detector should allow removal of cosmic muons from the data introducing a small () inefficiency to the active detector volume, so that most of the accelerator-induced events are unobscured. If a cosmic ray muon (photon) event mimics a contained in-time neutrino event it must be rejected based on pattern recognition. The rejection required is estimated to be for muon cosmics and for photon cosmics; given the fine grained nature of the detector this rejection is likely achievable using the incoming angle of the photons and by sacrificing fiducial volume at the edges, but still needs to be demonstrated by detailed simulations.
III.2 Improved Search for Nucleon Decay
The depth requirement for proton decay experiments is dominated by the practical effect of livetime loss due to event overlap with cosmic ray muons. This is particularly serious for water Cherenkov detectors, where there is no current instrumentation or analysis that can untangle illumination of the detector on timescales of order the time it takes light to cross the detector, i.e. 220 ns for a 50-m diameter detector. If we assume that the deadtime for each crossing muon, after inclusion of reflections and electronic effects, is 1 sec, then to achieve 1% deadtime requires a rate of less than 10 kHz. Fortunately, even a modest overburden of order 1000 mwe (370 meters of rock) is sufficient to keep the deadtime due to cosmic ray muon crossing well below 1% (see Table 1 and Table 3). The IMB experiment was successful with an overburden of 1600 mwe. A liquid argon detector is very likely to have much less deadtime loss at shallow depths, in this regard, as the fine segmentation in space and drift time might allow one to exclude regions of the detector around each passing muon. Bueno et al.bueno estimate an effective loss of detector mass of less than 4% for a 100 kT liquid argon detector with mountainous overburden of only 200 m. Thus, based only on livetime arguments we find that a proton decay detector must be underground, although a depth of mwe is sufficient.
Further considerations regarding depth relate to specific signatures associated with particular nucleon decay modes. For water Cherenkov and liquid argon detectors, the mode would be fairly easy to distinguish, with similar efficiencies, at any depth due to the significant visible energy and event topology. This leaves atmospheric neutrino interactions of energy 1 GeV as the most serious background for proton decay. Depth cannot reduce background due to atmospheric neutrinos.
The mode is detected in water Cherenkov detectors using a more sophisticated analysis that combines detection of the kaon decay with coincident tagging of MeV gamma rays from the de-exitation of the remanent nucleus ( excited state of ). This tag could suffer at shallow depths. Cosmic ray induced spallation events can mimic these gamma rays, and therefore all candidate events near in time with a muon need to be rejected. The time window for the gamma ray near a candidate event is . To keep the inefficiency due to spallation 1%, the rate from spallation should be kHz. Even if one assumes 1 to 5 spallations per muon, such a rate can be easily achieved with modest overburden.
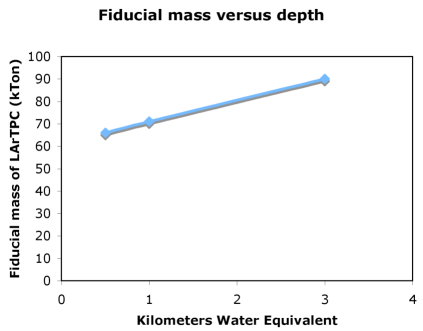
However, for both water Cherenkov and LAr TPC detectors, for the mode, a potentially indistinguishable background proportional to the cosmic ray rate appears. Nearby energetic cosmic rays may have photonuclear interactions with the rock surrounding the detector and produce hadrons including neutrons and that enter the detector. These neutral particles evade any surrounding active veto and may interact in the fiducial volume creating a contained vertex interaction that can mimic proton decay. However, sacrificing fiducial mass effectively shields against these interactions, which do not penetrate to the center of the detector. The most troubling is a charge exchange interaction of a producing a . Bueno et al.bueno estimate a background of 0.1 events per year background to at a depth of 3000 mwe, after reducing the LAr fiducial volume from 100 kton to 90 kton. This estimate is in agreement with an independent check by W. Morse morse . Morse also considered the nucleon decay mode , which requires 10% greater depth to reduce the background to an acceptable level. Shallower depths decrease the effectiveness of LAr mass, for example, 500 mwe (570 ft at Homestake) would reduce the effective mass of a 100 kTon detector by 33% compared to 3000 mwe (see figure 8). This reduction in effective mass could be mitigated by an active veto surrounding the detectorbueno . Of course, passive background suppression is always preferable to active. If the liquid argon detector is built in modules smaller than 100 kTon, the loss in fiducial volume will be much greater.
In summary, proton decay, with signatures in the 0.1-1 GeV scale, require some overburden but not the great depth needed for other experiments such as dark matter and double beta decay that work at much lower energies. From considerations of data-taking capabilities alone water Cherenkov detectors should be sited at a depth of at least 1000 mwe. However, when considering potential backgrounds to the proton decay mode, , the optimum depth appears to be greater than 3000 mwe to maintain background level of event per year. This calculation is applicable to either technology. LAr detectors may be sited at shallower depths, but with significant loss in effective mass. This loss is greater if the liquid argon detector must be built in modules smaller than 100 kTon.
III.3 Observation of Solar Neutrinos
Neutrinos from 8B decay within the Sun have been studied in great detail over the past decade by the Sudbury Neutrino Observatory (SNO) and the Super-Kamiokande Collaborations. With the additional reactor antineutrino disppearance measurements by the KamLAND collaboration, it has become clear that at energies above 1 MeV, solar neutrino flavor transformation is dominated by the Mikheyev-Smirnov-Wolfenstein (MSW) mechanism or ‘matter effect’. Nevertheless, some of the most interesting predictions of the MSW mechanism have remained elusive, because the mixing parameters are in a region that makes much of the phenomenology unobservable by existing detectors.
The most direct and convincing demonstration of the matter effect would be the observation of a change in the flavor content of a neutrino beam with and without intervening matter. Such a measurement will also result in an independent and precise measurement of the mixing angle . The solar 8B neutrino beam provides us with just such a possibility: neutrinos from the Sun pass through the dense core of the Earth at night, and the difference between the forward scattering amplitude of s and the other flavors leads to a flavor transformation similar to that which occurs within the Sun. As the beam from the Sun arrives at the Earth, it is nearly a pure state and therefore its flavor content is only 1/3 . The flavor transformation within the Earth thus leads to a net gain in content – the Sun ‘shines brighter’ in s at night than during the day.
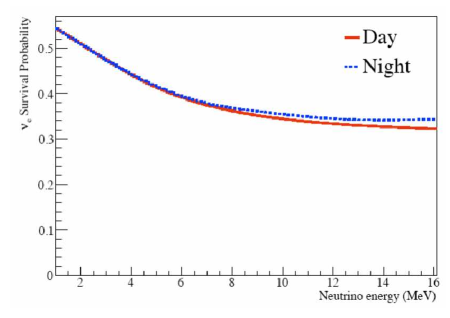
Fortunately, for the best fit values of the mixing parameters, the Day-Night flux asymmetry is largest at energies higher than 5 MeV. These energies are accessible by a large detector with reasonable light collection ( 30% coverage with photocathode of 20% quantum efficiency) and no special requirements on the purity of detector materials. Figure 9 shows the solar survival probability as a function of energy, for both ‘day’ and ‘night’ neutrinos, for the central LMA region. For the discussion here, we will assume that there will be an analysis cut at 7 MeV, above which radioactive backround becomes unimportant and only spallation events remain as important backgrounds.
A measurement of the day-night asymmetry can take several forms. At its simplest, an integral asymmetry measurement can be made:
| (1) |
Currently, the measurements by the Super-Kamiokande and SNO Collaborations on this integral asymmetry have found smy and nsp , respectively, each within 1 of when both statistics and systematics are included. For a 300 kTon water Cherenkov detector, the event rate in the detector is roughly 130/day, and consequently the statistical precision on this asymmetry after a year should be significant, , depending on the achievable analysis energy threshold. For the current best fit LMA parameters, the integral asymmetry is expected to be near 0.02. More sophisticated analyses, involving fits to the energy and zenith-angle dependent survival probabilities, have already provided noticeably better measurements of the asymmetries in both Super-Kamiokande and SNO, and could be applied in a larger detector as well.
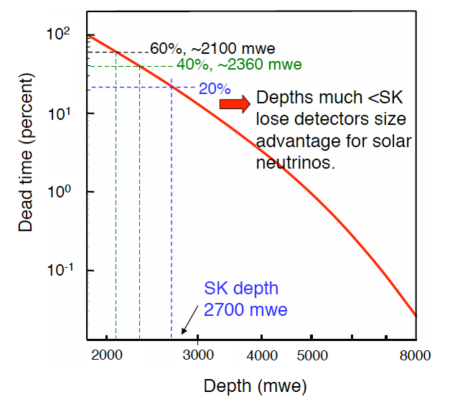
Depth affects the solar neutrino measurement in two ways: by introducing deadtime and by introducing unwanted asymmetries in the background that remains after analysis cuts. The signal in the very large water Cherenkov detector under consideration here is due to elastic scattering of solar neutrinos on the electrons in the detector. The distribution of electrons from this signal points back to the Sun. For a liquid argon detector absorption of neutrinos on argon nuclei is expected to be the dominant detection mechanism (). Backgrounds, in both detector types, associated with cosmic rays are mainly decays of radioactive spallation nuclei. For each cosmic ray muon traversing the detector, events from a tubular region around the muon must be rejected for as long as 100 milliseconds. This will create deadtime for collection of these events. This deadtime fraction is approximately independent of the volume of the detector. In figure 10 we show the spallation related deadtime in a large water Cherenkov detector versus depth in mwe. The deadtime fraction is approximately the same in a liquid argon TPC since the spallation mechanisms and time scales are similar. To keep the deadtime fraction below 20%, a minimum depth of 2700 mwe, or equivalent to Super-Kamiokande depth is recommended.
The second way the spallation backgrounds could affect the day/night measurement is by inducing fake asymmetries in the event rates. The day-night asymmetry measurement is very robust to backgrounds, as long as the backgrounds are reasonably small and symmetric day and night. For example, the spallation related events could be affected because the number of cosmic rays may differ day and night because of atmospheric conditions. The best way to eliminate such systematic effects is to reduce the rate of background to be negligible. For a depth of 4300 mwe the backgrounds become small, and the asymmetry in the backgrounds even smaller. The number of muons passing through a single 100 kTon module at this depth is roughly 0.1 Hz. At Super-Kamiokande, 1.7% of the throughgoing muons created detectable spallation eventsblaufuss , and while this fraction may be higher at greater depth (the average energy of muons is higher at greater depths) we take this as a baseline estimate. These numbers therefore imply a rate for the creation of spallation nuclei of about 150/day, before any cuts are applied. Similarly roughly 0.05 Hz of through going cosmics are expected in a 50 kton liquid argon module at 4300 mwe. Here we assume a similar fraction of spallation events as is seen at Super-Kamiokande. Therefore, we would expect the creation of about 75 spallation nuclei per day.
Very few spallation nuclei have decay energies above 7 MeV with lifetimes longer than 0.5 seconds admarino . Two exceptions are Be, with a 13.81 second half-life and a endpoint energy of 11.5 MeV, and N with an endpoint of 10.42 MeV and a half-life of 7.13 seconds. A very simple analysis then, which just removes all events within 0.5 seconds of a throughgoing muon and with energies reconstructing below 7 MeV, removes a majority of these nuclei: Be, for example, made up just 5 of the observed spallation products/day in Super-Kamiokande koshio , while N is a larger fraction at 1.4. If we assume that the N is the remaining background then we are left with roughly 75 spallation background events/year in each 100 kTon detector module. After additional removal by reconstruction cuts and the fitting of the elastic scattering directional peak we expect to have a negligible background to the day-night asymmetry measurement at a depth of 4300 mwe.
After elimination of backgrounds, the day-night asymmetry measurement is more likely to be limited by systematic uncertainties associated with understanding the signal detection asymmetries (like top versus bottom) within the detector. The consideration of these backgrounds for a liquid argon TPC are similar if the low energy threshold ( 7 MeV) can be achieved. There are important differences in the signal detection technique: the water Cherenkov signal detection is through elastic scattering of neutrinos off electrons whereas in liquid argon there is expectation that absorption of neutrinos on 40Ar will be dominant. The event rates from elastic scattering and absorption on 40Ar are expected to be in the ratio of 1:3 in a liquid argon detector, but the exact ratio depends on the energy threshold larsolar . Nevertheless, it is clear that the depth requirements for a water detector are applicable to a liquid argon detector as well.
In addition to a measurement of the day-night asymmetry, a measurement of the solar hep flux (the highest energy expected solar neutrino flux component has rate about 1/2000 of the 8B flux) could be made, if the detector’s energy resolution is good enough. Limits on the flux of solar antineutrinos, and the neutrino magnetic moment, might also be made if backgrounds are small enough. While these measurements are not as high priority as the day-night measurement, they are noticeably less robust to spallation backgrounds, and therefore a shallower depth than 4300 mwe would make them more difficult.
In summary, the signal for solar neutrinos in a very large water Cherenkov is elastic scattering of neutrinos on electrons. The background at energies of interest (above 5 MeV) mainly comes from products of spallation interactions of cosmic ray muons. Rejection of such background causes loss of signal due to deadtime. To limit this deadtime to a reasonable level (20%) requires a minimum depth similar to the depth of Super-Kamiokande. To reduce this background so that the day/night asymmetry does not have significant contribution from asymmetries in the background requires mwe. The background contributions to a solar signal in a liquid argon detector are less well known, nevertheless since the signal event rates per unit mass are similar for the two technologies (within a factor of few), the depth requirements for liquid argon should be similar to the water detector requirements.
III.4 Observation of Supernova Burst Neutrinos
A nearby core collapse supernova will provide a wealth of information via its neutrino signal (seeScholberg:2007nu for a review). In 1987, much was learned from about twenty detected neutrino interactions resulting from the explosion of a supernova in the Large Magellanic Cloud (SN1987a). The neutrinos are emitted in a burst of a few tens of seconds duration, with about half in the first second. Energies are in the few tens of MeV range, and luminosity is divided roughly equally between flavors. The observed neutrino signal will shed light on several topics of current interest.
-
•
Astrophysics: The time, energy and flavor distribution of the detected neutrinos will give valuable information on the astrophysics of core collapse: the explosion mechanism, accretion, neutron star cooling, possible transitions to quark matter or to a black hole.
-
•
Particle physics: As a copious source of neutrinos, we will also learn about the properties of neutrinos. In particular, oscillations in the core can provide information on oscillation parameters, mass hierarchy and , possibly down to very small values of , inaccessible to conventional accelerator experiments, if the systematics of the supernova models are well understood Dighe:2008dq ; Mirizzi:2006xx ; Raffelt:1997ac ; Hannestad:2001jv .
-
•
Early alert: Because the neutrinos emerge promptly after core collapse, in contrast to the electromagnetic radiation which must beat its way out of the stellar envelope, an observed neutrino signal can provide a prompt supernova alert Antonioli:2004zb ; Scholberg:2008fa . This could allow astronomers to find the supernova in early light turn-on stages, which may yield information about the progenitor.
The better one understands the astrophysics, the better the quality of
information about neutrino physics, and vice versa.
Hence it is essential to gather as much high-quality
information as possible. Ability
to tag the different neutrino flavor components of the flux
will be especially valuable.
III.4.1 The Supernova Neutrino Signal
In water, the dominant neutrino interaction is . Gd added to the water will result in improved tagging of via -rays resulting from neutron capture on Gd. Other interactions of interest are shown in table 4 Kolbe:2002gk . Elastic scattering, , while representing only a few percent of the total signal, will allow pointing to the supernova in a water Cherenkov detector, thanks to its directional nature.
In liquid argon, a tagged channel is available, , in which the de-excitation -rays are observable and provide a tagBueno:2003ei ; Cline:2006st . The sensitivity of liquid argon should be contrasted with the sensitivity of a water Cherenkov detector. With similar event rates for supernova, the two detector technologies provide important independent measurements and therefore should be considered complementary. A very strong argument for this complementarity can be seen in table 4, which has the number of interactions from a supernova at 10 kpc for a 100 kTon water and a 50 kTon liquid argon detector. At 10 kpc (the center of our galaxy), a supernova produces a few hundred interactions per kton in both water and LAr. The numbers in the table assume no effects of oscillations. Strong enhancements for are expected from oscillation effects. Detection of the enhanced rate can be made in a LAR detector and compared to the rate of in a water Cherenkov detector autiero ; botella . Comparison of data from a water Cherenkov and a liquid argon detector would be remarkable.
| 100 kt water | No. of interactions |
|---|---|
| Inverse beta decay | 23000 |
| CC | 1000 |
| NC | 1100 |
| ES | 1000 |
| 50 kt LAr | |
| CC | 3100 |
| CC | 260 |
| NC | 15000 |
| ES | 500 |
III.4.2 Depth Considerations
Depth affects the level of background seen during a supernova burst, via background related to cosmic ray muons, including imperfectly vetoed muons themselves, radioactive decay of spallation products, and Michel electrons from unvetoed entering muons. A supernova within our own galaxy (out to 20 kpc) will yield a signal bright enough within a short period of time that fairly high levels of background can be tolerated, especially since background can be well characterized outside of the burst time window. Cosmic rays can be vetoed; spallation products can also be removed, at some cost in deadtime. Some simple scaling calculations serve to estimate the severity of background as a function of depth.
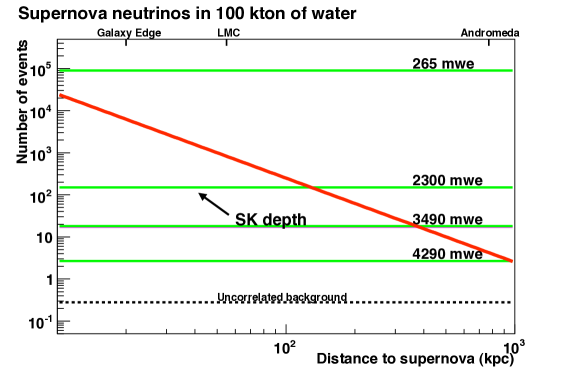
Figure 11 shows the expected total signal events as a function of distance to the supernova in 100 kTon of water. The assumed energy threshold is about 7 MeV and duration of the burst is assumed to be 30 seconds. Also shown as green solid lines are expected numbers of cosmic ray muons in the 30 second burst time window for different depths. Shown as a black solid line is the uncorrelated background, estimated by scaling the background rate from Super-Kamiokande offline supernova burst analysis Ikeda:2007sa (180 events/day) by mass. The uncorrelated background may consist of e.g. radioactivity, flashing photo-tubes, unvetoed spallation events, “invisible muons” from atmospheric neutrinos, and solar neutrinos. The simple scaling to a DUSEL 100 kt detector may or may not hold depending on the nature of typical detector noise and rejection efficiencies. It should be relatively independent of depth, although any spallation component will be depth-dependent.
From this plot can be read off the muon rejection factor required for a reasonable signal to noise for burst supernova neutrinos at a given distance and at a given depth. In Super-Kamiokande the muon-related background can be further reduced, using a muon veto that surrounds the inner detector, by a factor of . If we assume that the 100 kton detector configuration is such that a rejection factor of is possible, we can see that for all depths beyond 300 ft the signal to noise for bursts from within the Galaxy can be made reasonably high. Nevertheless, considering a supernova in Andromeda, for which one expects a handful of signal events, the signal window will suffer very little contamination at 4850 ft even without a muon veto. However, at 300 ft, the Andromeda supernova neutrinos must be extracted from among several thousand muons. Although this may not be impossible, the final sample will most likely be contaminated by muon related backgrounds. Furthermore, the greater the background, the worse the ability to separate components of the flux, and any long tail features (perhaps illuminating neutron star cooling processes Pons:1998mm ; Pons:2001ar ) will be obscured.
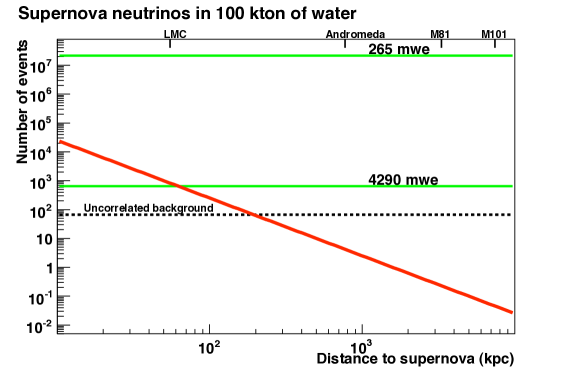
Although we could learn something about Galactic supernovae even at the shallow depths, farther-reaching supernova neutrino searches require quieter environments. It has recently been proposedAndo:2005ka to collect neutrinos one by one in coincidence with optically-observed supernovae, over a long time frame. To estimate the effect of depth on such a search, Figure 12 extends the scale of the previous plot to the distance of nearby galaxies beyond the Local Group. This plot optimistically assumes that one could estimate core collapse time to within a two hour window based on the optical observation. Here, one can see that at the 4850 ft level, with good muon rejection one may achieve a reasonably clean sample. However the limiting factor could be the uncorrelated background for which simple scaling from Super-Kamiokande may not hold. This background will have to be rejected further by analysis cuts. At 300 ft, however, it is clearly a daunting task to pick the single supernova neutrino events from the haystack of muon-related background.
Depth is also important for the early alert. It is reasonable to assume that at Super-Kamiokande depth or deeper, one could reproduce the Super-Kamiokande early alert distance sensitivity of 100 kpc. Greater fiducial mass and lower muon flux from a deeper location will improve this early alert capability. But early alert rates from muon-correlated (e.g. spallation burst) and detector-noise-related (e.g. flasher, calibration-related) are highly tunable by threshold selection and online background reduction algorithms; therefore an estimate of the early alert reach will need to be studied as part of the detector optimization. Note that coincidence with other experiments will only help if other detectors of extra-galactic sensitivity are online.
In summary, we have made estimates to show that for a Galactic core collapse, a shallow depth (1000 mwe) is sufficient for detection of the supernova neutrino events. However, the quality of the information becomes degraded the shallower one goes, and muon rejection using an active veto system must be employed to compensate. To extend the supernova reach beyond the edge of Milky Way, we recommend a depth of 3500 ft or greater, combined with rejection of muon background by which can be easily achieved by an active veto. A location at 4850 ft will reduce the background to a level where an active veto may not be needed; further rejection of both correlated and uncorrelated backgrounds can be achieved by refined analysis, but will need to be studied. Lastly, most of this study has been done for a water Cherenkov detector because a lot of information is known about backgrounds from previous experiments. Since the number of charged current signal events per unit mass is smaller for liquid argon, one needs more care in background rejection for a liquid argon detector. Due to finer granularity of the detection mechanism, we expect better muon rejection in a liquid argon detector, but it is likely that the depth requirements are similar to a water Cherenkov detector. It should be emphasized again that the water Cherenkov and liquid argon technologies are highly complementary for supernova detection: water Cherenkov is mainly sensitive to events, while liquid argon is sensitive to events. If we were to obtain supernova spectra of equal statistics from both detectors simultaneously, the scientific outcome will be extraordinary.
III.5 Observation of Diffuse Supernova Neutrinos
The explosion of a core collapse supernova releases about 99% of its energy in form of neutrinos in a time period on the order of ten seconds. Unfortunately, due to the small neutrino cross section, even such massive neutrino bursts can only be detected in our own galaxy or nearby. The combined supernova explosions throughout the universe left behind a diffuse (sometimes called relic) background of neutrinos that may be detected on Earth. The flux and spectrum of this astrophysical source of neutrinos contains information about the rate of supernova explosions (and consequently the star formation rate) in the past and also enhances our understanding of the universe to redshifts of . It is also affected by neutrino properties such as mixings and mass ordering.

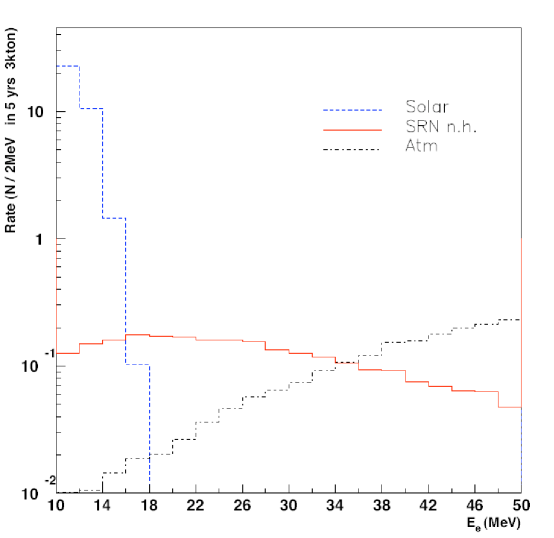
Signal in water Cherenkov detectors The best signal for diffuse supernova neutrinos in water Cherenkov detectors is the positrons resulting from the inverse reaction with electron antineutrinos. The predicted spectrum and event rate of the diffuse antineutrinos is shown in Fig. 13 along with the muon decay and atmospheric neutrino backgrounds. While the maximum flux is at lower energies ( MeV), there is significant background below 10 MeV due to antineutrinos from nuclear power reactors. The reactor background is extremely site dependent, and therefore is not shown in Fig. 13. For example, the rate of reactor events at the Kamioka site due to the high concentration of Japanese reactors is about 533 events/kTon/year. At the Homestake site the rate is considerably lower at about 37 events/kTon/year. Therefore, 10 MeV is considered the practical lower limit for detection of positrons from the very rare diffuse ’s.
The main background in the region 10-25 MeV is from cosmic ray muon spallation which is depth dependent. Even though such radioactive background can be tagged by the detection and reconstruction of the preceding muon, surviving spallation events in Super-Kamiokande-I still overwhelm the expected supernova diffuse neutrino interaction rate below MeV. Super-Kamiokande-I therefore limited the search to above 18 MeV positron energy (or 19.3 MeV diffuse neutrino energy) and placed a 90% C.L. limit on the flux above that of 1.25/cm2-sec with a data set taken in about five years (1496 live days). In the Super-Kamiokande-I analysis, the remaining irreducible backgrounds in the region above 18 MeV were due to atmospheric producing invisible muons ( MeV, below Cherenkov threshold) that subsequently decay and atmospheric and interactions. We note that a same-style analysis for a 300 kTon (fiducial) detector would improve the exposure (for 5 years) by about 13 and the sensitivity by a factor of 3.6, so the 90% limit would reach 0.34/cm2-sec. Strigari, Kaplinghat, Steigman and Walker steigman have estimated the lower limit of the diffuse neutrino flux above 18 MeV positron energy to be approximately 0.3/cm2-sec. Thus a large water Cherenkov detector should be able to detect the diffuse supernova neutrinos if the backgrounds were reduced below the Super-Kamiokande rates. There are two methods that can be utilized to reduce the backgrounds: coincident neutron detection and increased overburden (to reduce the spallation background).
The residual backgrounds above 10 MeV could be substantially reduced by detection of the neutron produced by the inverse interaction in delayed coincidence with the positron. The atmospheric and events are not generally accompanied by a neutron, and so the expected background from these sources will be much lower using the neutron tag. A neutron capture in delayed coincidence will also reduce the spallation background, since only isotopes with accompanying neutrons can be confused with diffuse neutrinos. It is difficult to estimate the remaining spallation event rate as the spallation production rates of particular isotopes are not well-known. In general, however, there are fewer isotopes and the energy of the decay is less, if a neutron has to be produced. We conservatively assume that the spallation rate would be reduced by an order of magnitude.
The capture of neutrons on hydrogen produces a 2.2 MeV -ray which is virtually undetectable in present-day water Cherenkov detectors; only about seven photo-electrons would be detected in Super-Kamiokande-I. However, doping the water with Gd salt vagins (on the order of 0.1%) results in the capture of most of the neutrons () on Gd and produces a cascade with a total energy of 8 MeV. Super-Kamiokande-I would see about 30 photo-electrons and could therefore detect these captures.
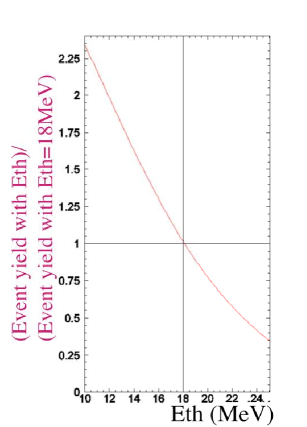
Assuming a delayed coincidence neutron tag would reduce the background due to decay electrons from sub-threshold muons by at least a factor of four, a 300 kTon detector with 18 MeV threshold could reach a flux sensitivity of cm-2sec-1. A lower energy threshold of 10 MeV increases the predicted flux by a factor of 2.3, so using a neutron tag and lowering the threshold could provide excellent sensitivity even at depths shallower than Super-Kamiokande.
To estimate the impact of overburden, we use the antineutrino spectrum from the Kaplinghat, Steigman and Walker model steigman and parameterize the spallation spectrum with a simple fit to Super-Kamiokande-I data ( where is the visible energy. We approximate the total spallation rate as a function of detector depth and energy threshold as the integral of the Super-Kamiokande-I spallation spectrum up to 25 MeV scaled by the muon intensity from figure 1.
| (2) |
where
| (3) |
is a parametrization of the muon intensity data in figure 1. From the energy threshold of the Super-Kamiokande-I analysis (18 MeV) and the Super-Kamiokande depth (2.7 km water equivalent), and the integrated Supernova diffuse neutrino interaction rate R(E), the energy threshold for a detector at depth can be estimated using the equation
| (4) |
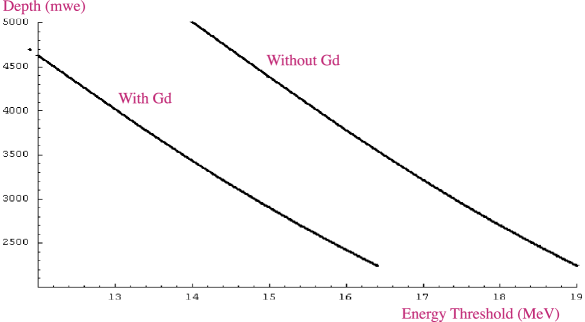
The estimated achievable energy threshold for a Gd-doped detector is then 2.6 MeV less than for a detector without Gd doping. Table 5 compares various depths with and without Gd doping, and Figure 14 shows the same information in a plot.
| rock depth | water equiv | Energy thres. | Energy thres. | Signal rate without Gd | Signal rate with Gd |
|---|---|---|---|---|---|
| ft. | km-w-e | without Gd (MeV) | with Gd (MeV) | relative to 18 MeV | relative to 18 MeV |
| 4850 | 4.3 | 15.5 | 12.0 | 1.4 | 2.0 |
| 3500 | 3.1 | 17.5 | 15.0 | 1.1 | 1.5 |
| 3300 | 2.9 | 18.0 | 15.5 | 1.0 | 1.4 |
| 2000 | 1.8 | 20.5 | 18.0 | 0.73 | 1.0 |
| 300 | 0.27 | 25.0 | 22.5 | 0.36 | 0.55 |
Signal in Liquid Argon Detectors Supernova diffuse neutrinos and anti-neutrinos will interact in liquid argon detectors via both charged and neutral current interactions as shown in table 4. These interactions are detected in all but the case of the neutral current channel, by the electron or positron in the final state. A 5 MeV electron travels 2 cm in LAr, long enough to identify the event. Below 5 MeV, the electron could be identified by the energy deposited, but for the purposes of this document, we assume a 5 MeV threshold for electrons for detection of these interaction channels.
The expected diffuse supernova neutrino signal including effects of energy resolution (% at 10 MeV) Amoruso:2003sw is shown in Figure 15 Cocco:2004ac with backgrounds from solar neutrinos at low energies and from atmospheric neutrinos at higher energies. The rate shown in the figure also includes effects of oscillations that are expected to enhance the rate for . From the figure, it is clear that the window in which the signal is best identified above background is from 16 to 40 MeV. Integrating this signal window for 5 years of data taking with a 100 kTon liquid argon detector yields events in the signal window 16-40 MeV Cocco:2004ac . The error is a combination of statistical and systematic due to the atmospheric flux normalization. The sensitivity depends strongly on the choice of signal window. The predictions for the solar neutrino backgrounds are well known, but the backgrounds from atmospheric neutrinos suffer uncertainties in the absolute flux of primary cosmic rays and cross sections for hadronic interactions. Other backgrounds due to decay electrons, spallation, and nuclear recoils are considered negligible within this signal window Cocco:2004ac . The very fine granularity of liquid argon allows rejection of the cosmogenic backgrounds by detection of low energy muons and nuclei from atmospheric neutrino interactions, in addition to incoming cosmic ray muons. Nevertheless, it would be prudent to have sufficient overburden to keep the rate of spallation events manageable for data analysis purposes; e.g. a good understanding of the spectrum of events from 10 to 50 MeV. The rate and nature of spallation in a liquid argon detector is not well known at present. If one assumes the same rate as a water Cherenkov detector (see section III.3), and assumes a rejection factor of by muon tagging, a depth of 2500 mwe is needed to keep the spallation rate approximately the same as the solar neutrino event rate above 10 MeV. Of course, a deeper location for a liquid argon detector would result in easier separation of the components of neutrino events in figure 15.
In summary, for a 300 kTon water Cherenkov detector, we estimate a positron energy threshold of 15.5 MeV would be possible, and the achievable CL sensitivity at the 4850 ft. depth would be cm-2sec-1, which is below the predictions in steigman . At shallower depths, the sensitivity would not quite reach the predicted flux. However, a Gd-doped detector would have sensitivity below the predicted flux for depths greater than 3300 ft, and significantly enhanced sensitivity relative to an undoped detector at any depth. For a liquid argon detector, the detection mechanism is different, and the backgrounds could be lower because of the fine granularity of the detector. However, there is less information at present on spallation events in liquid argon. We have made a rough estimate that a location deeper than 2500 mwe is preferrable to keep spallation backgrounds low so that an analysis of the spectrum can be performed. We want to emphasize again that the water Cherenkov and liquid argon detectors are highly complementary for the detection of diffuse supernova neutrinos. Water Cherenkov detector detects while liquid argon detector detects mainly events. A combination of the two would allow important checks on our understanding of astrophysics as well as neutrino properties.
III.6 Observation of Atmospheric Neutrinos
Atmospheric neutrinos are generated in the upper atmosphere in a uniform spherical thin shell around the Earth. For any detector located at a modest depth within the Earth, the flux of neutrinos is isotropic to a good approximation. The detection and study of atmospheric neutrinos has resulted in the remarkable discovery that the muon type neutrinos that come from below the detector over a long distance are suppressed by a factor of 2 compared to muon neutrinos that come from above the detector. The increase in statistics with larger detectors has been matched by the greater accuracy of simulations of the atmospheric flux. For a future large detector, the same study will continue; but will require better control of systematics that could arise from detector geometry, calibrations, backgrounds, and electronics. Better statistical and systematic precision could allow higher precision measurements of neutrino mixing parameters, especially . Comparison of such a measurement with accelerator based measurement is important to detect any contributions from new physics. The cosmic ray muon background is important for all of these issues.
Atmospheric neutrinos typically have energies of 1 GeV and above. Because of this, low energy backgrounds like the decay of radon isotopes are not relevant. The most important source of backgrounds for atmospheric neutrinos are cosmic-ray muons and particles created with their passage through matter. The atmospheric neutrino event rate measured by the Super-Kamiokande detector, including effects of oscillations, and all event identification cuts is kT-1yr-1. The Kamioka mine is located in a mountain with an effective shielding of about 2400 mwe. This corresponds to an approximately 3 Hz rate of muons passing through the 40 m high by 40 m diameter Super-Kamiokande detector. Figure 2 shows the rate of downward going muons at the 4850 ft level in Homestake is approximately 900 . For a 100 kTon fiducial volume detector at 4850 ft level we have estimated the rate to be 0.1 Hz (see table 3). Therefore for each 100 kTon (fiducial) detector module at 4850 ft we expect 14000 atmospheric neutrino events per year and cosmic ray muons per year.
An important issue arising from the passage of cosmic-ray muons through the detector is deadtime. If the detector is completely dead after a muon passes through than the livetime is reduced. As explained in section III.2 this is a more serious issue for water Cherenkov detectors than liquid argon since the argon detectors are fine grained. Even at a modest depth of 1000 mwe this should not be a limiting factor for atmospheric neutrino analysis, since the detector does not need to be deadtimed for more than sec after the muon passes to avoid cosmic muon related backgrounds.
The Super-Kamiokande detector operates well at effective 2400 mwe with negligible background for atmospheric neutrino events. This detector makes use of an outer detector veto with approximately 1/10th the number of 8 inch phototubes as the 11,146 20 inch PMTs in the inner detector. Therefore, it is clear that a similarly configured detector could perform well at 4300 mwe (4850 ft level). However we need to examine if the deeper location can allow us to operate the Homestake based detector without the veto shield. The IMB experiment BeckerSzendy:1992hr successfully ran without a veto. IMB was located at 1570 mwe with a muon rate almost an order of magnitude higher than that of Kamioka but with almost the same muon rate since the detector (3.3 kTon) was much smaller with correspondingly lower atmospheric neutrino rate.
As described in Ashie:2005ik the background contamination in the atmospheric muon-like neutrino sample for both the fully contained and partially contained topologies was approximately 0.1%, and 0.2%, respectively, which translates into events per kTon-year for fully contained and events per kTon-year for partially contained.
Assuming a similar configuration to Super-Kamiokande it is possible to roughly estimate the contamination due to entering background at any depth by multiplying the background rate by the ratio of cosmic ray muon rates. For example for a 100 kTon detector at the 4850 ft level, the backgrond rate would be reduced by . For a 100 kTon (fiducial) detector the atmospheric signal is about 14000 events per year with a background of roughly 0.2 events per year. If the Homestake water Cherenkov detector is planned without a veto shield, then some of the background suppression will be lost or might have to be performed by other analysis techniques. A detailed examination of this background rejection will be performed as part of the detector optimization, but we conclude that for detection of atmospheric neutrinos, a depth similar to the depth of the Super-Kamiokande detector is adequate. The deeper Homestake location at 4850 ft could allow us to remove the veto shield and increase the fiducial mass and reduce overall cost. The event rates per unit fiducial mass for a liquid argon TPC will be similar to a water Cherenkov detector. The background rates are at present unknown, but because of the finer granularity the cosmic ray muon rejection will be improved allowing a shallower location.
III.7 Summary of Depth Requirements
The depth requirements associated with the various physics processes considered in this section are listed in table 6 for both water Cherenkov and liquid argon detector technologies. While some of these physics processes can be adequately studied at shallower depths, none of them require a depth greater than 4300 mwe which corresponds to the 4850 ft level at Homestake.
For table 6 we have considered the detection of each of the physics signatures above background. The analysis of all physics processes should benefit from reduced backgrounds at the 4850 ft level. Lower backgrounds could also allow us to increase the fiducial volume of the detector and reduce the complexity of construction by removing the veto shield. Such detailed optimization studies will need to be performed as part of the detector design. Furthermore, as the previous sections show, there is considerable room for further analysis and technology improvements in the coming years, but even with considerations of these anticipated improvements, we do not see a strong physics justification for depth greater than 4850 ft.
| Physics | Water | Argon |
|---|---|---|
| Long-Baseline Accelerator | 1000 mwe | 0-1000 mwe |
| 3000 mwe | 3000 mwe | |
| Day/Night 8B Solar | 4300 mwe | 4300 mwe |
| Supernova burst | 3500 mwe | 3500 mwe |
| Relic supernova | 4300 mwe | mwe |
| Atmospheric | 2400 mwe | 2400 mwe |
IV Existing Infrastructure in Homestake and Siting Considerations
The Homestake underground has many levels spanning a spectrum of possible depths. We have developed a set of general criteria in order to identify potential sites at representative depths based on expected rock conditions and existing infrastructure. Subsequently, we have estimated the additional cost of developing the infrastructure at these levels above that already planned for the DUSEL laboratory. The actual cost of developing a level cannot be determined until a detailed geotechnical analysis is performed, so these estimates should be understood as differential costs and not representative of final costs. This work is summarized below.
IV.1 Summary of criteria for siting and candidate levels
The Homestake mine provides access from the surface to 8000 feet underground by a variety of shafts, ramps, and adits222A horizontal mine access tunnel from the outside. DUSEL plans allow primary access via the Ross and Yates shafts from the surface to the 4850 Level and use of No.6 winze from the 4850 Level to lower levels 333A winze is a shaft that provides access from level to level underground, but does not go to the surface.. Below the 1100 level, the levels are spaced at approximately every 150 feet vertically. The level name denotes feet below the top of the shaft (collar) of the Yates Shaft, which is at 5310 ft above sea level. Therefore, the 4850 Level is 4850 feet below the Yates collar. For further reference, the Ross Shaft collar is at 5355 ft above sea level. Current plans for upgrading and tailoring the shafts call for conversion of the Yates shaft and hoisting infrastructure to provide access for scientific personnel and equipment and maintaining the Ross for site maintenance, excavation, and mining services. The elevation of the Yates Shaft collar is 5310 feet above sea level, so the 4850 ft level is only 460 feet above sea level. Further details can be obtained from the Homestake DUSEL CDR cdr .
IV.1.1 Level Selection
The following criteria were used to select candidate levels. It is assumed that excavated rock will be removed via the Ross Shaft, and that excavation will be done at the same time other laboratory experiments are operating or under construction. It also should be noted that construction and refurbishment of infrastructure in the underground can be done to make nearly any of the levels suitable for experiment occupation. Some levels, however, tend to fit better with the overall mine plan to allow them to be used more easily and economically.
Considerations:
1) Only candidate levels at or above 4850 were considered. This is based on physics studies, summarized earlier in this document, which show that all scientific goals for this detector can be accomplished without having to go deeper than the 4850 ft.
2) Although additional underground facilities could be constructed, in order to maximize the use of currently available infrastructure the candidate level should provide access to existing shaft stations on both the Ross and Yates Shafts. This would provide redundant access for personnel, equipment, and safety considerations and also reflects the high demands for access for this project.
3) Levels with existing waste rock handling facilities, e.g. loading (skip) pockets, rail, conveyors, etc., may be preferable. (A skip pocket is a structure near the shafts that allow a skip to be loaded from that level. Without a skip pocket, removal of rock from the level using the shafts is not possible.) This does not restrict the range of available depths, but it serves to focus studies on levels which would not require extensive refurbishment.
4) In general, construction using the Ross Shaft between 3000 and 3600 feet should be avoided because the older mine workings are close to the shaft in this area and additional infrastructure in this area may incur difficulties in maintenance, construction, and operation.
5) Large excavations should be on a single level and contained entirely within the Yates Member, which is thought to be a good host material due to its mechanical strength. This is consistent with the recommendations of the DUSEL geotechnical committee, which were based on preliminary and non-site-specific analysis of Yates Member core samples and from Homestake Mine records.
6) Exposure of Yates Member at a candidate level should be large enough to contain 3 to 5 excavations providing a total excavated volume to support a 500-1000 kTon detector array. Locating the cavities at the same level would provide cost and schedule saving for multiple cavities, and does not restrict potential depths.
7) The Yates Member crops out at the surface to the north of the laboratory and plunges to the south. Therefore, deeper levels encounter the Yates rock closer to the Ross Shaft, as well as the Yates Shaft. In general, shallower levels require longer drifting and haulage distances than deeper levels.
8) Beyond the ES&H concerns associated in the creation of excavations, the site must support life-safety and hazard mitigation measures required for the detectors (ventilation, water drainage, redundant access, etc.). Note: Safety hazards have not been fully assessed, which will require more in-depth studies. The hazards are different for a water Cherenkov and a liquid argon detector.
Within the Yates Member at a given level, there are additional criteria based on potential schedule and budget risks:
9) Avoid areas of high stress in the formation.
10) Avoid formation contacts.
11) Avoid significant geo-structural features (e.g. dikes, shear zones, or fracture zones)
| Level | Lacks access | Yates rock | Level within | Comments |
| to both shafts | distant from | Ross pillar area | ||
| from Ross shaft | (no development) | |||
| 300 | ||||
| 800 | ||||
| 1250 | ||||
| 1700 | ||||
| 1850 | ||||
| 2300 | ||||
| 2600 | ||||
| 2750 | ||||
| 2900 | ||||
| 3050 | ||||
| 3200 | ||||
| 3350 | ||||
| 3500 | ||||
| 3650 | ||||
| 3800 | Yates member closer to the Yates shaft, | |||
| but access between shafts is not best | ||||
| 3950 | ||||
| 4100 | Possible alternative, but access | |||
| between shafts is not as good as at 4850 | ||||
| 4850 | Preferred Level |
IV.2 Candidate Levels
Table 7 is a list of the existing levels in the Homestake mine that were considered as initial candidates. Underlined levels are recommended levels for consideration due to meeting some of the listed criteria. These levels span a reasonable range of depths and would be the least expensive to develop. The levels in the table fall in 3 general categories: the upper shallow levels down to 2000 ft, the middle levels from 2000 to 3500 ft, and the deep levels below 3500 ft. The shaft stations in the upper levels are quite far away from the preferred rock to be developed (the Yates Member), a long access tunnel will be needed to the rock if the shallow sites are to be used. In the middle levels, the area closest to the shafts have rock with structural features or formation contacts that are best to avoid for laboratory development. Many of these levels also lack existing skip pockets or other infrastructure. The most important feature of the deep levels below 3500 ft is the proximity of the Yates rock to the shafts. In fact, the Yates shaft penetrates into the preferred rock at both the 4100 and 4850 ft levels.
Figure 16 is a 3 dimensional model of the Homestake site. The Ross and Yates shafts and the 4850 ft level are shown with respect to various surface features. Figure 17 shows the Yates rock unit, which is the preferred rock type for the cavities under discussion, as it descends from the surface towards the deep levels in the mine. The geology maps and existing mine workings for some of the levels from table 7 are shown in Figures 18 to 22. These are cross sections of the mine at various levels on the same scale. The principal formations are indicated by the following color index hladysz .
1. Yates Member: purple or purple-hatched.
2. Poorman Formation: between brown and purple.
3. Homestake Formation: between brown and blue.
4. Ellison Formation: borders blue.
5. Rhyolite intrusive formations: yellow.
Mine Workings are shown in green. Not all of these workings are guaranteed to be habitable at this time. Some drifts have been back filled, therefore additional information may be required. The locations of the Ross and Yates shaft stations are shown in figure 18; figures 19 to 22 have the same scale, and so the shaft can be followed as it descends.
Table 8 is a summary of representative rock strength (from Z.J. Hladysz, South Dakota School of Mining and Technology) in three directions both in compression (C) and tension (T). As can be seen, in general the Yates rock is stronger (at least in compression) than the rock of the other formations. Thus, lacking other information, it is best to stay in the Yates Member rock. The stress field, which is compressive, in the Homestake mine is known from measurements in the 1970’s and 1980’s between 3050 ft level and the 7400 ft level. This stress field is characterized by
| (5) |
where , , and are the vertical and two horizontal components of the stress in kPascal, respectively, and is the depth in meters. These parameters have allowed preliminary studies of cavern feasibility in the Yates formation. These will be summarized in section V.
| Property | Formation | |||||
|---|---|---|---|---|---|---|
| (psi) | Homestake | Ellison | Poorman | Yates | Yates contact | Rhyolite |
| with Poorman | ||||||
| 20,150 | 13,620 | 11,340 | (22,000 to | (7,900 to | (14,000 to | |
| 11,550 | 10,000 | 11,410 | 31,000) | 26,000) | 34,000) | |
| 13,270 | 12,270 | 8,150 | ||||
| 1380 | 2990 | 2350 | (1800 to | |||
| 1140 | 820 | 590 | 3300) | |||
| 1920 | 1910 | 1650 | ||||
IV.2.1 Incremental costs at levels other than 4850 ft.
Discussions with engineers familiar with the rock conditions at the mine, such as they are currently known, lend further support to the construction of the large cavities at the 4850 ft level. They include the following points:
-
•
There will not be significant cost savings in constructing large detectors at shallower levels, for example levels in the 3000 ft range, versus the 4850 ft Level. It might appear that a shallower location than 4850 ft will allow excavation to proceed with somewhat higher speed and with less total power consumption. However, these factors are considered minor in the cost and schedule of the excavation project at Homestake above the 4850 ft level.
-
•
There may be some advantage to excavating the large cavern at a higher level than the 4850 ft from a ground control perspective, but there is significant doubt that there would be much difference in how the ground support is designed or specified. Previous studies init-stab demonstrate the feasibility of the excavation at 6900 ft, so 4850 ft level should be better. However, as we point out in the next section, it is very important to understand the local rock conditions to make detailed estimates. Moreover, it is highly likely that the local conditions at levels shallower than 4850 ft are inferior.
-
•
Geotechnical studies which might include coring, modelling, etc. at the 4850 ft level will be applicable to shallower levels in a relatively straight-forward way. Studies at shallower levels will not be as applicable to the deeper site. Therefore, it is preferred that the initial coring studies start at 4850 ft.
-
•
Another consideration (and more important one) is that the Ross Pillar is near the 3000 ft level. The consulting engineers uniformly agree that this is an undesirable rock formation for excavating large cavities. The access at the Ross station on this level is highly stressed and is currently cable bolted on the 3650 L. Therefore, the middle levels from 3000 ft to 3650 ft are undesirable.
-
•
It would be costly to drive a new connection between the Ross and Yates shafts. The distance of such a connection is 3500 ft. The cost of such a connection is in the range of $10 M (without any considerations of overhead factors). However, such a construction will have significant impact on the schedule for the project. It seems unnecessary when levels exist with good connectivity between Ross and Yates.
-
•
The Ross Shaft hoisting system will be the conduit for hoisting from any level above the 4850 ft. For levels (in the range of 3000 ft) that do not have an existing loading pocket, it will likely be more expensive to build a new loading pocket than it will be to hoist from the 4850 ft level by dropping rock down from higher levels. A new loading pocket will be of order of 3-5M. Hoisting costs should be roughly 4-6 per ton so total hoisting from the 4850 ft of 500 kTon of rock (corresponding to 1 water Cherenkov cavity) should be $3M. In the past, rock mined from any of the levels above 4850 ft was dumped through an ore pass/waste pass system to the loading pocket on 5000 ft. It makes more sense to use this system than installing a new loading pocket.
-
•
Cost savings on moving the large cavities to a higher level are only realized if there is a significant change in the stress field and significant reduction in hoisting. In the previous studies init-stab , the plan was to develop these cavities at much deeper levels (6900 ft). The excavation for these cavities would have required the use of the No.6 winze system and transfer of the rock to the Ross lift. By moving to the 4850ft Level, the No.6 winze system was removed from the hoisting conduit, thereby significantly reducing hoisting time and cost. There is no such gain by moving from 4850 ft level to a shallower level.
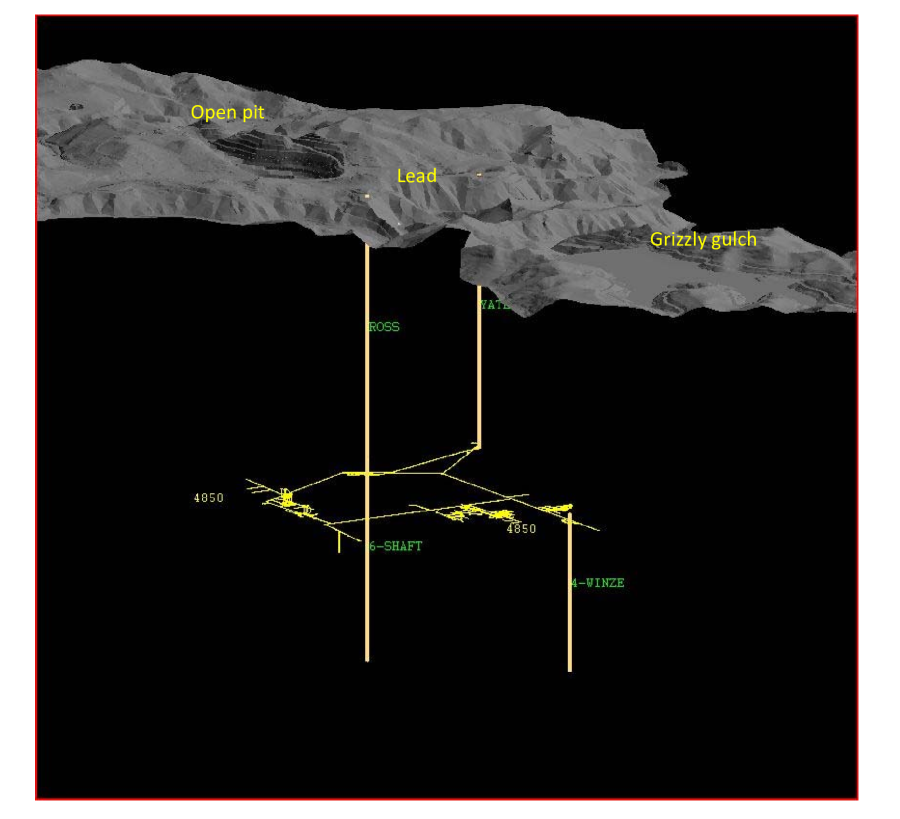
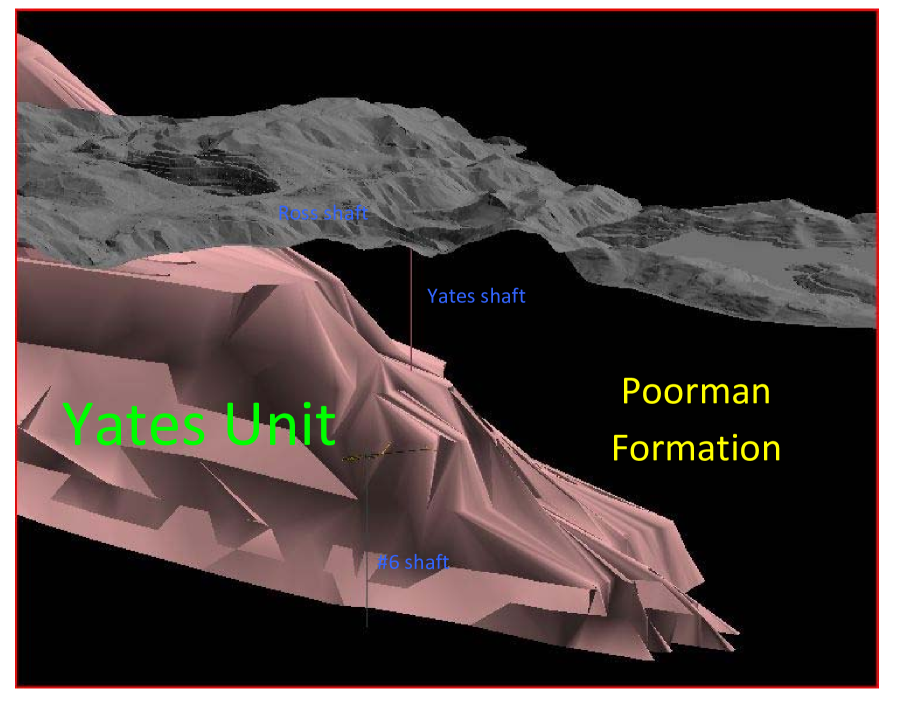
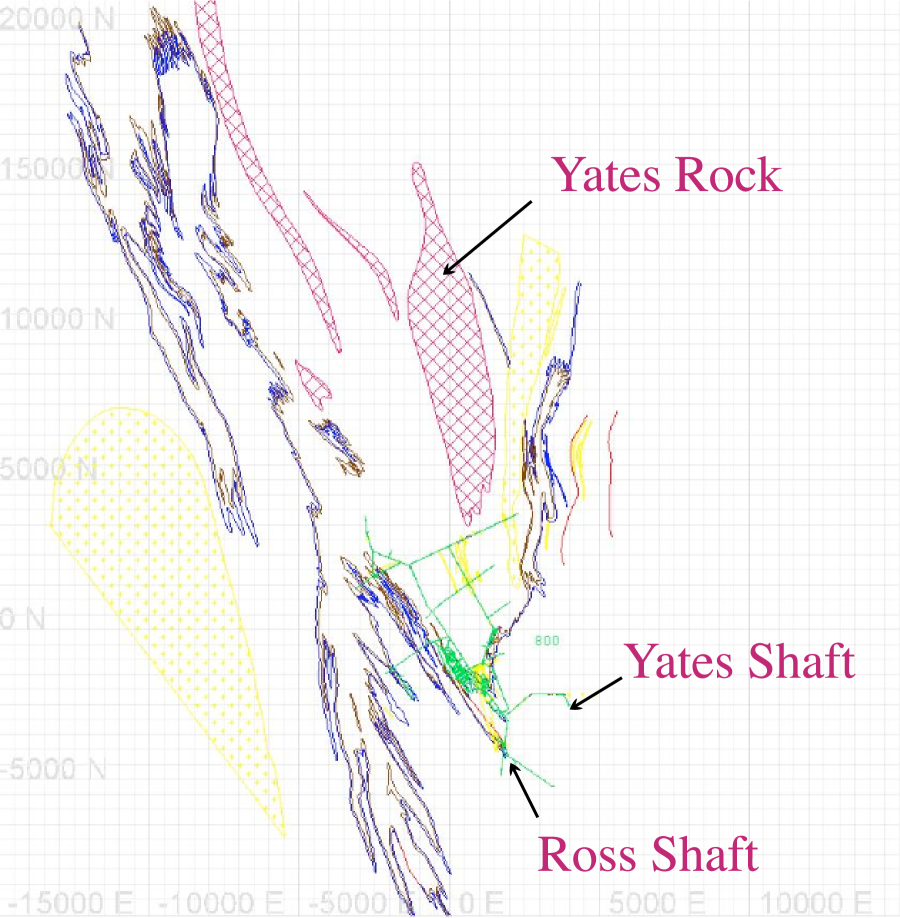
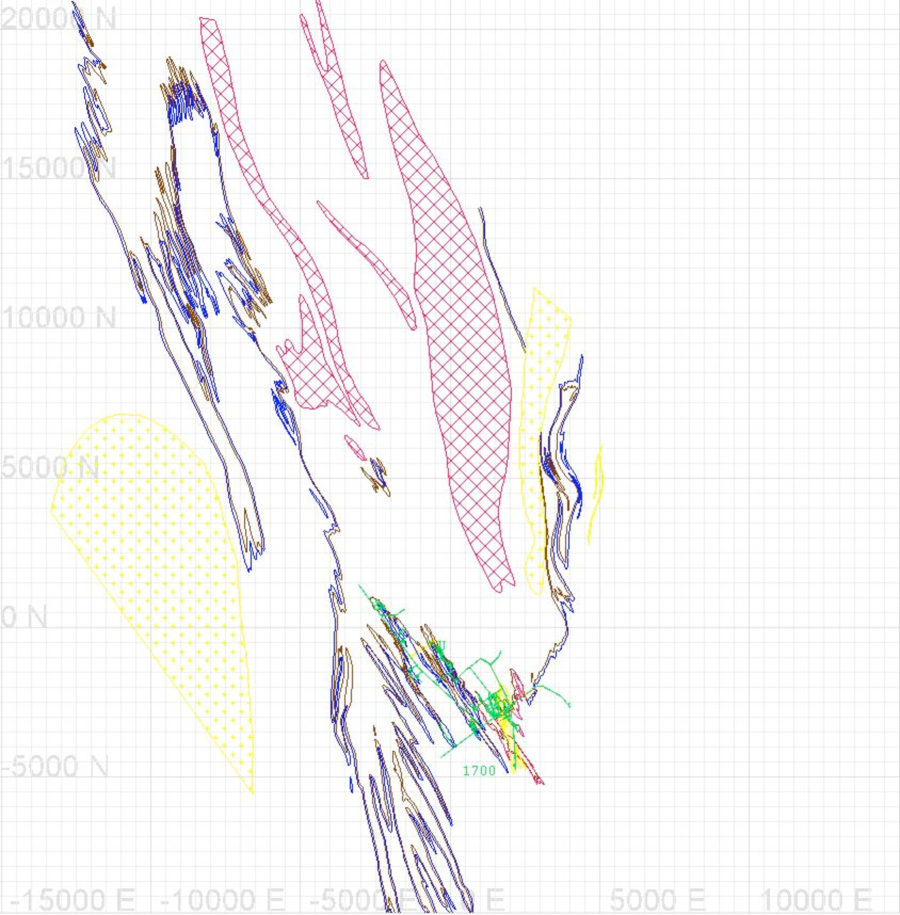
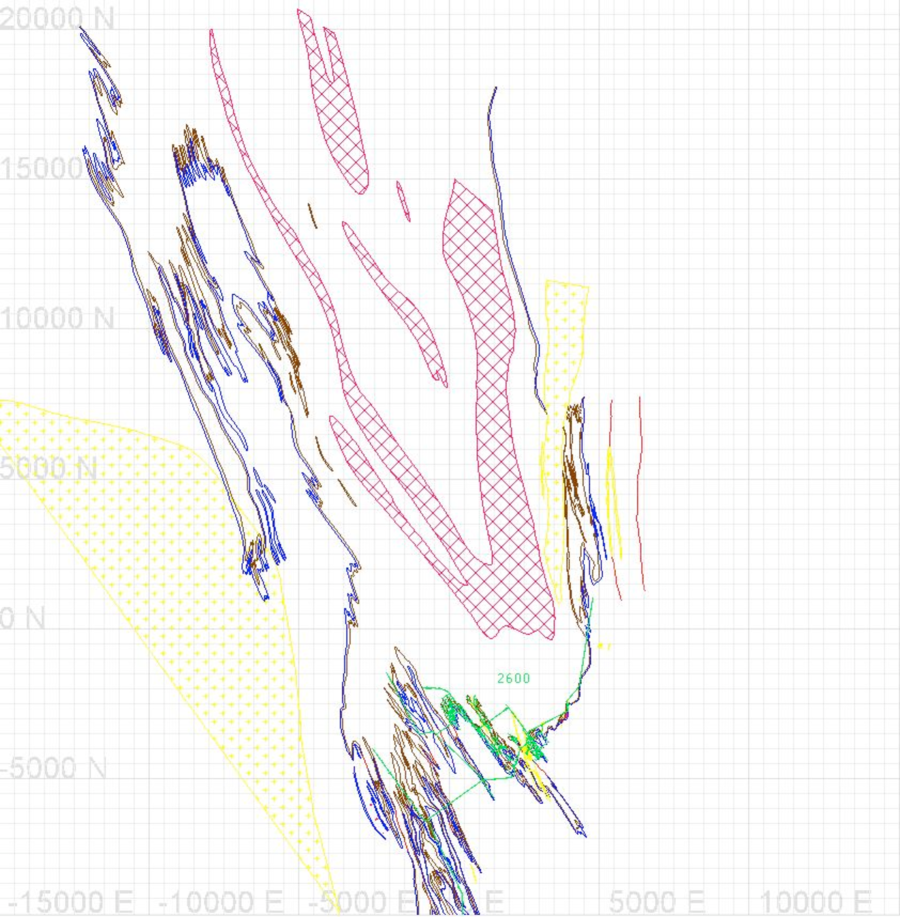
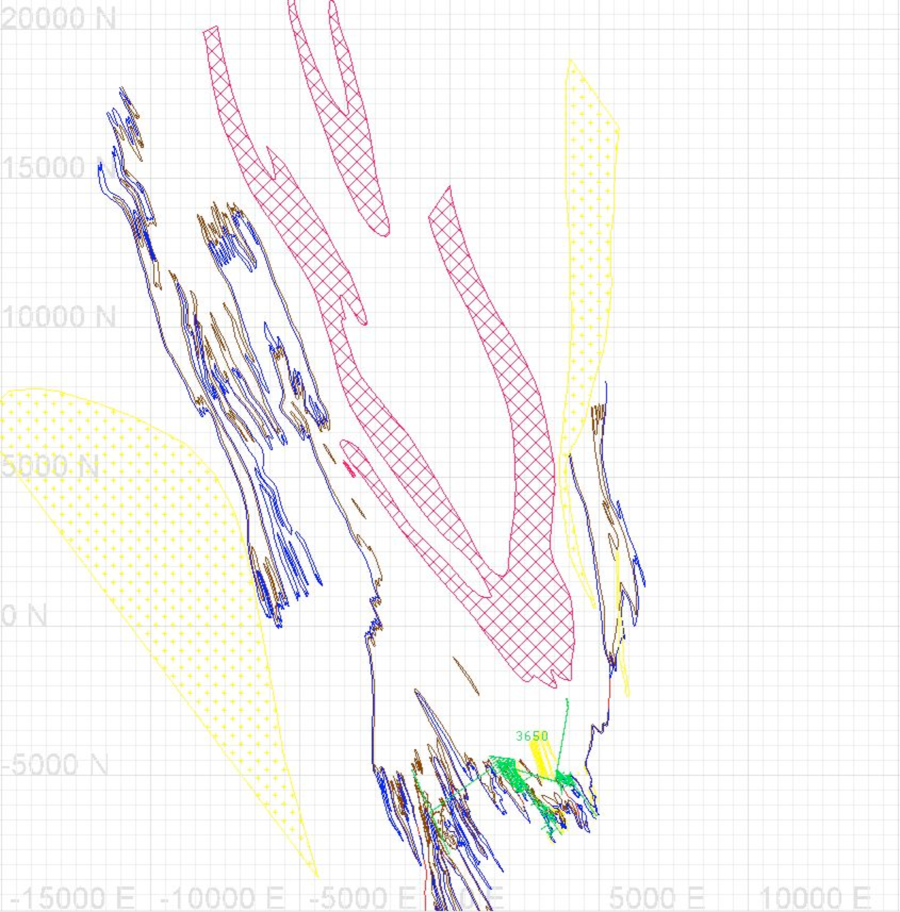
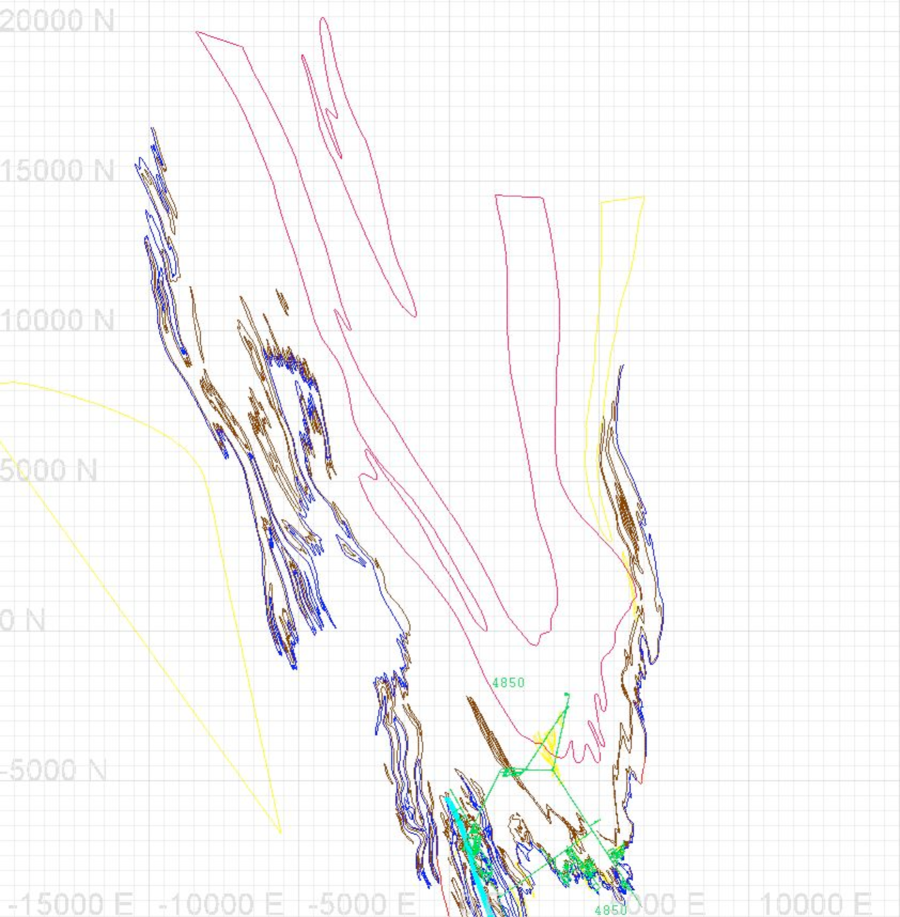
V Further Geotechnical Considerations Regarding Deep Placement of Large Caverns
In the previous sections we reviewed the depth requirements from the point of view of physics and site dependant issues. In this section we will briefly review the existing work on locating large caverns for detectors in the Homestake mine. The purpose is to inform the reader that this preliminary work gives us confidence to proceed further with the design of these caverns. Some general remarks on how such a design might proceed follow at the end of this section. Needless to say, it is extremely important to proceed with this design work to maintain a healthy schedule for the overall project.
V.1 Review of the Preliminary Work on Cavern Feasibility
Preliminary Plans for the construction of chambers for a multiple module megaton Cherenkov detector at the Homestake Mine have been described in prop . These plans were part of the US long baseline neutrino study study and were also presented to the NuSAG group nusag and the P5 panel p5 . The intention of this work was to establish the feasibility for constructing the caverns needed for the large water Cherenkov detector. Clearly, the liquid argon caverns which are smaller can also benefit from the same considerations, although for liquid argon the safety and handling issues of a large amount of cryogenics is a primary concern.
A summary of the various steps, rock strength and stability evaluation, chamber design and layout, construction planning, sequencing, and development of a preliminary budget and timetable, are described below. Although this document is a justification for much more detailed work that is necessary to evaluate the cost and schedule of this project, future work will certainly benefit from the existing documentation.
The Homestake Mine geology has been extensively studied (see the U.S. Geological Survey Bulletin 1857-J (1991) and the references cited therein). The strength characteristics of the rock have been thoroughly studied and measured. The Homestake Mining Company (HMC) has constructed several large, deep underground chambers. Among these are an equipment repair shop at the 7400 ft level and an air conditioning plant at the 6950 ft level. These excavations at great depths provide a strong indication that large excavations at depths of 4850 ft to 7000 ft can be constructed and will remain stable for multi-decade periods. The region of monolithic rock (Yates formation) being considered for the deep underground Cherenkov detector has not been mined or explored in detail. By extrapolating from above and from the west side, this rock region appears homogeneous, and with few intrusions. The preferred site for the large excavations in prop is the 4850 ft level close to the Yates shaft and the Chlorine experiment. The rock in this region is better known than the rest of the Yates formation, and therefore the confidence in the cavern stability and the excavation plan is considered high. The Chlorine Detector chamber was excavated in 1965 and has been completely stable since then. In addition, the Yates and Ross rock dump and rock hoist system are on the same level so that waste rock from the first chambers need only be transported within the same level.
V.1.1 Determination of Excavation Stability
A preliminary 2 dimensional large chamber stability evaluation was carried out in the fall of 2000 by members of the Rock Stability Group at the Spokane Research Laboratory of NIOSH (National Institute of Occupational Safety and Health). This evaluation indicated that stable chambers with dimensions in excess of 50 meters could be constructed at depths of 7000 ft or more at the Homestake Mine. In the fall of 2001, rock samples from the Yates formation were taken to the Spokane Laboratory and strength and stress analyzed. These measurements provided more specific input for a three dimensional stability analysis of large excavations as a function of depth in the Yates rock formation in the Homestake Mine. This 3D analysis involved a finite difference evaluation using the FLAC3D program. These results init-stab were compared with the empirical prediction charts of charts ; barton . The conclusions were that 50 meter diameter by 50 meter high chambers could be safely excavated and would be stable for long term occupancy at depths up to 2150 meters and probably somewhat deeper.
Using the results of the stability evaluation, a group of former Homestake mining engineers, (Mark Laurenti–former Chief Mine Engineer, Mike Stahl–former Mine Production Engineer and John Marks–former Chief Ventilation Engineer) designed an array of ten 100 kiloton water Cherenkov chambers. The criteria used in this design were, a minimum of 50 year safe occupancy of the chambers, independent ventilation and access system for each chamber so that completed chambers can be used for research while additional chambers are under construction, and a structure that will permit a plastic lined water tight and radon reducing structural enclosure. The original detector construction plan was for a detector array at the 6950 ft depth. For prop the plan was adapted for the 4850 ft level. The design involves a detailed construction plan, a rock reinforcement plan with cable and rock bolts and a cylindrical concrete liner, and a coordinated water handling, ventilation and chamber access plan. The top of each chamber is connected to the 4850 ft level via a horizontal, radial tunnel. A similar tunnel connects the bottom of each chamber to a tunnel at the 5000 ft level. Fresh air will be sent to each chamber via the top tunnel and exhaust air removed via the bottom tunnel, thus providing independent air supplies to each chamber.
Plan and elevation views of a single cavern are shown in Fig. 23. Placement of 3 of these chambers is shown in Fig. 24.
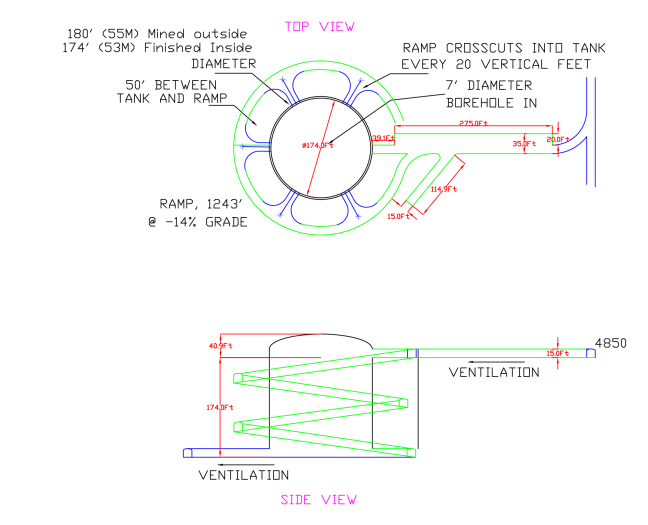
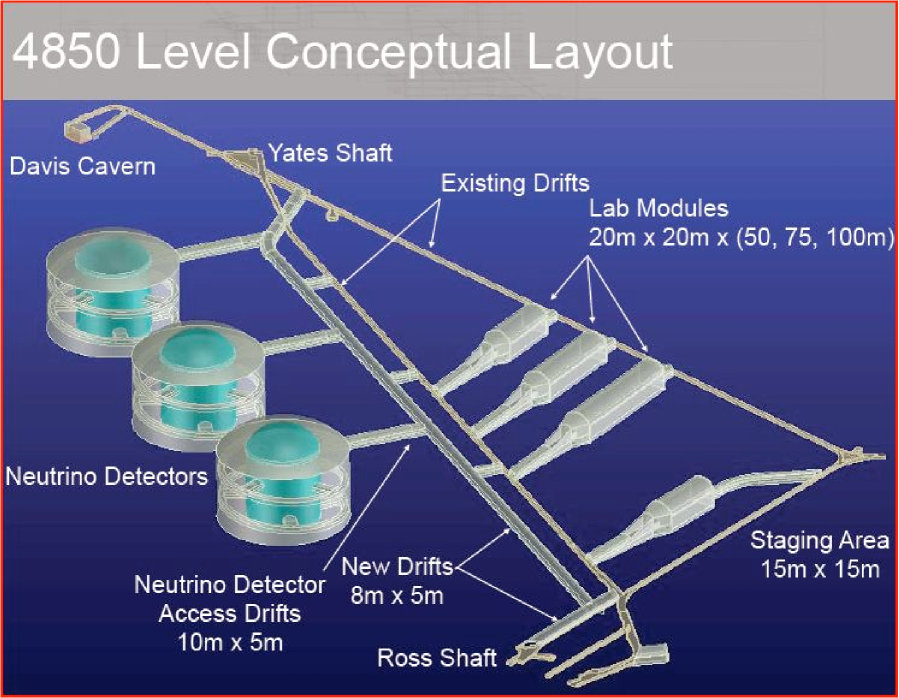
As part of the planning process a detailed timetable and budget was created for the construction of these chambers including initial rock evaluation coring, construction of both top and bottom access tunnels, removal of waste rock, maintenance of mining equipment, etc. This was presented in previous studies study ; nusag ; p5 . We emphasize, however, that the plan must be reconsidered once access to the Homestake mine is obtained and extensive site investigation has been done.
The excavation process consists of continuous repetition of three separate tasks (1) drilling and blasting of rock, (2) removal of the rock rubble, and (3) installation of rock and cable bolts to stabilize the freshly exposed rock walls. Each excavation cycle is about 10 weeks with 3 weeks for each of the above three steps. There can be a cost savings in excavating multiple chambers at the same time, with a three week phase shift between steps in each module. However, other models of excavation are also possible and should be evaluated as part of the ongoing studies.
V.1.2 Rock Removal
A 100 kiloton chamber ( m3) will involve the removal of about 419,600 tons of rock including access tunnels, domed roof, etc. Scaling from these numbers for 300 kTons (fiducial mass of water) this results in 1,258,800 tons of rock in 4 years or 314,700 tons of rock per year. Since the hoisting capacity of either the Yates or Ross shaft system is 750,000 tons per year, the simultaneous construction of three chambers utilizes only 40% of the capacity of one of the two existing shaft systems. It is important for the laboratory to identify nearby rock disposal sites as part of the planning process. In our initial planning generic disposal costs were included.
V.2 Cavern Engineering Design Plan
In this section we summarize the necessary next steps in the design and engineering of the large cavern(s) for the proposed detector. The evolving engineering plan is an essential part of the DUSEL facility plan. Current plan calls for the Geotechnical Advisory Committee (GAC) of the DUSEL facility to carry out this work using industry participation and using the best industry practices. The DUSEL facility will be aided by the Large Cavity Advisory Board (LCAB). The water Cherenkov and liquid argon detector projects will interact with the facility to define the requirements of the detector. See appendices 1 and 2 for preliminary requirements.
There is consensus that the following steps will be needed to arrive at a the exact placement of the cavern(s), the size and shape of the cavern, and the cost and schedule for building the cavern. We have made this list to be informative about how this type of geoengineering can be carried out for the reader. The exact scope of this work and the schedule will be determined by the GAC aided by LCAB and the detector collaborations.
-
•
This document, associated science studies, as well as knowledge of the Homestake mine has concluded that Yates rock at the 4850 ft level is the best location for development of the cavities. Nevertheless, the exact location within that rock has not been determined. The exact location will depend on a detailed site investigation coupled with a plan for excavation.
-
•
There are other examples of hard rock caverns of sizes that are similar to what is proposed here. There is certainly extensive experience with good documentation for the excavation of of the Super-Kamiokande cavern sknim . There are also caverns designed and built for high pressure gas storage in a number of places in the world. A cavern in hard rock was built in Skallenskallen with extensive documentation. There is also a feasibility study for a deep hard rock cavern in the Pyhasalmi mine in Finland for the LENA detector lena . The documentation for these and other examples will be used in the planning for the caverns we have described.
-
•
An initial step in the site investigation is mapping of various types of rocks and rock boundaries. This mapping can be done immediately after safe access is obtained to the 4850 ft level. Positions of geological features that are exposed on the walls of the existing drifts will be recorded. Using information from various levels a more detailed 3 dimensional view of the area can be developed.
-
•
After the mapping, suitable sites for the cavern(s) can be narrowed using these criteria: 1) The sites should be outside the zones of influence of major mapped geo-structures. Where excavation wall, crown or invert (the bottom of the cavern) rock materials could be weakened or local stress or displacement anomalies created. 2) They should be outside the zones of influence of rock contacts, where significant stiffness/stress contrasts could be present across and adjacent to boundaries. 3) Sites should be outside the zones of influence of stopes and temporary excavations, where deterioration and overstress/destress may be more frequent and severe than in virgin ground. 4) Sites should be outside the zones of influence of existing or planned permanent excavations, where higher levels of blast vibration and stress superposition could be expected. 5) Sites should be in close proximity to rehabilitated openings and infrastructure, where dedicated development costs to support investigation and construction work will be minimized. If adverse geotechnical conditions are discovered in these Yates rock volumes we can explore other Yates sites, which are more remote from existing openings or accessible on other adjacent levels (4000 - 5000ft).
-
•
There will be initial cavity modeling with existing information. This will improve on the work summarized in section V.1. The prior work was carried out assuming a cylindrical cavity at 6950 ft level. Further investigation for other shapes and sizes at the 4850 ft level needs to be performed. This modeling will also result in a list of needed site specific information.
-
•
After identification of suitable site(s) more detailed information about the rock is obtained by coring. The cores could be several hundred ft long each. Several initial cores are needed for each cavern. Some of the cores will be oriented cores in which the orientation of the rock is preserved. The cores will be analyzed to obtain i) strength of the rock in different directions, ii) boundaries or fractures within the rock mass, iii) the extent of the rock mass.
-
•
The stress field in the rock mass can also be obtained from the cores by either placement of strain gauges or by pressurizing the drill holes with water.
-
•
If there are multiple nearby cores, the pattern of water flow through the rock mass can be analyzed by measuring water flow from the cores or between cores.
-
•
The information from cores will be used to refine the modeling of the caverns. Modeling will include both analytical and computations methods. The outcome of the modeling will be recommendations i) on the rock support needed to make the cavern suitably stable, ii) on a possible liner for the cavity, iii) on the shape and size of the cavity, iv) on the motion of the walls over time and the impact on the internal detector structure, v) on the excavation sequence to minimize the stresses on the cavity wall, and vi) on a list of additional geotechnical investigation needed.
-
•
Once the exact location of the caverns is narrowed down, a detailed pattern of cores will be needed to map the rock mass at the site(s) with fine granularity. For example, each cavity may need 7 to 10 cores in a pattern that obtains information about the rock above the roof as well as on all sides of the cavern.
-
•
With full information from the detailed pattern of cores, final cavity modeling will be performed. The cavity model and the excavation sequence will be integrated with the plan for detector installation.
-
•
Sensors could be placed in the bore holes to obtain information on long term monitoring of strains in the rock.
-
•
Based on past experience in mapping and feasibility studies from other underground construction projects, it is likely that there are a number of acceptable sites in the Yates formation, but no site will be perfect. Rock strength, structure, and in situ stresses need to be measured as early as possible so that the cavity can be engineered with the best possible information, and greater confidence can be assigned to the cost and schedule. Site investigation should allow for types, locations and extents of potential adverse behavior to be pinpointed.
-
•
The above sequence was specific for the very large caverns needed for a water Cherenkov detector. The liquid argon chamber will be smaller in size, and the cavern engineering can proceed in a similar way, but is not as critical as issues related to cryogenic liquids. Liquid argon technology is also going through extensive R&D phase, and the size and shape of the cavern will depend on the length of the drift region and ideas concerning the assembly and filling of the detector. Once there is a concept for the liquid argon detector, a site within the mine must be chosen based on the best way to contain any spill of the liquid argon or vent it to the surface. The safety infrastucture needed for liquid argon will be more important for site selection than geoengineering issues.
VI Summary and Recommendation
In this document, we have investigated the depth requirements for a large underground detector at Homestake DUSEL. The goal of this work was to identify the best level for geotechnical studies needed to prepare for the construction of this detector. As part of this evaluation, we have been advised by expert engineers on existing information on infrastructure and rock characteristics to narrow the choice of levels for the development of large cavities with long lifetimes.
We have evaluated depth requirements for all major physics signatures that will make up the physics program for the large underground detector, including accelerator generated neutrinos, solar neutrinos, atmospheric neutrinos, supernova neutrinos, and nucleon decay. Table 6 summarizes the results of these studies for both water Cherenkov and liquid argon detector technologies. None of the signatures requires a depth greater than the 4850 level at Homestake (4300 mwe). We therefore recommend that geotechnical studies for the large detector be carried out at the 4850 ft level as soon as possible. This depth is sufficient to carry out an excellent physics program, and takes the best advantage of the infrastructure and rock conditions at the Homestake Mine.
VII Appendix 1: Requirements for a Long Baseline Water Cherenkov Detector
Assumptions
-
•
Broadband neutrino beam from Fermilab spanning energy range 1-10 GeV. Total event rate of 20000 to 50000 events per 100 kTon of detector mass per year.
-
•
Detector should have sufficient total fiducial mass to reach CP violation sensitivity for ; the exposure needed for this is 300 kTon1 MW 5yrs.
-
•
Detector must have capability to search for nucleon decay beyond existing bounds.
-
•
Detector must have capability to search for low energy phenomena with threshold 5 MeV. The exact threshold will be one of the scope parameters for the project.
-
•
Above requirements set the total mass of the detector to be 300 kTon.
Preliminary Technical Requirements
-
•
Detector to be in cavities.
-
•
Detector should be located with mwe shielding.
-
•
Detector modules should not be more than 5 km apart to obtain maximum beam intensity and to reduce the spectral differences between detector modules.
-
•
Maximum height of water (exerting pressure on photomultiplier assemblies): .
-
•
Maximum length through water (to reduce light loss through attenuation): .
-
•
Maximum width of cavern to be determined by studies of cavern stability.
-
•
Cavern must be lined to maintain reasonable water loss.
-
•
Each detector module fiducial volume be maintained: .
-
•
Cavern liner should accommodate photomultiplier tubes.
-
•
Magnetic field suppression coils.
-
•
Total power needed for operation: clean power, standard power. Exact power number to be determined by analysis of cooling requirements for the water and the photo-multipliers.
-
•
Other underground space needed for: electronics racks, water system, and control room for each detector module.
-
•
Standard internet connectivity and communication links.
-
•
Detector materials must be compatible with ultra high purity water.
-
•
Eventual addition of Gd salts to be considered. Material and safety considerable should include effects of Gd loading.
VIII Appendix 2: Requirements for a Long Baseline Liquid Argon Time Projection Chamber
Assumptions
-
•
Broadband neutrino beam from Fermilab spanning energy range 1-10 GeV. Total event rate of 10000 to 20000 events per 50 kTon of detector mass per year.
-
•
Liquid argon Detector should have sufficient total fiducial mass to reach CP violation sensitivity for ; the exposure needed for this is 50 kTon1 MW 5yrs with currently assumed event reconstruction performance. The exact performance will be known as a result of ongoing R&D.
-
•
Detector must have capability to search for nucleon decay in the channels unique to liquid argon including .
-
•
Detector must have capability to search for low energy phenomena with threshold 5 MeV. The exact threshold will be one of the scope parameters for this detector project.
Preliminary Technical Requirements
-
•
Detector will be built in a program of increasing size and capability. The initial size will be a 5 kTon module; second step will be 25 kTon detector; final goal is to reach 50 kTon of fiducial mass.
-
•
Liquid argon detector should be within 5 km of the core of the FNAL neutrino beam.
-
•
Minimum single drift volume 5 m5 m 30 m
-
•
The 5 kTon module cavern 15 m15 m 30 m
-
•
The 25 kTon to be built in 6 modules.
-
•
Minimum wire pitch 3 mm. Leads to 250k to 1 M channels for 25 kTon.
-
•
Heat load from electronics 50 kW to 80 kW total.
-
•
LAR purification system will be either internal or external. If external additional space will be needed.
-
•
Additional experimental support drifts will be needed to accommodate service equipment, data acquisition, and control rooms.
-
•
Clean experimental power, HVAC, UPS power, chiller water, lighting and other laboratory facilities underground.
-
•
Above ground N2 storage facility. Above group Ar delivery and storage facility.
-
•
LAR specific Safety infrastructure:
i. Fluid tight doors/bulkheads
ii. Dedicated ventilation
iii. Multi level containment
iv. Vent to surface
v. ODH monitoring system
vi. Seismic/vibration damping
vii. Floor barriers to dam/collect/direct liquid and gas to ventilation shaft. -
•
Detector cavern isolation. Detector modules will be housed so that the liquid argon area can be isolated.
References
- (1) Review of Particle Properties, Journal of Physics, G, Vol. 33, July 2006. (page 247).
- (2) V. Barger et al., Fermilab-0801-AD-E, BNL-77973-2007-IR from the study group, Also at arXiv:0705.4396, http://nwg.phy.bnl.gov/fnal-bnl
- (3) M. Bishai, J. Heim, C. Lewis, A. D. Marino, B. Viren, F. Yumiceva, July 20, 2006 BNL-76997-2006-IR.
- (4) “Cosmic rays and particle physics,” T. K. Gaisser, Cambridge University Press, 1990.
- (5) E. V. Bugaev et al. Physical Review D, Vol 58, 054001.
- (6) M.F. Crouch, in Proceedings of the 20th International Cosmic Ray Conference, Vol. 6, p. 165.
- (7) Neutrinos and Beyond: New Windows on Nature, Neutrino Facilities Assesment Committee, National Research Council, (2003), ISBN-0-309-087 16-3, http://www.nap.edu/catalog/10583.html.
- (8) Kenneth Lande, University of Pennsylvania, Private communication.
- (9) J.A. Formaggio and C.J. Martoff, Ann.Rev.Nucl.Part.Sci. 54:361-412, 2004.
- (10) C. Rubbia, “The Liquid-argon time projection chamber: a new concept for Neutrino Detector”, CERN-EP/77-08 (1977).
- (11) S. Amerio et al. [ICARUS Collaboration], “Design, construction and tests of the ICARUS T600 detector,” Nucl. Instrum. Meth. A 527, 329 (2004).
- (12) D. Gerstle and S. Pordes, “Cosmic Ray Rates on a Surface Liquid Argon TPC”. http://lartpc-docdb.fnal.gov/cgi-bin/ShowDocument?docid=160
- (13) Y. Fukuda et al., Nucl. Instrum. Meth. A 501, 418 (2003).
- (14) This figure of a simulation in the Super-Kamioka detector is a courtesy of the SK collaboration.
- (15) A. Bueno et al. hep-ph/0701101 (2007).
- (16) Hank Sobel, Presentation at the International Workshop on a Far Detector in Korea, Nov. 18, 2005. http://nwg.phy.bnl.gov/diwan/nwg/fnal-bnl/docs/Detector_Depth_Issues.pdf
- (17) Blaufuss et al. (for Super-K) NIM A 458 (2001) 638-649
- (18) Depth for a LAr detector, William Morse, Internal note, June 4, 2008.
- (19) A.D. Marino, Sudbury Neutrino Observatory internal memo, 2003.
- (20) Koshio, Yusuke, Study of Solar Neutrinos at Super Kamiokande, University of Tokyo, unpublished, (1998)
- (21) Figure courtesy of Stan Seibert, Olivier Simard, and the Sudbury Neutrino Collaboration.
- (22) F. Arneodo, et al., Nuclear Instruments and Methods, A 455 (2000) 376-389.
- (23) K. Scholberg, arXiv:astro-ph/0701081.
- (24) A. Dighe, arXiv:0809.2977 [hep-ph].
- (25) A. Mirizzi, G. G. Raffelt and P. D. Serpico, JCAP 0605, 012 (2006) [arXiv:astro-ph/0604300].
- (26) G. G. Raffelt, arXiv:astro-ph/9707268.
- (27) S. Hannestad and G. Raffelt, Phys. Rev. Lett. 87, 051301 (2001) [arXiv:hep-ph/0103201].
- (28) P. Antonioli et al., New J. Phys. 6, 114 (2004) [arXiv:astro-ph/0406214].
- (29) K. Scholberg, arXiv:0803.0531 [astro-ph].
- (30) E. Kolbe, K. Langanke and P. Vogel, Phys. Rev. D 66, 013007 (2002).
- (31) A. Bueno, I. Gil-Botella and A. Rubbia, arXiv:hep-ph/0307222.
- (32) D. B. Cline, F. Raffaelli and F. Sergiampietri, JINST 1, T09001 (2006) [arXiv:astro-ph/0604548].
- (33) D. Autiero et al., JCA 0711:011, 2007, arXiv:0705.0116
- (34) Ines Gil Botella, A. Rubbia (Zurich, ETH), ICARUS-TM-04-04, Apr 2004. 39pp. Published in JCAP 0408:001,2004. e-Print: hep-ph/0404151
- (35) M. Ikeda et al. [Super-Kamiokande Collaboration], Astrophys. J. 669, 519 (2007) [arXiv:0706.2283 [astro-ph]].
- (36) J. A. Pons, S. Reddy, M. Prakash, J. M. Lattimer and J. A. Miralles, Astrophys. J. 513, 780 (1999) [arXiv:astro-ph/9807040].
- (37) J. A. Pons, A. W. Steiner, M. Prakash and J. M. Lattimer, Phys. Rev. Lett. 86, 5223 (2001) [arXiv:astro-ph/0102015].
- (38) S. Ando, J. F. Beacom and H. Yuksel, Phys. Rev. Lett. 95, 171101 (2005) [arXiv:astro-ph/0503321].
- (39) M. Kaplinghat, G. Steigman, and T. P. Walker, arXiv:astro-ph/9912391v2
- (40) R.S. Raghavan, hep-ex/0208038
- (41) L. Strigari, M. Kaplinghat, G. Steigman, and T. P. Walker, JCAP 0403:007 (2004)
- (42) J. Beacom and M. Vagins, Phys. Lett. 93, 171101 (2004)
- (43) S. Amoruso et al. [ICARUS Collaboration], Eur. Phys. J. C 33, 233 (2004) [arXiv:hep-ex/0311040].
- (44) A. G. Cocco, A. Ereditato, G. Fiorillo, G. Mangano and V. Pettorino, JCAP 0412, 002 (2004) [arXiv:hep-ph/0408031].
- (45) The Deep Underground Science and Engineering Laboratory at Homestake: Conceptual Design Report, January 7, 2007. K.T. Lesko, et al., http://www.lbl.gov/nsd/homestake/conceptualdesign.html also see K. Lesko and W. Roggenthen, ”Siting Large Cavities in Homestake”, DUSEL doc. Nr. 58. 20 Aug 2008.
- (46) Figures are courtesy of Z. Hladysz, South Dakota School of Mines and Technology.
- (47) INITIAL STABILITY STUDY OF LARGE OPENINGS FOR THE NATIONAL UNDERGROUND SCIENCE LABORATORY AT THE HOMESTAKE MINE, LEAD, SD Doug Tesarik, Jeff Johnson, Karl Zipf, Jr., Kenneth Lande. NARMS - TAC 2002: Mining and Tunnelling Innovation and Opportunity, Vol. 1, pp 157-163 R. Hammah et al Eds.,Toronto, University of Toronto Press.
- (48) Proposal for an Experimental Program in Neutrino Physics and Proton Decay in the Homestake Laboratory, M. Diwan et al., BNL-76798-2006-IR, hep-ex/0608023
- (49) Neutrino Scientific Assessment Group (NuSAG) Third Report Submitted July 13, 2007, http://www.science.doe.gov/hep/NUSAGFinalReportJuly13,2007.pdf
- (50) Particle Physics Project Prioritization Panel (P5) US Particle Physics: Scientific Opportunities. A Strategic Plan for the Next Ten Years (June 2, 2008), http://www.er.doe.gov/hep/HEPAP/reports/P5_Report%2006022008.pdf
- (51) Barton, N.R., R. Lien, and J. Lunde. 1974. Engineering classification of rock masses for the design of tunnel support. Rock Mech. 6(4):189-239.
- (52) Grimstad, E., and N. Barton. 1993. Updating the Q-system for NMT. In Proceedings of the International Symposium on Sprayed Concrete: Modern Use of Wet Mix Sprayed Concrete for Underground Support. Oslo: Norwegian Concrete Assn.
- (53) Excavation of a cavern for high-pressure storage of natural gas, R. Glamheden, P. Curtis, Tunnelling and Underground Space Technology 21 (2006), 56-67.
- (54) M.B. Smy et al, Phys. Rev. D69:011104, (2004).
- (55) B. Aharmim et al, Phys. Rev. C72:055502, (2005).
- (56) V. Barger et al, Report of the US Long Baseline Neutrino Experiment Study, Fermilab-0801-AD-E and BNL-77973-2007-IR, 2007.
- (57) Kathrin A. Hochmuth, et al., Neutrino Geophysics: Proceedings of Neutrino Sciences 2005. Springer, New York, 2007, page 253-254. ibid. J.Phys.Conf.Ser.39:287-290,2006.
- (58) Becker-Szendy, R. and others, Nucl. Instrum. Meth., A324, 1993 (363-382).
- (59) Ashie, Y. and others, Phys. Rev. D71, 112005, hep-ex/0501064.