Testing a new view of Gamma Ray Burst Afterglows
Abstract
The optical and X–ray light–curves of long Gamma Ray Bursts (GRBs) often show a complex evolution and in most cases do not track each other. This behaviour can not be easily explained by the simplest standard afterglow models. A possible interpretation is to consider the observed optical and X–ray light–curves as the sum of two separate components. This scenario requires the presence of a spectral break between these bands. One of the aims of this work is to test whether such a break is present within the observed Swift XRT energy range. We analyse the X–ray afterglow spectra of a sample of 33 long GRBs with known redshift, good optical photometry and published estimate of the host galaxy dust absorption . We find that indeed in 7 bright events a broken power–law provides a fit to the data that is better than a single power–law model. For 8 events, instead, the X–ray spectrum is better fitted by a single power–law. We discuss the role of these breaks in connection to the relation between the host hydrogen column density and and check the consistency of the X–ray spectral breaks with the optical bands photometry. We analyse the optical to X–ray spectral energy distributions at different times and find again consistency with two components interpretation.
keywords:
Gamma Ray Bursts1 Introduction
The fast re–pointing capabilities of the Swift satellite (Gehrels et al. 2004) allowed to reveal the early time afterglow behaviour of Gamma–Ray Bursts (GRBs) and its unforeseen complexity. Several interpretation have been proposed to account for the unexpected light–curves evolution. This is often characterised by an early time steep flux decay starting after the end of the gamma-ray prompt emission, followed by a shallower and a subsequent steeper decay, the latter corresponding to the typical afterglow observed in the pre–Swift era (see e.g. Nousek et al. 2006, Zhang et al. 2006).
Great efforts have been made to explain the origin of the shallow decay phase which can last from some hundreds up to hundred of thousand seconds as it cannot be explained in the frame of the simplest “standard” forward shock fireball models. In Ghisellini et al. (2009) (hereafter G09), we presented a summary of the proposed interpretations (see also Zhang 2007 for a review).
In the last years, the increasing number of well sampled light–curves allowed to examine simultaneous optical and X–rays afterglow light–curves of several long GRBs (e.g. Curran et al. 2009, De Pasquale et al. 2009). In G09 we analysed the broad band optical to X–ray rest frame temporal behaviour of a sample of 33 GRBs observed by Swift XRT with known redshift, published host galaxy dust absorption estimate and good quality optical follow up. In some cases the optical and X–ray temporal evolution are very different. We proposed that the light curves behaviour is due to the sum of two separate components. The first one is assumed to originate from a standard forward (external) shock, as described by Panaitescu & Kumar (2000). The second component is treated in a purely phenomenological way with the aim of minimising the number of free parameters. A possible physical origin for it can be provided within the so called “late prompt” scenario described by Ghisellini et al. (2007). In G09 we found that this two component modelling is able to well reproduce all of the optical and X–ray light curves of the GRBs of the sample (once the early steep decay phase and the flaring activity that sometimes appears in the X–ray light–curves are excluded).
In order to test the consistency of the two components interpretation and make a first step towards a more physical scenario, it is important to verify whether the observed X–ray spectra and the optical to X–rays spectral energy distributions (SEDs) are in agreement with what predicted by the light–curves modelling.
In a scenario where the optical and the X–ray emission are due to different processes, the component accounting for the optical spectrum has to break in order not to dominate also in the X–ray band. Conversely a break to a harder spectral index is also required towards the soft end of the X-ray component, not to interfere with the optical emission. However, a spectral break (e.g. the cooling break frequency of the synchrotron emission mechanism) between the optical and X–ray bands is sometimes expected also in the standard afterglow scenario (see e.g. Figs. 10 and 11 in Nardini et al. 2006). In both scenarios the spectral break can be at frequencies within the observed XRT 0.3–10 keV energy range. If this is the case, spectral fits provide not only the break frequency but also the spectral slope below it. This additional information makes these events the best candidates to test the two component light–curve modelling from a spectral point of view. If the optical and X–ray light–curves are dominated by the same component, the observed optical fluxes must be consistent with the extrapolation of the X–ray low energy spectrum. If the light–curves are instead dominated by different components, the X–ray spectrum extrapolation should not significantly contribute to the observed optical flux (see §4 for a more detailed discussion).
In this work we analyse the XRT spectra of the GRBs in the G09 sample to check for the presence of such a break. In order to test whether the X–ray spectral break is consistent with what seen (simultaneously) in the optical, in §4 we examine the optical to X–ray SEDs sampled at different times along the light–curves. Such a combined analysis of broad band light–curves and optical to X–ray SEDs represents a crucial consistency check for our proposed interpretation.
As discussed in section §3.3 an interesting outcome of the spectral analysis is related to the apparent “discrepancy” between the amount of the X–ray absorption (as measured by the hydrogen column density ) and the optical extinction in the host frame. The value of inferred from fitting the X–ray spectra with a single power–law is often at odds (for standard gas-to-dust conversions) with the relatively small evaluated through the analysis of the optical SEDs (see e.g. Galama & Wijers 2001; Stratta et al. 2004; Kann, Klose & Zeh 2006, Schady et al. 2007). If the intrinsic X–ray spectrum can be well modelled by a broken power–law, then the required is smaller than what required by a single power–law fit), ameliorating the – disagreement.
2 The sample
The sample comprises the 33 long GRBs considered G09, whose selection criteria were: the knowledge of the GRB redshift, a good photometric coverage, Swift XRT observations and a published estimate of the host galaxy dust absorption . When different values of are reported in the literature we chose the estimate derived from a direct analysis of the optical spectral energy distribution rather then that obtained by a combined analysis of the optical to X–ray SEDs. If only the latter is available we discuss the effects of possible alternative solutions, through a direct analysis of the SEDs (see §4).
3 XRT data reduction and spectral analysis
We analysed the XRT data of the events in the sample with the Swift software package v2.9 distributed with HEASOFT (v6.6). The XRT data were reprocessed with the XRTPIPELINE tool111Part of the XRT software, distributed with HEASOFT package: http://heasarc.gsfc.nasa.gov/heasoft/. The spectra were extracted in both WT and PC mode with the standard grade, applying, when required, the correction for pileup (Moretti et al. 2005, Romano et al. 2006; Vaughan et al. 2006). The extraction was in boxes (WT mode) or circular regions (PC mode) of typical widths as discussed in Evans et al. (2009). Background spectra were extracted in same-sized regions far from the source. For all of the spectra we created Ancillary Response Files with the xrtmkarf tool and used the calibration database updated to December 2008. The spectra were re-binned in order to have a minimum of 20 counts per energy bin (15 for the faintest events) and energy channels below 0.3 keV and above 10 keV were excluded from the analysis. The XSPEC(v11.3.2) software was utilised for the analysis. For bursts with particularly bright X-ray emission we also performed a time resolved spectral analysis in order to check for the possible spectral evolution. Since we are not considering XRT data that are simultaneous to the BAT –ray detection, the steep early time phase and the flaring activity are not considered.
3.1 Single absorbed power–law model
Following the conventional analysis of X-ray GRB spectra we fitted all the spectra with a model composed by a power–law with two absorption components at low energies, wabs and zwabs. The first one corresponds to Galactic absorption and its column density is fixed to the Galactic value (from Kalberla et al. 2005). The second absorption is due to the material located at the redshift of the source and its column density is let free to vary. The 90% confidence intervals on the best fit parameters are obtained with the error command in XSPEC. All the spectra returned a good fit with such a model, with close to unity. The best fit parameters are in a good agreement both with the results of the automatic XRT data analysis tool available on line222http://www.swift.ac.uk/xrt_spectra/ developed by Evans et al. (2008, 2009) and with the values reported in the literature (summarised also in Tab. 1 of G09). The results of the fits are reported in Tab. 1.
| GRB | (dof) | Ref | |||||
|---|---|---|---|---|---|---|---|
| s after trigger | cm-2 | magnitudes | |||||
| 050318 | 1.44 | 3.3-6.3 | 1.10.1 | 0.50.4 | 0.89 (80) | 0.680.36 | Ber05a, Sti05 |
| 050319 | 3.24 | 5.0-1.1 | 1.060.12 | 4.4. | 0.76 (46) | 0.11 | Fyn05a, Kan09 |
| 050401 | 2.8992 | 1.3-8.5 | 0.880.04 | 15.61.9 | 1.056 (273) | 0.620.06 | Fyn05b, Wat06 |
| 050408 | 1.2357 | 2.6-7.1 | 1.150.16 | 12.22.8 | 1.36 (37) | 0.730.18 | Ber05b, dUP07 |
| 050416A | 0.653 | 3.5-1.5 | 1.010.11 | 5.81.1 | 0.88(74) | 0.190.11 | Cen05, Hol07 |
| 050525A | 0.606 | 5.9-7.4 | 1.10.17 | 2.11.1 | 0.86 (32) | 0.320.2 | Fol05, Kan09 |
| 050730 | 3.967 | 1.5-1.4 | 0.620.08 | 4.84.8 | 1.24 (95) | 0.010.005 | Che05, Sta05 |
| 050801 | 1.56 | 6.5-5.2 | 0.840.20 | 00.07 | 0.66 (14) | 0 | DeP07, Kan09 |
| 050802 | 1.71 | 4.8-9.3 | 0.820.06 | 1.81.0 | 1.055 (159) | 0.550.1 | Fyn05c Sch07 |
| 050820A | 2.612 | 4.7-5.9 | 0.990.06 | 3.32.2 | 0.98 (143) | 0.0650.008 | Pro05, Kan09 |
| 050824 | 0.83 | 6.6-1.0 | 0.870.18 | 0.60.6 | 0.95 (32) | 0.140.13 | Fyn05d, Kan09 |
| 050922C | 3.221 | 1.1-4.5 | 1.020.07 | 3.62.2 | 1.00 (115) | 0 | Jak06, Kan09 |
| 051111 | 1.55 | 5.6-5.3 | 1.210.19 | 6.13.0 | 0.80 (36) | 0.390.11 | Hil05, Sch07 |
| 060124 | 2.296 | 3.4-1.2 | 1.020.08 | 7.62.5 | 0.81 (107) | 0 | Cen06b, Mis07 |
| 060206 | 4.045 | 5.1-3.5 | 1.290.15 | 15.39.5 | 0.99 (87) | 00.02 | Fyn06, Kan09 |
| 060210 | 3.91 | 3.8-5.8 | 1.100.06 | 17.55.0 | 1.017 (185) | 1.10.2 | Cuc06, Cur07 |
| 060418 | 1.489 | 2.6-6.7 | 0.870.09 | 4.21.7 | 0.86 (91) | 0.250.22 | Pro06, Ell06 |
| 060512 | 0.4428 | 3.7-2.3 | 0.970.18 | 0.20.2 | 1.39 (17) | 0.440.05 | Blo06, Sch07 |
| 060526 | 3.221 | 7.4-7.6 | 0.950.13 | 6.6. | 0.59 (31) | 0.040.04 | Ber06, Thö08 |
| 060614 | 0.125 | 4.4-2.8 | 0.790.09 | 0.30.3 | 0.98 (66) | 0.050.02 | Pri06, Man07 |
| 060729 | 0.54 | 1.7-1.8 | 1.050.02 | 0.90.2 | 1.01 (290) | 0. | Thö06, Gru07 |
| 060904B | 0.703 | 1.0-4.1 | 1.100.12 | 2.71.2 | 0.86 (40) | 0.440.05 | Fug06, Kan09 |
| 060908 | 2.43 | 1.5-1.9 | 0.840.11 | 2.2. | 1.09 (60) | 0.0550.033 | Rol06, Kan09 |
| 060927 | 5.47 | 1.0-6.1 | 0.90.2 | 0.50.5 | 0.75 (15) | 0.330.18 | Fyn06b, RuV07 |
| 061007 | 1.26 | 2.0-2.1 | 0.910.02 | 5.60.3 | 1.054 (480) | 0.540.32 | Osi06, Kan09 |
| 061121 | 1.314 | 2.0-1.8 | 1.010.08 | 7.31.3 | 0.88 (121) | 0.720.06 | Blo06, Pag07 |
| 061126 | 1.1588 | 1.8-1.5 | 0.810.11 | 5.61.2 | 1.08 (143) | 0 | Per08a, Per08a |
| 070110 | 2.352 | 4.0-4.5 | 1.120.07 | 2.61.5 | 0.875 (129) | 0.08 | Jau07, Tro07 |
| 070125 | 1.547 | 4.7-1.3 | 0.970.2 | 1.71.7 | 0.88 (21) | 0.110.04 | Fox07, Kan09 |
| 071003 | 1.604 | 2.2-4.2 | 1.950.12 | 0.70.7 | 1.20 (47) | 0.2090.08 | Per07, Per08b |
| 071010A | 0.98 | 3.4-9.1 | 1.430.5 | 13.57.0 | 0.52 (11) | 0.6150.15 | Pro07, Cov08a |
| 080310 | 2.42 | 1.7-5.2 | 0.850.1 | 3.03.0 | 1.11 (36) | 0.10.05 | Pro08, PeB08 |
| 080319B | 0.937 | 5.6-1.7 | 0.800.01 | 1.60.1 | 1.35 (610) | 0.070.06 | Vre08, Blo09 |
3.2 Broken power–law model
In order to test for the presence of possible spectral breaks within the XRT energy range we selected the GRBs whose spectra have high signal-to-noise, namely those which, after the applied rebinning, had a minimum of 50 energy bins. This choice, on average, corresponds to a minimum of 1000 counts per spectrum. We found 20 events fulfilling this condition. In the excluded 13 cases (i.e. GRB 050319, GRB 050408, GRB 050525A, GRB 050801, GRB 050824, GRB 051111, GRB 060512, GRB 060526, GRB 060904B, GRB 060927, GRB 070125, GRB 071010A and GRB 080310) the spectrum in the considered time intervals has too low S/N for fitting a broken power–law model which has two more free parameters (i.e the spectral index of the second power-law component and the energy break between the two power-laws) with respect to the single power-law model with galactic and intrinsic absorption.
We used 2 absorption components for the broken power-law models, as described in the Section 3.1. The break energy between the low and high energy power–laws spectral indices ( and , respectively) was left free to vary in the 0.3-10 keV energy range. Clearly a significant broken power–law fit should result in statistically different and . Therefore no pre–determined relation between the model parameters was assumed (as done for instance if the emission process is assumed to be synchrotron ().
The broken power–law with a free rest frame model (hereafter ABP) has 5 free parameters while the absorbed single power–law model (hereafter AP) has 3 free parameters that are a subset of the ABP model ones. models are nested with a progression of 2 free parameters so an ABP model fitting is considered an improvement of the AP model one if (90% confidence). A similar choice was also done by Butler & Kocevski (2007): they considered as acceptable a more complex model (with an additional free parameter) if .
In 7 events (i.e. GRB 050802, GRB 050820A, GRB 060210, GRB 060729, GRB 061007, GRB 061126, GRB 080319B) the fit with the ABP model resulted in an acceptable and the 5 free parameters of the ABP model were constrained with acceptable uncertainties (i.e. a minimum is found inside the parameters definition range also considering their uncertainties). Usually both the high energy photon index () and are well constrained ( typical errors of about 0.1 for the spectral index and 0.15 keV for the break energy while ) and are affected by larger – but still acceptable uncertainties (about 0.2 and 50%, respectively) (see Tab. 2). For all the 7 events the improvement of the ABP fit with respect to the AP one yields at least a 90% significant improvement.
In 8 cases (i.e. GRB 050318, GRB 050401, GRB 050416A, GRB 050922C, GRB 060614, GRB 060908, GRB 070110, GRB 071003) the ABP model is not preferred to the AP one, either because is equal to within their errors or results outside the considered energy range.
In 5 GRBs (i.e. GRB 060124, GRB 060206, GRB 061121, GRB 050730, GRB 060418) although the of the ABP model is lower than that of the AP model, the improvement of the fit is not statistically significant.
We re-analysed the spectra of these 5 events assuming an ABP model with 4 parameters, namely with frozen to the value estimated from assuming that the – relation reported by Schady et al. (2007) (their Eqs. 1, 2 or 3). For each burst we choose the conversion corresponding to the extinction curve adopted to obtain the from the analysis of its optical SED.
In Tab. 3 we report the best X–ray spectral fit parameters values for these 5 events and the related . For all of these events we obtain a good fit to the data with values close to unity like in the AP case.
As the AP parameters are no more a subset of the parameters of this model (i.e. they are not nested models) the does not provide statistical information on the fit improvement (e.g. Protassov et al. 2002).
No a priori relation between and was assumed and the extremely hard obtained for GRB 061121 and GRB 060418 cannot be easily accounted for by the standard emission processes. Given the uncertainties in the inferred , we then fixed or constrained the value of in two ways, assuming: i) the relation ; ii) . In both cases the best fit returns the same value. For GRB 061121 the derived columns are cm-2 () and cm-2 (), while for GRB 060418 cm-2 () and cm-2 (). We conclude that for these two bursts the data cannot robustly constrain the low energy spectral slope as an acceptable fit can be obtained for not so extreme values of . The column densities obtained in these cases are intermediate between the ones obtained through the ABP and the AP models, in agreement with what found by Schady et al. (2007) when assuming .
| GRB | (dof) | prob | |||||
|---|---|---|---|---|---|---|---|
| cm-2 | keV | ||||||
| 050802 | 0.55 | 0.60.6 | 0.58 | 1.64 | 0.950.12 | 0.99 (157) | |
| 050820A | 2.612 | 2.2 | 0.63 | 1.05 | 1.000.07 | 0.947 (141) | |
| 060210 | 3.91 | 4. | 0.59 | 1.15 | 1.120.07 | 0.99 (183) | |
| 060729 | 0.54 | 0. | 0.53 | 1.13 | 1.040.04 | 0.97 (288) | |
| 061007 | 1.26 | 3.0 | 0.02 | 0.80 | 0.860.02 | 1.02 (478) | |
| 061126 | 1.1588 | 1.7 | -0.16 | 1.05 | 0.740.08 | 1.056 (141) | |
| 080319B | 0.937 | 0.7 | 0.49 | 1.14 | 0.810.01 | 1.27 (608) |
| GRB | (dof) | |||||
|---|---|---|---|---|---|---|
| cm-2 | keV | |||||
| 050730 | 3.967 | 0 | 0.36 | 1.00 | 0.75 | 1.22 (94) |
| 060206 | 4.045 | 0 | 0.03 | 0.63 | 1.23 | 0.98 (86) |
| 060124 | 2.296 | 0 | 0.47 | 1.27 | 1.05 | 0.81 (106) |
| 060418 | 1.489 | 0 | -0.23 | 0.79 | 0.81 | 0.85 (90) |
| 061121 | 1.314 | 1.44 | -0.89 | 0.79 | 0.89 | 0.88 (120) |
3.3 Discussion on the X–ray spectral analysis
The breaks that we have found are all in the range between 0.6 and 1.6 keV. This is likely due to the fact that the peak of the effective area of the Swift-XRT is 1.5 keV and it is therefore easier to find a spectral break when it falls around this energy. A break at keV is hardly detectable and therefore we cannot exclude its presence in most of spectra. Also a break at keV can not be easily detectable with the available late time X–ray spectra but we expect in this case to obtain a quite hard spectrum fitting with an AP model (i.e. a single power law spectral index with a value similar to the obtained ). Since the values of reported in Tab. 1 are usually not so hard we do not expect we are missing a large number of keV breaks.
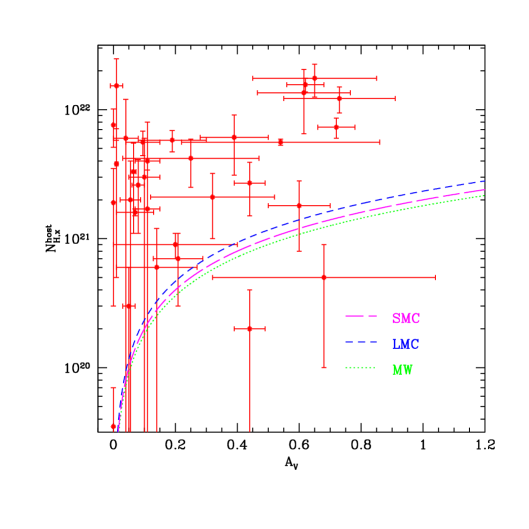
It has been already pointed out (e.g. Galama & Wijers 2001, Stratta et al. 2004, Schady et al. 2007, Starling et al. 2007, Watson et al. 2007) that the derived from the fit of the X–ray spectra are usually quite large (up to a few cm-2). On the other hand the values inferred for host galaxy dust reddening are usually small. This is true also for the GRBs in our sample as shown in Fig. 1.
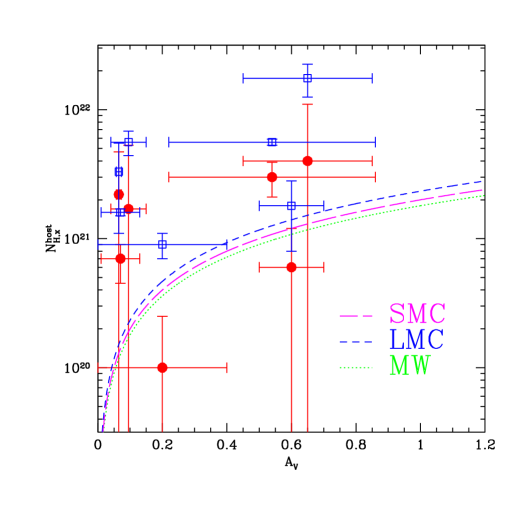
From the observational point of view the large derived from the fitting of the X–ray spectrum corresponds to a deficit of counts below approximately 1 keV with respect to the extrapolation of a single power–law model. In principle, this deficit could instead be due to an intrinsically curved or a broken power–law spectrum. For the 7 GRBs for which the ABP model gave a better fit (with respect to the AP model) we can check if the obtained values of are in agreement with the optical extinction assuming a vs. relation (e.g. Eqs. 1, 2 or 3 in Schady et al. 2007). . Fig. 2 shows the values of obtained with the ABP model fitting versus (filled circles). For comparison, also the values obtained with the AP model fitting (empty squares) are reported. The solid lines represent the Milky Way and Small Magellanic Cloud like relations as in Fig. 1. For 5 GRBs the uncertainties on are quite large, making these values consistent with zero, i.e. they must be considered as upper limits. These limits, always smaller than the values obtained with the AP model, are consistent with the observed . For the remaining 2 GBRs (GRB 060210 and 080319B) however the value of are still somewhat larger than what expected by the standard gas-to-dust relation, though clearly the disagreement with is less pronounced.
While the presence of an intrinsic break in the emitted X–ray spectrum can solve or mitigate the problem of an excess of with respect to the optical reddening for a fraction of events, this can not be considered as a general solution of this issue, on the basis of different indications.
As the excess is observed in a large fraction of GRBs, this would imply that the observed X–ray spectrum is almost always a broken power law, with a break in the rather narrow 0.5–1.5 keV energy range, even if the redshifts of these bursts are different.
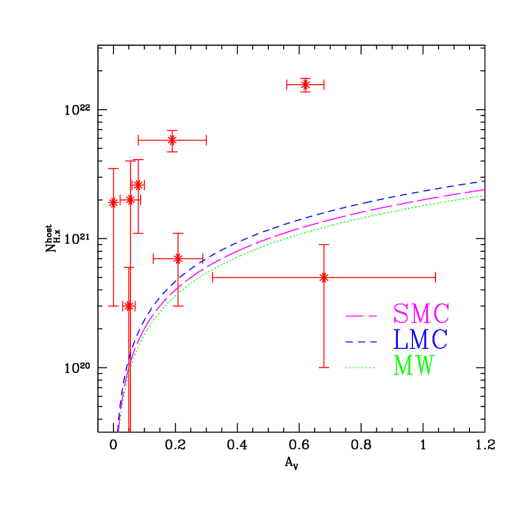
Furthermore we can directly exclude the presence of a spectral break inside the observed XRT spectrum for about half of the analysed events. In general, these events have an intermediate/high (when fitted with the AP model; see Fig. 3 compared to Fig. 2).
4 Optical to X–rays SEDs
In this section we present the broad band SEDs for the 7 events in which we found a break in the X–ray spectrum to check whether the spectra, when extrapolated to lower frequencies, are consistent with the available optical photometry at the same epoch. Then the optical to X–ray SED information will be combined with the results on the decomposition of the light curves behaviour in two components, as suggested by G09.
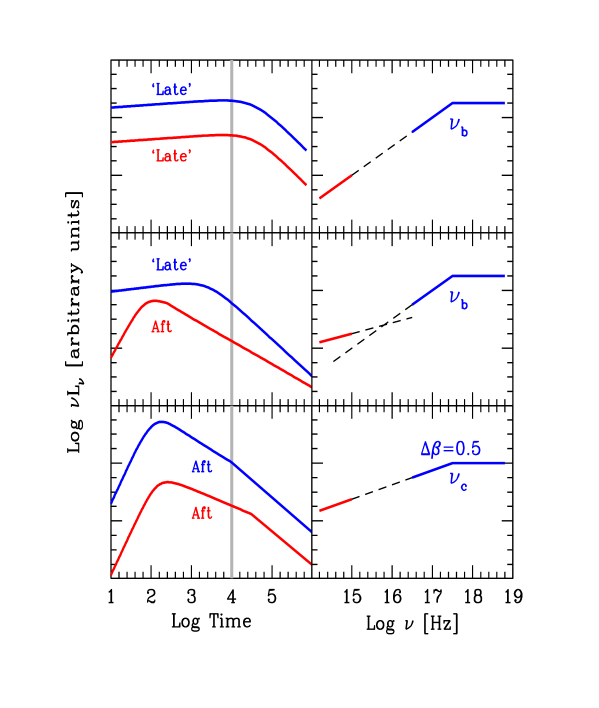
A key test of the two component light curve modelling by G09 is to verify whether the spectral properties at different times are consistent with what inferred by the light curve de-convolution. The 7 GRBs whose X-ray spectrum is consistent with the presence of a break in the X–ray band are the best candidates to perform the test as shown in fig. 4.
For each burst we select epochs where simultaneous optical photometry and XRT observations are available in order to use the most complete spectral information available and to avoid (if possible) flux extrapolations. This limits the number of optical to X–ray SED considered.
The X–ray spectrum is extracted from a time interval around the selected epoch in order to have at least 50 energy bins and it is re–normalised to the 0.3–10 keV flux obtained from the light curve. The spectral index plotted in the SEDs are the ones reported in Tab. 2. As done in G09 we used the light curves from the Swift repository (see Evans et al. 2009). The counts to flux conversion instead was done using the values from our broken power law spectral fits. When the optical and X–ray bands light curves track each other, i.e. they are dominated by the same component, one single SED is considered; when instead they show different temporal behaviours we considered more SEDs to test the modelling at different phases of the evolution of the two components.
In the following we present the results for 6 of the 7 GRBs separately. The complexity of the remaining one (i.e. GRB 080319B) prompted us to discuss it in the details in a dedicated paper (Nardini et al. 2009 in preparation). We anticipate that no event shows an optical to X–rays SED that is inconsistent with the presence of a break in the XRT band and the two component interpretation.
4.1 GRB 050802
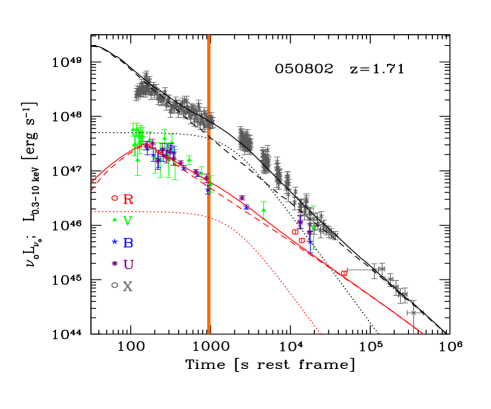
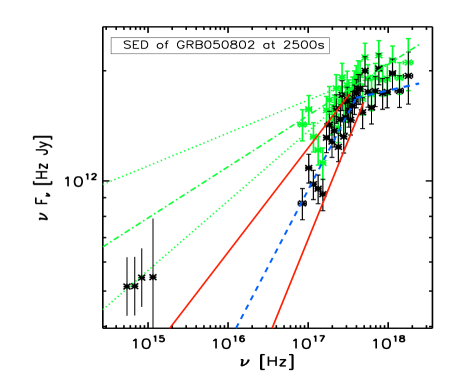
The dashed and solid lines show respectively the best fit (with the ABP model) to the X–ray spectrum (the spectral parameters are reported in Tab. 2) and the uncertainties on the slope of the low energy spectral index . The dotted line shows the best fit (with the AP model) to the X–ray spectrum.
The optical light curve photometric data are mainly from Oates et al. (2007) together with later time band data from GCNs (Pavlenko et al. 2005, Fynbo et al. 2005). The Swift UVOT filters uvm2 and uvw2 are strongly affected by Ly dumping and are not considered. The X–ray light curve has been modelled as the combination of “standard afterglow” emission dominating at early and at late times (before 700 s and after about 10 ks, rest frame) and “late prompt” emission dominating in between. The “standard afterglow” component instead describes the evolution of the optical flux during the whole period of the follow up (see Fig. 5).
We extracted the optical to X–ray SED around an observed time of 2500s (920 s rest frame) when the optical light curve is dominated by the standard afterglow and “late prompt” emission is becoming predominant in the X–rays. The X–ray spectrum represented in Fig. 5 has been extracted in the time interval reported in Tab. 1. Schady et al. (2007) estimated a non negligible host galaxy dust absorption () on the basis of a Milky Way extinction curve and assuming a power–law spectrum connecting the optical and X–ray bands. By considering the optical bands alone we find a similar with an optical spectral index .
The SED, plotted in Fig. 5, is consistent with the optical and the X–ray emission being dominated by different components (note that also Oates et al. 2008 and de Pasquale et al. 2009 found a similar inconsistency) with a spectral break falling in the observed XRT energy range, as indeed obtained from the X–ray spectral analysis. Note that the X–ray spectra shown in this section have been “de-absorbed” both for the galactic and the host frame (when present) contributions.
4.2 GRB 050820A
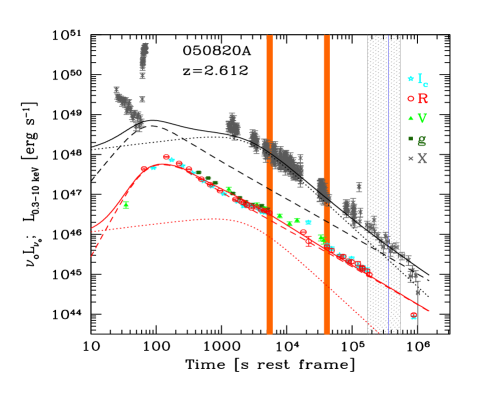
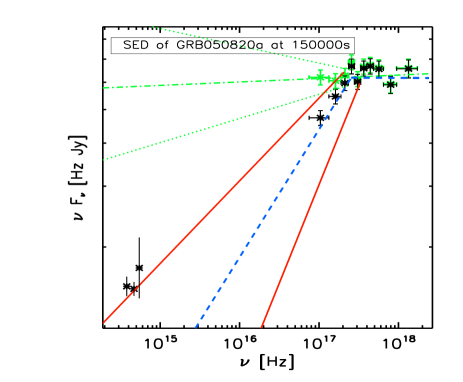
The photometric data are from Cenko et al. (2006a, 2009). Swift/BAT triggered on a precursor about 200 s before the main event (Cenko et al 2006a, Burlon et al. 2009). Our reference time is set at the trigger time and we do not consider the prompt X–ray emission detected before the end of the main –ray event. The X–ray light curve is dominated by the “late prompt” component up to 200 ks (720 ks in the observer frame), and by a “standard afterglow” component after then. The “standard afterglow” emission instead prevails during the entire duration of the optical light curve but in a time interval around 5 ks (18 ks observer frame) where its contribution becomes comparable with the “late prompt” one (see Fig. 6).
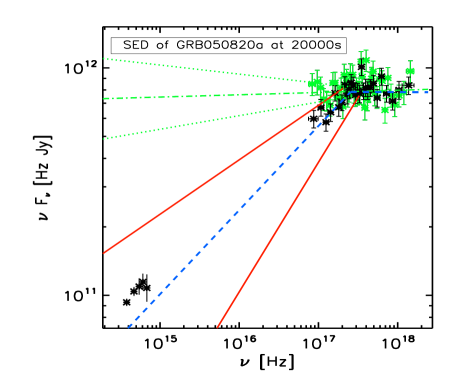
We extracted two SEDs in order to test the modelling at two different light curve phases. The first one at about 20 ks in the observer frame ( 5500 s rest frame) where the “late prompt” gives the maximum contribution in the optical light curve and the available photometry is richer (, , , and bands). Cenko et al. (2006a) estimated a with negligible host galaxy dust absorption while Kann et al. (2009) inferred an . We used the latter estimate and obtained . This first SED is plotted in Fig. 6 and shows that the optical flux lies slightly above the extrapolation of the broken power law that best describes the XRT spectrum, but as the uncertainties on are quite large the optical flux is fully consistent with the extrapolation. In this SED the X–ray data are extracted from the time interval reported in Tab.1.
As mentioned at 5500 s (rest frame) the optical flux is due to a similar contribution of the “standard afterglow” and the “late prompt” component. The the cooling frequency is already redward of the considered optical bands and the “standard afterglow” has (corresponding to an emitting particle distribution with slope ). In the “late prompt” component modelling, the low energy spectral index is instead (see Eq. 3 in G09), consistent within errors with . The intermediate value of the observed optical slope is thus consistent with the predictions of the two component modelling.
We considered a second SED at about 150 ks after the trigger (observer frame, corresponding to 41 ks rest frame). The plotted X–ray data are from the time integrated spectrum of the complete second XRT observation. In this phase the X–ray light curve is dominated by the “late prompt” while the “standard afterglow” dominates the optical emission. The combined SED is plotted in the bottom panel of Fig. 6 and confirms the proposed scenario: the optical data are at this time much brighter than what predicted by the extrapolation (with slope ) of the X–ray spectrum to the optical bands . Even though at these late times there are only 3 available photometric points (, and band) and the band flux is affected by a large error, the optical SED is well fitted by a softer that is closer to the value predicted for the “standard afterglow” component.
4.3 GRB 060210
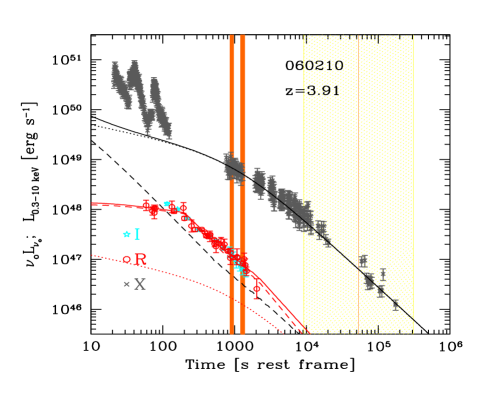
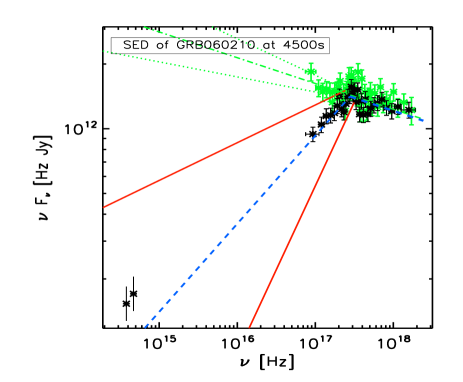
The optical afterglow has been observed in the and bands (photometric data from Curran et al. 2007), while, because of the high redshift, smaller wavelengths bands are not observable due to the Ly limit. The X–ray light curve shows an intense flaring activity at early times and it is dominated by the “late prompt” component at later times. The optical light curve is sampled only up to 2000 s rest frame ( 9800 s observer frame) and is dominated by the “standard afterglow” emission, as shown in Fig. 7. Since fluxes in only two optical bands are available it is not possible to infer the value of from the optical photometry. Curran et al. (2007) found a very soft observed spectrum, after correction for Galactic extinction and Ly absorption: the optical spectral index at 5000 s (observer frame). Assuming that the optical and X–ray emission are produced by the same mechanism they inferred two possible values of the host galaxy dust extinction, assuming either a single or a broken power–law joining the optical and the X–ray data.
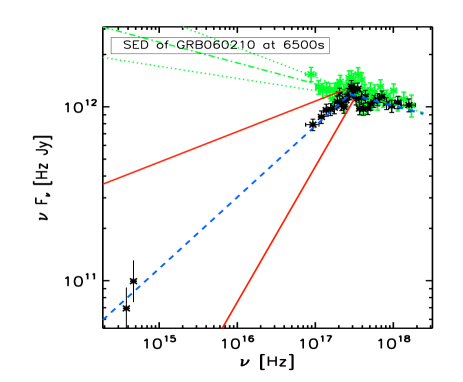
We extracted 2 SEDs at 4500 and 6500 s
(observer frame; see Fig. 7). In both SEDs the X–ray data are extracted from the time interval reported in Tab. 1.
In the two component modelling the optical and X–ray emission would be due to different
components, to account for their different temporal behaviours.
Thus cannot be inferred from the optical to X–rays SED. This argument, together with the fact that only 2 optical bands have been sampled, does not allow a direct dust absorption estimate, therefore we do not have constraints also on the optical spectral index. If the optical emission is produced by a standard afterglow mechanism, we can choose as an example a value of .
If we assumed a then . Since only two optical bands are available, the uncertainties are very large but since this value is
similar to the mean Small Magellanic Cloud–like obtained by Curran et al. (2007)
in the broken power–law case the latter value is used in the correction applied to the plotted SEDs. The large error on , and
the paucity of photometric data do not allow to draw any firm conclusion on
this burst.
The large uncertainties on the optical to X–ray SED at 4500 and 6500 s (observer frame), and the choice of the same used by Curran et al. (2007) make them consistent with an unique broken–power law but the presence of two components cannot be excluded.
No break is observed in the X–ray light curve. In particular, one can estimate the expected jet break time if the GRB was to follow the so called “Ghirlanda relation” (Ghirlanda et al. 2007). However the lack of evidence for such a break is consistent with the light–curve modelling as the X–ray flux is indeed dominated by the “late prompt” emission at the time when the jet break is expected. No data are available at such a time in the optical band where such a break should have been detectable, due to the dominance of the “standard afterglow” component.
In conclusion, the poor optical photometry of GRB 060210 does not allow to obtain an estimate of both and . This fact, together with the quite large errors in the estimate, does not allow to infer firm conclusions on this GRB. The diversity of the optical and X–ray temporal behaviour and the lack of jet break in the late time X–ray observations prompt us to model the light curves as due to different components. The optical to X–ray SEDs cannot give better constraints to the model since within errors are consistent with both having one or two separate components.
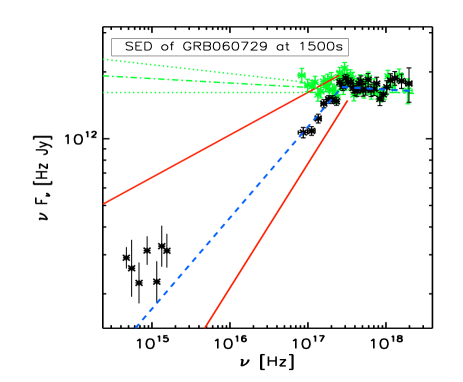
4.4 GRB 060729
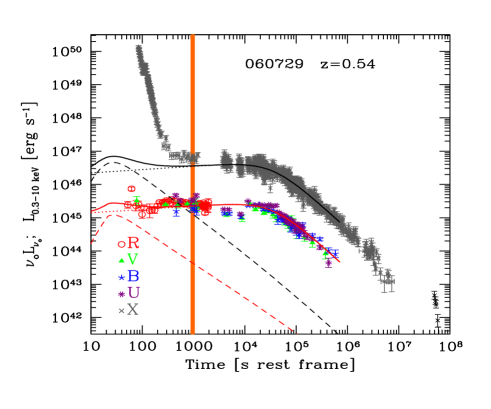
The UVOT data in 6 filters are from Grupe et al. (2007) while the ROSTE band photometry is from Rykoff et al. (2009).
After a steep decay in X–rays for about 400 s, the optical and X–rays light curves track each other and are characterised by a long lasting ( 50 ks) shallow decay phase. Following an achromatic break, a steeper flux decay phase is observed in X–rays up to about s after the burst (Grupe et al. 2009). The light–curves are dominated by the “late prompt” component with no significant evolution of the optical to X–ray flux ratio as can be seen in Fig. 8. As a consequence, the optical to X–ray SED is not expected to evolve in time.
The bottom panel of Fig. 8 shows that the optical flux at about 1500 s is indeed consistent with the extrapolation to the optical band of the broken power law X–ray spectrum. The SED does not require any additional host galaxy dust absorption and the poorly constrained optical spectral index is consistent within errors with . The quality of the optical–UV SED is not good enough to directly constrain the .
It would be possible to consider SEDs at later times based on the UVOT data (the band photometry covers only the first XRT orbit). However since neither the optical to X–ray flux ratio nor the colour significantly evolve we present here only the most complete SED at 1500 s. In this case the plotted X–ray spectrum is extracted from the first two PC mode orbits excluding the first 150 s of the first orbit in order to avoid the contribution of the steep decay phase.
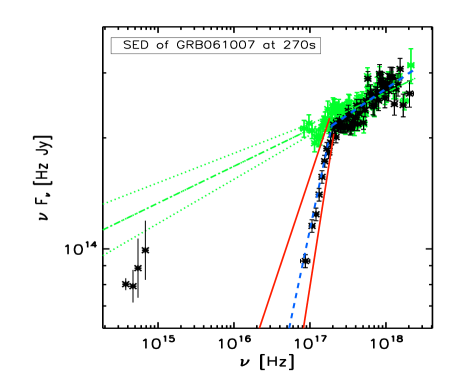
4.5 GRB 061007
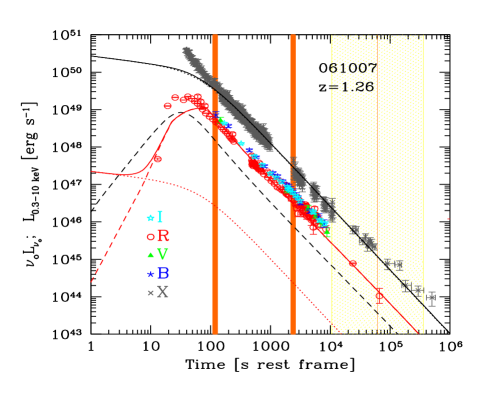
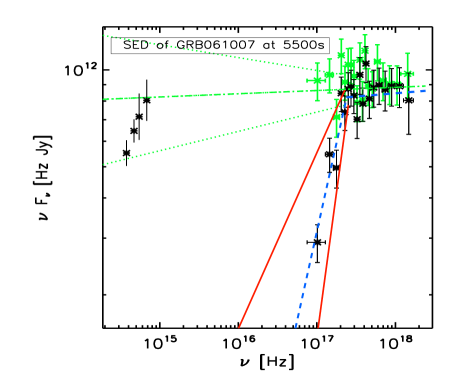
The photometric data are from Mundell et al. (2007) (, , and bands) and Rykoff et al. (2009) (ROTSE band). After a steeper flux decay lasting about 90 s (rest frame), the X–ray light curve declines following a single power–law for the whole observed time. The optical flux instead shows a fast rise ( by about 2 orders of magnitude) in the first 40 s followed by a simple power–law decay up to about 60 ks rest frame (see Fig. 9). The first band fluxes are simultaneous with the –ray prompt emission, and the rise between the first and second detection is faster than , hardy explainable with any standard emission mechanism.
In the two component modelling the optical light curve (after the end of the prompt phase, i.e. 50s in the rest frame) is dominated by the “standard afterglow” emission. The single power–law X–ray decay phase after the end of the –ray detection would be dominated by the “late prompt” component. Thus the X–ray and optical fluxes would be dominated by two different components, despite the similarity of the light curves after 100 s (rest frame), requiring a hard “late prompt” in order for this emission not to significantly contribute to the observed optical flux.
The optical fluxes have been corrected for a host galaxy dust extinction (Kann et al. 2009). We considered two SEDs at the times where all of the four photometric bands are simultaneously available: the first one at about 270 s (observed frame), immediately after the beginning of the simple power–law X–ray decay, and the second one at about 5.5 ks (observed frame). The X–ray data in the latter SED are extracted from the first two orbits in PC mode while the ones plotted in the first SED are extracted from the time interval reported in Tab. 1. In both cases the hard found with the broken power law fitting (see Tab. 2) implies a negligible contribution of the X–ray component in the optical band, supporting the proposed interpretation as can be seen from the middle and bottom panels of Fig. 9.
The X–ray light curve does not show any slope variation in correspondence to the expected jet break time obtained in the assumption that the GRB follows the “Ghirlanda relation”. Once again this is in agreement with the “late prompt” dominated nature of the X–ray flux. The jet break should instead be visible in the optical, but unfortunately there are no observations after 150 ks (observer frame) to confirm or rule out this prediction.
The early time optical to X–ray SEDs of GRB 061007 has been analysed also by Schady et al. (2007b) and by Mundell et al. (2007). They extracted the SED around 600 and 300 s observer frame after trigger respectively and they found these SEDs to be well fitted by a single power-law. As can be seen in fig. 9, the optical fluxes at 270 s (observer frame) are consistent with an extrapolation of a single power law fit of the X–ray spectrum. Their single power law X–ray fits give results consistent with the ones presented in tab. 1. In this paper we consider also the broad band SED of GRB 061007 at later times. The bottom panel of fig. 9 shows that after 5 ks the optical fluxes are no more consistent with an extrapolation of the X–ray data single power law fit and the two component scenario that we considered in the light curve modelling is in good agreement with both the early and late time SEDs.
4.6 GRB 061126
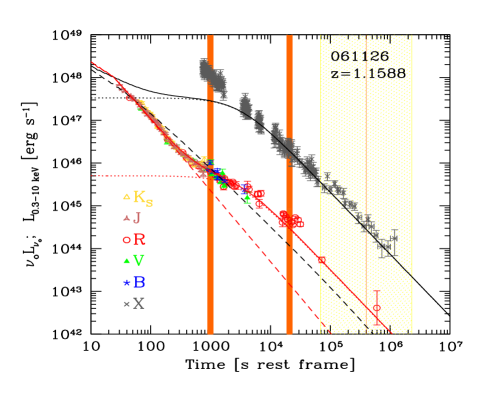
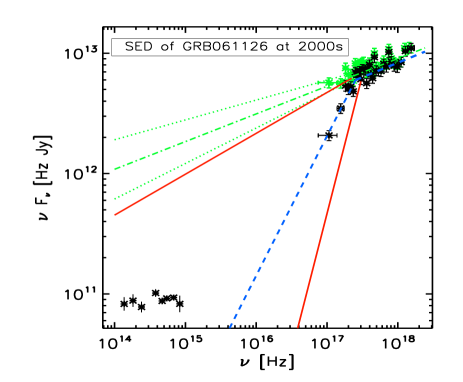
A very rich photometric sampling is available for GRB 061126 (Perley et al. 2008, Gomboc et al. 2008). After a steeper decay the X–ray light curve follows a single power–law flux decay for the whole observed time. The IR–optical–UV light curve instead shows a more complex behaviour, as shown in Fig. 10.
We modelled the power–law decay of the X–ray light curve as a “late prompt” component. The optical bands is accounted for by a sudden transition from a “standard afterglow” dominated early time to a “late prompt” dominated late time behaviour. If correct, this scenario would imply a spectral evolution from a two components to a single component optical–to–X–ray SED. We would also expect an evolution of at the time of transition between the two components.
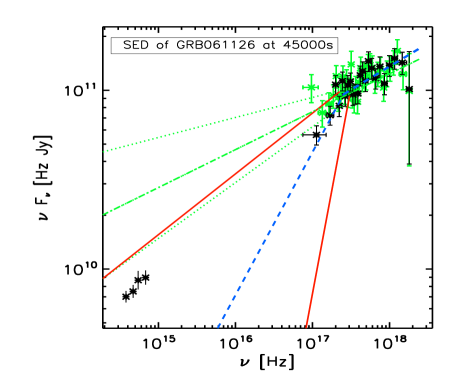
We extracted two SEDs, plotted in the middle and bottom panels of Fig. 10. The first one (middle panel) corresponds to 2000 s (observer frame) and is obtained using 8 contemporaneous photometric bands (, , , , , , , and ). The X–ray data are extracted from the time interval reported in Tab. 1. At this time the optical spectrum is well fitted by a single power law with , and no host galaxy dust absorption is required. This is in agreement with the findings by Perley et al. (2008). The optical spectrum slope is inconsistent with the X–ray spectrum. We examined a second SED at 45 ks (observer frame; bottom panel of Fig. 10) when both the optical and X–ray light curves are dominated by the “late prompt” component. The plotted X–ray data are extracted from the time integrated spectrum of the second XRT observation. At that time only 4 optical bands are available (, , and ), and the spectrum is still well fitted by a single power–law without host galaxy dust absorption, but the spectral index is harder than at earlier times (i.e. ). The bottom panel of Fig. 10 reveals that not only the optical fluxes but also the optical slope are now consistent with the extrapolation from the X–rays (with slope .
As predicted by the light curve modelling, the optical spectral index evolves after the transition from standard afterglow to late prompt emission, with the SED becoming consistent with a single dominating component.
We can contrast our interpretation with the alternative one proposed by Gomboc et al. (2008), who suggested that the presence of some dust absorption at early times could account for the optical spectrum being consistent with a broken power–law optical–to– X–ray SED. At later times the SED could be fitted with a similar broken power–law but without the need of any host galaxy dust absorption. Thus in the Gomboc et al. (2008) scenario a change in dust absorption would be required to interpret the optical spectral and broad band SED evolution.
Also for this burst we can evaluate the expected jet break time in the hypothesis that the GRB follows the “Ghirlanda relation”. However, at the corresponding epoch both the optical and X–ray emission are dominated by the late prompt contribution and thus no jet break would be observable. This is indeed in agreement with the absence of a break in the observed light curves, although the observations end soon after the predicted jet break time.
5 Conclusions
We analysed the Swift XRT data of a sample of 33 long GRBs selected by G09 to have known redshift, published estimate of the host galaxy dust absorption and good XRT and optical follow up.
If the XRT 0.3–10 keV spectra are modelled as a single power law, we confirm that the host frame column densities are rather large when compared to the values of the host galaxy dust absorption inferred from the optical analysis, according to “standard” extinction laws (see also Schady et al. 2007, Stratta et al. 2004).
For the 15 brightest bursts we could model the X–ray data with a broken power law, and in 7 cases we find evidence of a spectral break (90% confidence level). In such cases the required is in turn smaller than for the single power–law fitting and is marginally consistent with the column estimated by the optical extinction. However, in other 8 bright GRBs the X–ray spectrum does not show any break and some of them do require a large value of . Therefore the presence of an intrinsic curvature in the spectrum cannot be considered as a general solution for the “excess” of commonly found in GRB X–ray spectral analysis.
In order to test the interpretation by G09 that the X-ray and optical light curve complex behaviour can be interpreted as due to the contributions to the emission by two different components, we combine the results of the light curve de-convolution with the X–ray and broad band spectral properties at different times.
In particular we checked whether the presence of a break in the XRT spectra is consistent with what has been observed in the optical bands by studying the time dependent optical to X–rays SEDs of the GRBs for which a spectral break was found.
We found that 7 of the 8 events are consistent with the presence of a break in the XRT spectra and the evolution of the broad band SEDs appears to support the predictions of the two components scenario, even in the presence of complex light curve behaviours. In one case (i.e. GRB 060210), the quality of the data does not allow us to solve the ambiguity between the temporal and spectral analysis.
Consistency is also found in relation with the (lack of) evidence for jet breaks in the light curves, whose break time is estimated by assuming that the Ghirlanda relation holds for all GRBs (Ghirlanda et al. 2007). Indeed light curves are observed to steepen in correspondence with the jet break time only when the light curve is dominated by the “standard afterglow” emission while no break is detected if the other component is dominating.
Further testing of the two–component modelling requires to extend the simultaneous multi–band optical follow–up at later times (i.e. several days after the trigger), when the typical expected band magnitudes are around 24–25. Such an intensive and long lasting multi–band follow up could allow us: i) to search for possible optical spectral index evolution when a different component becomes dominant (as in the case of GRB 061126); ii) to test for the presence (absence) of jet breaks in “standard afterglow” (“late prompt”) dominated optical light–curves in a larger sample of events, presumably shedding light also on the jet geometry and energetics.
6 Acknowledgements
We would like to thank Fabrizio Tavecchio for useful discussions and the anonymous referee for his interesting comments and suggestions. We acknowledge ASI grant I/088/06/0. MN and AC also acknowledge the MIUR for partial financial support. This work made use of data supplied by the UK Swift Science Data Centre at the University of Leicester.
References
- [] Berger E., Gladders M., Oemler G., 2005a, GCN, 3201
- [] Berger E., Gladders M. & Oemler G., 2005b, GCN, 3201
- [] Berger E. & Gladders M., 2006, GCN, 5170
- [] Bloom J.S., Foley R.J., Koceveki D. & Perley D., 2006, GCN, 5217
- [] Bloom J. S., Perley D., Chen H. W., 2006, GCN, 5825
- [] Bloom J. S. et al., 2009, ApJ., 691, 723
- [] Burlon D. et al., 2009, ApJ, 685, L19
- [] Butler N.R. & Kocevski D., 2007, ApJ, 663, 407
- [] Cenko S. B., Kulkarni S. R., Gal-Yam A., Berger E., 2005, GCN, 3542
- [] Cenko S. B. et al., 2006a, ApJ, 652, 490
- [] Cenko S. B., Berger E., Cohen J., 2006b, GCN, 4592
- [] Cenko S. B. et al., 2009, ApJ, 693, 1484
- [] Chen H. W., Thompson I., Prochaska J. X., Bloom J., 2005, GCN, 3709
- [] Covino S. et al., 2008, MNRAS, 388, 347
- [] Cucchiara A., Fox D. B., Berger E., 2006, GCN, 4729
- [] Curran P. A. et al., 2007, A&A, 467, 1049
- [] Curran P. A., Starling R.L.C., van der Horst A.J., & Wijers R.A.M.J., 2009, MNRAS, 395, 580
- [] De Pasquale M. et al., 2007, MNRAS, 377, 1638
- [] De Pasquale M. et al., 2009, MNRAS, 392, 153
- [] Ellison S. L. et al., 2006, MNRAS, 372, L38
- [] Evans P.A., Osborne J.P., Burrows D.N., & Barthelmy S.D., 2008, GCN, 7955
- [] Evans P.A., Beardmore A.P., Page K.L., et al., 2009, MNRAS submitted (arXiv:0812.3662v1)
- [] de Ugarte Postigo A. et al., 2007, A&A, 462, L57
- [] Dickey J.M., & Lockman F.J., 1990, ARA&A, 28, 215
- [] Foley R. J., Chen H. W., Bloom J., Prochaska J. X., 2005, GCN, 3483
- [] Fox D. B., Berger E., Price P. A., Cenko S. B., 2007, GCN, 6071
- [] Fugazza D., D Avanzo P., Malesani D., 2006, GCN, 5513
- [] Fynbo J.P.U., Hjorth, J., Jensen, B.L., Jakobsson P., Moller P. & Näränen J., 2005a, GCN, 3136
- [] Fynbo J.P.U., Jensen, B.L., Hjorth, J. et al., 2005b, GCN, 3176
- [] Fynbo J. P. U. et al., 2005c, GCN, 3749
- [] Fynbo J. P. U. et al., 2005d, GCN, 3874
- [] Fynbo J. P. U. et al., 2005e, GCN, 3756
- [] Fynbo J.P.U., Limousin M., Castro Cerón J.M., Jensen B.L. & N’́ar’́anen J., 2006a, GCN, 4692
- [] Fynbo J. P. U. et al., 2006b, GCN, 5651
- [] Galama T. J., Wijers R. A. M. J., 2001, ApJ, 549, L209
- [] Gehrels N. et al., 2004, ApJ, 611, 1005
- [] Ghirlanda G., Nava L., Ghisellini G., Firmani C., 2007, A&A, 466, 127
- [] Ghisellini G., Ghirlanda G., Nava L., & Firmani C., 2007, ApJ, 658, 75
- [] Ghisellini G., Nardini M., Ghirlanda G., & Celotti A., 2009, MNRAS 393, 253
- [] Godet O., Beardmore A.P., Abbey A.F., et al., 2009, A&A, 494, 775
- [] Gomboc et al., 2008, ApJ, 687, 443
- [] Grupe D. et al., 2007, ApJ, 662, 443
- [] Holland S. T. et al., 2007, AJ, 133, 122
- [] Jakobsson P., et al., 2006, A&A, 460, L13
- [] Jaunsen A. O., Malesani D., Fynbo J. P. U., Sollerman J., Vreeswijk P. M., 2007, GCN, 6010
- [] Kalberla P.M.W., Burton W.B., Hartmann D., Arnal E.M., Bajaja E., Morras R., & Pöppel W.G.L., 2005, A&A, 440, 775
- [] Kann D.A., Klose S., & Zeh A., 2006, ApJ, 641, 993
- [] Kann D.A., Klose S., Zhang B. et al., 2009, ApJ submitted (2007arXiv0712.2186K)
- [] Mangano V. et al., 2007, A&A, 470, 105
- [] Misra K., Bhattacharya D., Sahu D.K., Sagar R., Anupama G.C., Castro-Tirado A.J., Guziy S.S. & Bhatt B.C, 2007, A&A, 464, 903
- [] Moretti A., Campana S., Mineo T., et al., 2005, SPIE, 5898, 360
- [] Mundell C. G. et al., 2007, ApJ, 660, 489
- [] Nardini M., Ghisellini G., Ghirlanda G., 2006, A&A, 451, 821
- [] Nardini M., Ghisellini G., Ghirlanda G., 2008, MNRAS, 386, L87
- [] Nousek J. A. et al., 2006, ApJ, 642, 389
- [] Oates S. R. et al., 2007, MNRAS, 380, 270
- [] Osip D., Chen H. W., Prochaska J. X., 2006, GCN, 5715
- [] Page K. L. et al., 2007, ApJ, 663, 1125
- [] Panaitescu A., & Kumar P., 2000, ApJ, 543, 66
- [] Pandey S. B. et al., 2006, A&A, 460, 415
- [] Perley D. A., Chornock R., Bloom J. S., Fassnacht C., Auger M. W., 2007, GCN, 6850
- [] Perley D. A. et al., 2008a, ApJ, 672, 449
- [] Perley D. A., Bloom J. S., 2008a, GCN, 7406
- [] Perley D. A., Bloom J. S., 2008b, GCN, 7535
- [] Perna R., Lazzati D., & Fiore F., 2003, ApJ., 585, 775
- [] Price P.A., Berger E. & Fox D.B., 2006, GCN, 5275
- [] Prochaska J.X., Bloom J.S., Wright J.T., Butler R.P., Chen H.W., Vogt S.S. & Marcy G.W., 2005, GCN, 3833
- [] Prochaska J.X., Chen H.W., Bloom J.S., Falco E., Dupree A.K., 2006, GCN, 5002
- [] Prochaska J. X., Perley D. A., Modjaz M., Bloom J. S., Poznanski D., Chen H.-W., 2007, GCN, 6864
- [] Prochaska J. X., Murphy M., Malec A. L., Miller K., 2008, GCN, 7388
- [] Protassov R., van Dyk D.A., Connors A., Kashyap V.L., & Siemiginowska A., 2002, ApJ., 571, 545
- [] Rol E., Jakobsson P., Tanvir N., Levan A., 2006, GCN, 5555 Romano P.
- [] Romano P., Campana S., Chincarini G., et al. 2006, A&A, 456, 917
- [] Ruiz-Velasco A. E. et al., 2007, ApJ, 669, 1
- [] Rykoff et al., 2009, ApJ submitted ( arXiv:0904.0261v1)
- [] Schady P., et al., 2007, MNRAS, 377, 273
- [] Schady P., et al., 2007b, MNRAS, 380, 1041
- [] Starling R.L.C., Vreeswijk P.M., Ellison S.L., 2005, A&A, 442, L21
- [] Still M. et al., 2005, ApJ, 635, 1187
- [] Stratta G., Fiore F., Antonelli L. A., Piro L., & De Pasquale M., 2004, ApJ, 608, 846
- [] Thöne C.C., Levan A., Jakobsson P., et al., 2006 GCN, 5373
- [] Thöne C. C. et al., 2008, A&A, submitted (arXiv:0806.1182)
- [] Troja E. et al., 2007, ApJ, 665, L97
- [] Vaughan S. et al. 2006, ApJ, 638, 920
- [] Vreeswijk P. M., et al., 2007, A&A, 468, 83
- [] Vreeswijk P. M., Smette A., Malesani D., Fynbo J. P. U., Jensen B. M., Jakobsson P., Jaunsen A. O., Ledoux C., 2008, GCN, 7444
- [] Watson D., Fynbo J. P. U., Ledoux C. et al., 2006, ApJ, 652, 1011
- [] Watson D., Hjorth J., Fynbo J.P.U., Jakobsson P.,
- [] Sollerman J., & Wijers R.A.M.J., 2007, ApJ., 660, 101
- [] Zhang B. et al., 2006, ApJ, 642, 354
- [] Zhang B., 2007, Adv. Space Res., 40, 1186