Observation of hypertritons in Au+Au collisions at = 200 GeV
Abstract
We report preliminary results of observation in heavy-ion collisions at RHIC. We have identified 15730 candidates in the current sample containing Au+Au events at = 200 GeV. The production rate of is close to that of . No extra penalty factor is observed for , in contrast to results observed at the AGS.
1 Introduction
Hypernuclear physics opens a unique opportunity for the study of the hyperon-nucleon (YN) and the hyperon-hyperon (YY) interaction. A hypernucleus has a non-zero strangeness quantum number, and thus for nuclear spectroscopy, it provides one more degree of freedom than a normal nucleus containing only protons and neutrons. Information on the strangeness sector of the hadronic equation of state is crucial for understanding the structure of a neutron star. Depending on the strength of the YN interaction, a neutron star might be a hyperon star, or strange quark matter, or might have a kaon condensate at its core [1]. The lightest and simplest hypernucleus is the hypertriton (), consisting of a Lambda, a proton and a neutron. The hypernucleus was first observed in 1952 [2], while no anti-hypernucleus has been found yet.
The Relativistic Heavy-Ion Collider produces a system that consists of a large number of particles with high phase-space density, and with almost equal numbers of quarks and anti-quarks. This environment is uniquely suited for production of exotic nuclei, including hypernuclei, anti-nuclei, and anti-hypernuclei.
2 Analysis and Results
In this paper, we report STAR preliminary results on measurement in Au+Au collisions at =200 GeV. The signal candidates were reconstructed in the central TPC [3] and were identified via the secondary vertex of . Approximately minimum-bias (MB) trigger events and central trigger events from Au + Au data collected in the year 2004 run, and MB events in the year 2007 Au+Au run have been used in this analysis. Events were required to have a primary vertex position within 30 cm from the center of the TPC along the beam direction. Charged tracks were reconstructed in the STAR TPC for pseudorapidity with full azimuthal acceptance ().
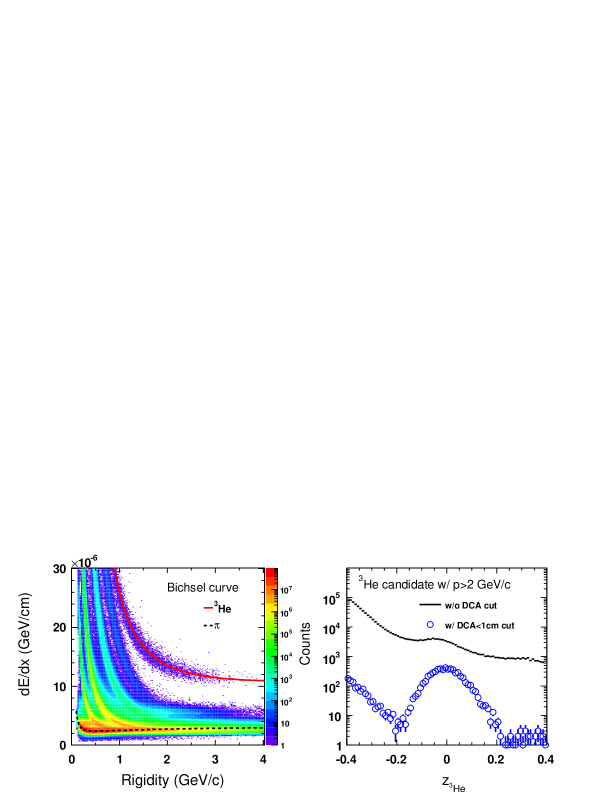
Particle identification is achieved by correlating the ionization energy loss of charged particles in the TPC gas with their measured magnetic rigidity (Fig 1, left panel). Since the distribution for a fixed particle type is not Gaussian, a new variable (, …) is useful in order to facilitate deconvolution into Gaussians for each particle species [4]. The is defined as , where is the expected value of for the given particle type [5]. We are only able to identify with larger momenta (i.e., GeV). Furthermore, the beam pipe causes contamination of the sample. Since most beam pipe knock-out are far away from the collision vertex, a cut on distance of closest approach to the collision vertex ( cm) reduces the background associated with the beam pipe. Fig 1 (right panel) shows the candidate distributions before and after the DCA cut. The condition with the 1-cm DCA cut are used in this analysis. The daughter pion from the decay usually has a relatively low momentum, and it can be cleanly identified with similar selection in our experiment (Fig 1, left panel) [4].
With both daughter candidates identified, we can reconstruct the signal through its weak decay topology. A set of topological cuts has been applied here in order to reduce the combinatorial background. The cuts include: DCA between and pion tracks ( cm), DCA of the candidate to the primary vertex ( cm), decay length of the candidate vertex from the collision vertex ( cm), and the DCA of the pion daughter to the primary vertex ( cm). The cuts were optimized based on a full detector response simulation [4]. The secondary vertex finding technique used in our experiment is essential for this rare particle search because it can reduce the background dramatically.
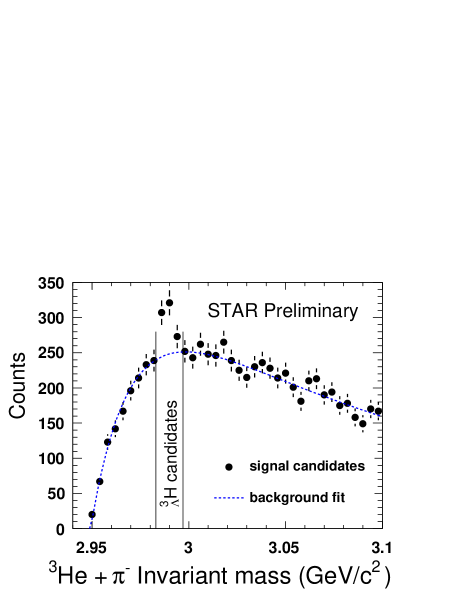
Fig. 2 shows the invariant mass distribution of with all cuts applied. The solid circles represent the signal candidate distribution while the dashed curve is the corresponding background distribution. The signal candidate invariant mass was calculated based on the momenta of the daughter candidates at the decay vertex: . The background distribution is produced by the event rotation method. Instead of directly subtracting the background from the data, we use a fitting function. Here we use a double exponential function: to fit the background distribution, where are fitting parameters. The signal is then counted after subtraction of the fitted rotated background. In total, 15730 candidates were found in the current data sample. A very similar analysis can be used to search for anti-hypertritons decaying to . Results of this search are reported elsewhere.
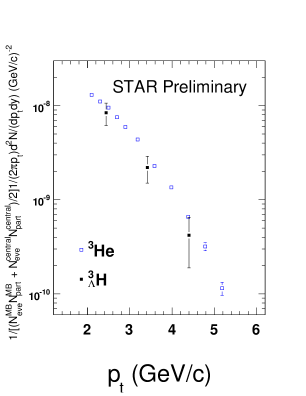
Fig. 3 shows the preliminary spectra together with the results in the same data set. The results are corrected for detector acceptance and tracking efficiency. Since we combine the MB and central trigger data for this analysis, we here normalize the invariant yield per event per participant pair: rather than the conventional number of total events: . We then compare the production rate with in our data. It is quite surprising to observe that their production ratio is close to unity. This is different from the value obtained at the AGS, where an extra penalty factor has been observed when introducing the strangeness degree of freedom in particle production [6]. It seems that our results cannot be solely due to the finite size effect as implied by AGS data [6]. In contrast, our measurements indicate that at RHIC, the strangeness phase space population is similar to that of light quarks.
3 Summary
In summary, we present preliminary measurements in Au+Au collisions at =200 GeV. We have collected signal candidates in the current statistics. Our measurement of the / ratio is consistent with the enhancement of strangeness production at RHIC.
References
- Lattimer and Prakash [2004] J. M. Lattimer, M. Prakash, Science 304 (2004) 536.
- Danysz and Pniewski [1953] M. Danysz, J. Pniewski, Phil. Mag. 44 (1953) 348.
- Anderson et al. [2003] M. Anderson, et al., Nucl. Instrum. Methods A 499 (2003) 659.
- Abelev et al. [2009] B. I. Abelev, et al., Phys. Rev. C 79 (2009) 034909.
- Amsler et al. [2008] C. Amsler, et al., Phys. Lett. B667 (2008) 1.
- Armstrong et al. [2004] T. A. Armstrong, et al., Phys. Rev. C 70 (2004) 024902.