The first broad-band X–ray study of the Supergiant Fast X–ray Transient SAX J1818.61703 in outburst
Abstract
The Supergiant Fast X–ray Transient (SFXT) SAX J1818.61703 underwent an outburst on 2009 May 6 and was observed with Swift. We report on these observations which, for the first time, allow us to study the broad-band spectrum from soft to hard X–rays of this source. No X–ray spectral information was available on this source before the Swift monitoring. The spectrum can be deconvolved well with models usually adopted to describe the emission from High Mass X–ray Binary X–ray pulsars, and is characterized by a very high absorption, a flat power law (photon index 0.1–0.5) and a cutoff at about 7–12 keV. Alternatively, the SAX J1818.61703 emission can be described with a Comptonized emission from a cold and optically thick corona, with an electron temperature =5–7 keV, a hot seed photon temperature, , of 1.3–1.4 keV, and an optical depth for the Comptonizing plasma, , of about 10. The 1–100 keV luminosity at the peak of the flare is 31036 erg s-1 (assuming the optical counterpart distance of 2.5 kpc). These properties of SAX J1818.61703 resemble those of the prototype of the SFXT class, XTE J1739–302. The monitoring with Swift/XRT reveals an outburst duration of about 5 days, similarly to other members of the class of SFXTs, confirming SAX J1818.61703 as a member of this class.
keywords:
X-rays: binaries - X-rays: individual (SAX J1818.61703)1 Introduction
Supergiant Fast X-ray Transients (SFXTs) are transient X–ray sources in binary systems composed of a compact object and a blue supergiant companion. Although some of them were discovered before the INTEGRAL satellite launch in 2002, this new class of High Mass X–ray Binaries (HMXBs) was recognized only after several new peculiar X–ray transients had been discovered as a result of the Galactic plane survey performed by INTEGRAL (Sguera et al. 2005, Negueruela et al. 2006). The members of this new class of sources (about 10, with 20 candidates) display apparently short outbursts (as observed with INTEGRAL ), characterized by a few hour duration flares and by a high dynamic range (1, 000–100, 000) between the quiescence (1032 erg s-1) and the flare peak (1036–1037 erg s-1). Spectral properties are very similar to those of High Mass X–ray Binary pulsars (Romano et al., 2008).
Their long-term X–ray properties have been investigated thanks to a monitoring campaign with Swift (still ongoing, see Romano et al., 2009b), which is unveiling several new properties of a sample of SFXTs. This Swift campaign has demonstrated that the SFXTs short flares are part of a longer outburst phase lasting days (Sidoli et al., 2009b) and they spend most of their lifetime in accretion at an intermediate level (1034 erg s-1), instead of staying in quiescence (as was previously thought; Sidoli et al. 2008). The actual mechanism responsible for the outbursts is still unknown (see Sidoli 2009 for a review of the different proposed scenarios).
SAX J1818.61703 is an X–ray source classified as a Supergiant Fast X-ray Transient because of its transient X–ray activity, its high dynamic range (Bozzo et al., 2008) and its association with a blue supergiant star located at 2.5 kpc (O9–B1 type, Negueruela & Smith 2006, Negueruela & Schurch 2007), thanks to the sub-arcsecond X–ray position obtained using (in’t Zand et al., 2006). SAX J1818.61703 was discovered with the Wide Field Cameras on board BeppoSAX (in’t Zand et al., 1998), and showed several more bright flares lasting 1–3 hours as observed with IBIS/ISGRI on board INTEGRAL (Grebenev & Sunyaev 2005, Sguera et al. 2005), reaching 200 mCrab at the flare peak (18–45 keV), and with ASM on board RXTE (Sguera et al., 2005). Further and more recent activity has been caught both by Swift/BAT (Barthelmy et al., 2008) and by INTEGRAL (Grebenev & Sunyaev, 2008). A periodicity (likely orbital) of 30-days was discovered (Bird et al. 2009, Zurita Heras & Chaty 2009) from the analysis of available Swift/BAT and INTEGRAL data, suggesting an eccentric orbit (0.3–0.4) and an outburst duration of around 4–6 days.
Here we report on the latest outburst from this source, observed with Swift starting on 2009 May 6 (Romano et al., 2009d). These Swift observations allow us to perform the first broad-band spectroscopy of this SFXT, simultaneously from soft to hard X–rays.
2 Observations and Data Reduction
SAX J1818.61703 triggered the Swift/BAT three times since the start of the mission, on 2007 October 16 at 04:20:16 UT (trigger 294385), on 2008 March 15 at 15:54:45 UT (trigger 306379, Barthelmy et al., 2008), and on 2009 May 6 at 14:03:27 UT (trigger 351323, Romano et al., 2009d). In the first two instances Swift did not perform a slew, so no narrow-field instrument (NFI) observations are available.
During the flare of 2009 May 6, the subject of this paper, Swift executed an immediate slew, so that the XRT began observing the field of SAX J1818.61703 about 132 seconds after the BAT trigger. The automated target (AT) observation lasted for one orbit (until approximately 2300 s after the trigger). Follow-up target of opportunity (ToO) observations for 10 ks were obtained by means of a Cycle 5 proposal (PI P. Romano; sequences 00031409001–005, see Table 1) and regular ToO observations (00031409006–010). The data cover the first 14 d since the beginning of the outburst.
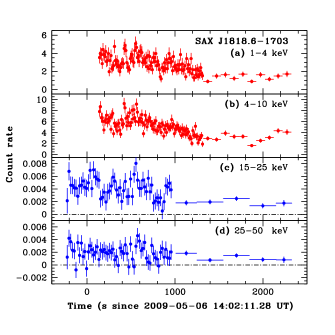
The BAT data were analysed using the standard BAT analysis software distributed within ftools. Mask-tagged BAT light curves were created in the standard 4 energy bands, 15–25, 25–50, 50–100, 100–150 keV, and rebinned to achieve a signal-to-noise (S/N) of 10 (see Fig. 1c, d). BAT mask-weighted spectra were extracted from event files over the time interval simultaneous with XRT/WT data (see Table 1) and were rebinned to a S/N of 3. Response matrices were generated with batdrmgen. For our spectral fitting (xspec v11.3.2) we applied an energy-dependent systematic error. Furthermore, survey data products, in the form of Detector Plane Histograms (DPH) with typical integration time of s, are available, and were also analysed with the standard BAT software.
The XRT data were processed with standard procedures (xrtpipeline v0.12.1), filtering and screening criteria by using ftools in the Heasoft package (v.6.6.1). We considered both WT and PC data, selected event grades 0–2 and 0–12, respectively (Burrows et al. 2005). We corrected for pile-up when appropriate by determining the size of the point spread function (PSF) core affected by comparing the observed and nominal PSF (Vaughan et al., 2006; Romano et al., 2006), and excluding from the analysis all the events that fell within that region. To account for the background, we also extracted events within source-free regions. Exposure maps were generated with the task xrtexpomap. Ancillary response files were generated with xrtmkarf, to account for different extraction regions, vignetting, and PSF corrections. We used the spectral redistribution matrices v011 in CALDB.
All quoted uncertainties are given at 90 % confidence level for one interesting parameter unless otherwise stated. The spectral indices are parameterized as , where (erg cm-2 s-1 Hz-1) is the flux density as a function of frequency ; we adopt as the photon index, (ph cm-2 s-1 keV-1). Times in the light curves and the text are referred to the trigger time.
| Sequence | Obs/Mode | Start time (UT) | End time (UT) | Exposure | Time since trigger |
|---|---|---|---|---|---|
| (yyyy-mm-dd hh:mm:ss) | (yyyy-mm-dd hh:mm:ss) | (s) | (s) | ||
| 00351323000 | BAT/event | 2009-05-06 13:58:16 | 2009-05-06 14:18:18 | 1202 | -239 |
| 00351323000 | BAT/survey | 2009-05-06 14:19:03 | 2009-05-06 14:57:42 | 1319 | 1, 008 |
| 00351323000 | XRT/WT | 2009-05-06 14:04:32 | 2009-05-06 14:24:15 | 1183 | 138 |
| 00351323000 | XRT/PC | 2009-05-06 14:24:17 | 2009-05-06 14:40:57 | 977 | 1, 322 |
| 00031409001 | XRT/PC | 2009-05-06 15:37:42 | 2009-05-06 23:44:34 | 9859 | 5, 728 |
| 00031409002 | XRT/PC | 2009-05-07 15:45:00 | 2009-05-07 18:02:12 | 4924 | 92, 565 |
| 00031409003 | XRT/WT | 2009-05-08 01:41:00 | 2009-05-08 17:44:02 | 168 | 128, 325 |
| 00031409003 | XRT/PC | 2009-05-08 01:41:11 | 2009-05-08 17:48:57 | 4782 | 128, 336 |
| 00031409004 | XRT/PC | 2009-05-09 03:13:50 | 2009-05-09 17:46:57 | 5919 | 220, 296 |
| 00031409005 | XRT/PC | 2009-05-10 06:30:43 | 2009-05-10 09:48:41 | 928 | 318, 508 |
| 00031409006 | XRT/PC | 2009-05-15 21:43:43 | 2009-05-15 21:54:58 | 665 | 805, 289 |
| 00031409007 | XRT/PC | 2009-05-16 13:30:33 | 2009-05-16 15:14:57 | 1083 | 862, 099 |
| 00031409008 | XRT/PC | 2009-05-17 20:24:37 | 2009-05-17 22:10:58 | 1783 | 973, 343 |
| 00031409009 | XRT/PC | 2009-05-18 15:34:27 | 2009-05-18 17:13:57 | 1722 | 1, 042, 332 |
| 00031409010 | XRT/PC | 2009-05-19 15:34:28 | 2009-05-19 17:20:57 | 1899 | 1, 128, 734 |
3 Results
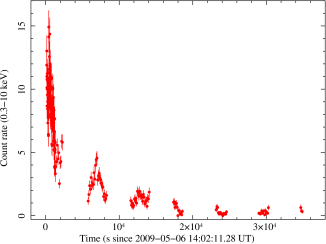
Fig. 1 shows the light curves during the brightest part of the outburst in different energy bands. While the BAT count rate was fairly constant throughout the AT observation, the XRT count rate shows a decreasing trend from a maximum of counts s-1 (in the 0.2–10 keV band, see Fig. 2) with several flares superimposed. The X-ray decreasing trend is even more evident in Fig. 2, which shows the XRT light curve in the 0.3–10 keV band on a linear scale throughout the first day (AT and GI ToO) of observations. The XRT decay time during the first day of the outburst can be fitted with an exponential function, with e-folding time, , of 3800 s. Note however that this gives only an idea of the general trend, on top of a lot of short term variability.
The XRT spectra of the first six temporal sequences reported in Table 1 have been analysed separately, to search for variability of the spectral parameters along the bright phase of the outburst. The remaining sequences only provided 3 upper limits. In Table 2 we report the spectroscopy results obtained when fitting the spectra with simple models, an absorbed power law or blackbody. More complex deconvolutions of the 1–10 keV spectra are not required by the data. No spectral variability is evident, within the large uncertainties.
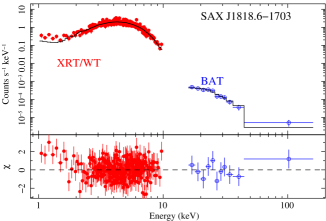
We extracted simultaneous BAT and XRT spectra, between 138 and 937 s since the BAT trigger and performed a joint fit in the 1–10 keV and 14–150 keV energy bands for XRT and BAT, respectively. A constant factor was included to allow for normalization uncertainties between the two instruments (always resulted within the usual range). The X–ray spectrum is highly absorbed (5–71022 cm-2) and is very well fit with models we already adopted to describe other SFXTs wide-band spectra (Sidoli et al., 2009a): power laws with high energy cutoffs (cutoffpl in xspec), or Comptonization models [Comptt (Titarchuk, 1994) or the bmc model (Titarchuk et al., 1996) in xspec]. The results of the broad-band spectroscopy are summarized in Table 3 (also see Fig. 3).
The bmc model is composed of a blackbody (BB) and its Comptonization and it is not limited to the thermal Comptonization case (Comptt) but also can account for dynamical (bulk) Comptonization due to the converging flow. The spectral parameters of the bmc model are the black-body (BB) color temperature, , the spectral index (overall Comptonization efficiency related to an observable quantity in the photon spectrum of the data), and the logarithm of the illuminating factor , (an indication of the fraction of the up-scattered BB photons with respect to the BB seed photons directly visible). In SAX J1818.61703 could not be constrained and was only determined with large uncertainties. Adopting the Comptt model, the properties of the Comptonizing corona could be constrained well with an an electron temperature 5–7 keV and an optical depth 10 (in a spherical geometry).
For the timing analysis we only used the XRT observations in which the source was significantly detected. After correcting the photon arrival times to the Solar system barycenter, we extracted the source events with the same selection criteria used for the spectroscopy. We searched each single dataset for coherent sub-orbital pulsations down to a minimum period corresponding to the Nyquist limit (3.532 ms and 5.0146 s for the data collected in WT and in PC modes, respectively) using the test (Buccheri et al., 1983), with the number of harmonics being varied from 1 to 4. The period search step size was chosen in each dataset in order to oversample the Fourier period resolution () by a factor of 5. No statistically significant signal was detected. The upper limit on the pulsed fraction (defined as the semi-amplitude of the sinusoidal modulation divided by the mean count rate), computed according to Vaughan et al. (1994), is 12 % at the 99 % confidence level and for periods between 3.5 ms and 200 s. In order to search for pulsed signals at long periods ( s), we analysed together all the data by computing a Lomb-Scargle periodogram (Scargle, 1982). Again, we did not detect any significant signal for periods up to 1000 s, with an upper limit on the pulsed fraction of about 25 % (at the 99 % confidence level).
4 Discussion
SAX J1818.61703 is one of the four SFXTs where a period, very likely of orbital origin, has been detected (Porb). Such periods have been so far determined either through observations of periodically recurrent outbursts [IGR J11215–5952, Sidoli et al. (2006), Romano et al. (2009c); Porb165 days] or through a timing analysis of the available hard X–ray data [IGR J18483–0311, Sguera et al. (2007), Porb18.5 days; IGR J16479–4514, Jain et al. (2009), Porb3.3 days]. For a fifth SFXT, IGR J08408–4503, we inferred an orbital period of 35 days from the times of the outbursts and the duration of the flares (Romano et al., 2009a).
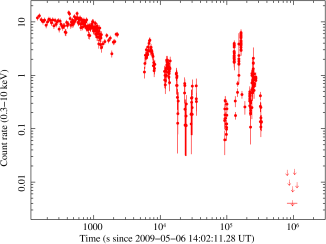
The SAX J1818.61703 orbital period of 30 days has been independently obtained by Bird et al. (2009) and by Zurita Heras & Chaty (2009). Assuming as orbital phase zero the same as Bird et al. (MJD 54540.659), the outburst we analyse here (BAT trigger start time) occurred at orbital phase =0.90 (1 error), consistent with the folded light curve and the 4–6 days outburst duration reported by both authors. The new outburst from SAX J1818.61703 we are reporting here indeed lasted about 5 days (see Fig. 4), which is also similar to the one in other SFXTs we have been monitoring in the last year with Swift (Sidoli et al. 2009a, Romano et al. 2009b) and to the outburst duration in IGR J11215–5952 (Romano et al., 2007).
After the BAT trigger, the whole outburst evolution and the decline phase could be monitored with Swift/XRT. The source displays a dynamical range of more than 3000 (see Fig. 4) and a multiple-flaring behaviour previously seen in other SFXTs (Romano et al., 2009a). The temporally resolved spectroscopy with XRT did not result in variability of the spectral parameters in the 1–10 keV range, within the uncertainties, except for the obvious change in the blackbody radius, when fitting the soft X–rays with a single absorbed blackbody (see Table 2). No variability in the absorbing column density could be detected along the outburst, within the uncertainties.
For the first time we obtained broad-band spectroscopy from soft to hard X–rays of this SFXT, allowing us to compare it with wide-band spectra from a few other SFXTs. Indeed, although SAX J1818.61703 has been observed with INTEGRAL (Sguera et al., 2005) in the past, only the high energy part was available ( keV) from the IBIS instrument, and the source spectrum has not been obtained (probably because of the low statistics). The Swift/XRT and BAT joint simultaneous spectrum during the SAX J1818.61703 outburst could be fit very well with a cutoff power law (cutoffpl in xspec) or with Comptonized emission models. It is highly absorbed, shows a flat power law (photon index in the range 0.1–0.5), and displays a cut-off constrained betwen 7 and keV (Table 3). The use of the Comptt model quantifies the physical conditions of the Comptonizing plasma, resulting in a temperature (5–7 keV) for the Comptonizing plasma and the optical depth of the spherical corona (10). The 1–100 keV luminosity is erg s-1 (assuming 2.5 kpc, Negueruela & Schurch 2007). These SAX J1818.61703 broad-band properties are reminiscent of the X–ray spectral shape of the prototype of the SFXT class, XTE J1739–302 (Sidoli et al. 2009b, Sidoli et al. 2009a). The two sources indeed display a similarly high absorption, similar X–ray luminosities, energy cutoff values, and hot seed photon temperatures, , of 1.3–1.4 keV. These spectral parameters indicate the presence of a cold and optically thick corona, which is also similar to what observed in bright neutron star low mass X–ray binaries (Paizis et al., 2006). No statistically significant pulsations have been found in the Swift/XRT data.
The duration of the outbursts, about 5 days, is also similar to the one observed in other SFXTs we have been monitoring in the last year with Swift (Sidoli et al. 2009a, Romano et al. 2009b) and to the outburst duration in IGR J11215–5952 (Romano et al., 2007). All these observed properties, together with the broad-band spectrum we observe now for the first time, confirm the fact that SAX J1818.61703 belongs to the class of SFXTs.
Acknowledgments
We thank the Swift team duty scientists and science planners. We also thank the remainder of the Swift XRT and BAT teams, S. Barthelmy in particular, for their invaluable help and support. This work was supported in Italy by contracts ASI I/088/06/0 and I/023/05/0, at PSU by NASA contract NAS5-00136. HAK was supported by the Swift project.
| Power-law | |||||
|---|---|---|---|---|---|
| Sequence | Unabsorbed Fluxa | Times | |||
| (1022 cm-2) | (1–10 keV) | (since trigger) | |||
| 00351323000 WT | 1.0/329 | 138–1, 320 | |||
| 00351323000 PC | 1.0/50 | 1, 322–2, 299 | |||
| 00031409001 PC | 0.8/112 | 5, 728–34, 923 | |||
| 00031409002 PC | 0.7/24 | 92, 565–100, 780 | |||
| 00031409003 WT | 0.9/23 | 128, 325–186, 108 | |||
| 00031409003 PC | 0.7/61 | 128, 336–186, 388 | |||
| 00031409004 PC | 0.9/46 | 220, 296–272, 679 | |||
| 00031409005 PC | 0.7/5 | 318, 508–330, 367 | |||
| Blackbody | |||||
| Sequence | Unabsorbed Fluxa | ||||
| (1022 cm-2) | (keV) | (1–10 keV) | (km)b | ||
| 00351323000 WT | 1.0/329 | ||||
| 00351323000 PC | 1.0/50 | ||||
| 00031409001 PC | 0.8/112 | ||||
| 00031409002 PC | 0.7/24 | ||||
| 00031409003 WT | 1.0/23 | ||||
| 00031409003 PC | 0.9/61 | ||||
| 00031409004 PC | 0.8/46 | ||||
| 00031409005 PC | 0.8/5 |
- a Fluxes (corrected for the absorption) are in units of erg cm-2 s-1.
- b Blackbody radii are in units of km, assuming the optical counterpart distance of 2.5 kpc.
| Model | Parameters | |||||||
|---|---|---|---|---|---|---|---|---|
| cutoffpl | a | b | Fluxc | /d.o.f. | ||||
| bmc*highecut | a | b,d | d | d | Ecutb | b | Fluxc | /d.o.f. |
| Comptte | a | b | b | Fluxc | /d.o.f. | |||
-
a
Absorbing column density is in units of cm-2.
-
b
High energy cutoff (), electron temperature (), seed photons temperature () and the blackbody color temperature are all in units of keV.
-
c
Unabsorbed 1–100 keV flux is in units of erg cm-2 s-1.
-
d
is the blackbody color temperature of the seed photons, is the spectral index and Log(A) is the illumination parameter.
-
e
Assuming a spherical geometry.
References
- Barthelmy et al. (2008) Barthelmy, S. D., Krimm, H. A., Markwardt, C. B., Palmer, D. M., & Ukwatta, T. N. 2008, GRB Coordinates Network, 7419, 1
- Bird et al. (2009) Bird, A. J., Bazzano, A., Hill, A. B., et al. 2009, MNRAS, 393, L11
- Bozzo et al. (2008) Bozzo, E., Campana, S., Stella, L., et al. 2008, Astron. Tel., 1493, 1
- Buccheri et al. (1983) Buccheri, R., Bennett, K., Bignami, G. F., et al. 1983, A&A, 128, 245
- Burrows et al. (2005) Burrows, D. N., Hill, J. E., & Nousek, J. A., et al. 2005, Space Science Reviews, 120, 165
- Grebenev & Sunyaev (2005) Grebenev, S. A. & Sunyaev, R. A. 2005, Astronomy Letters, 31, 672
- Grebenev & Sunyaev (2008) Grebenev, S. A. & Sunyaev, R. A. 2008, Astron. Tel., 1482, 1
- in’t Zand et al. (1998) in ’t Zand, J., Heise, J., Smith, M., et al. 1998, IAU Circ., 6840, 2
- in’t Zand et al. (2006) in’t Zand, J., Jonker, P., Mendez, M., & Markwardt, C. 2006, Astron. Tel., 915, 1
- Jain et al. (2009) Jain, C., Paul, B., & Dutta, A. 2009, MNRAS, in press, arXiv:0903.5403
- Negueruela & Schurch (2007) Negueruela, I. & Schurch, M. P. E. 2007, A&A, 461, 631
- Negueruela & Smith (2006) Negueruela, I. & Smith, D. M. 2006, Astron. Tel., 831, 1
- Negueruela et al. (2006) Negueruela, I., Smith, D. M., Harrison, T. E., & Torrejón, J. M. 2006, ApJ, 638, 982
- Paizis et al. (2006) Paizis, A., et al. 2006, A&A, 459, 187
- Romano et al. (2006) Romano, P., Campana, S., Chincarini, G., et al. 2006, A&A, 456, 917
- Romano et al. (2009a) Romano, P., Sidoli, L., Cusumano, G., et al. 2009a, MNRAS, 392, 45
- Romano et al. (2009b) Romano, P., Sidoli, L., Cusumano, G., et al. 2009b, MNRAS, in press, arXiv:0907.1289
- Romano et al. (2009c) Romano, P., Sidoli, L., Cusumano, G., et al. 2009c, ApJ, 696, 2068
- Romano et al. (2009d) Romano, P., Sidoli, L., Krimm, H. A., et al. 2009d, Astron. Tel., 2044, 1
- Romano et al. (2008) Romano, P., Sidoli, L., Mangano, V., et al. 2008, ApJL, 680, L137
- Romano et al. (2007) Romano P., Sidoli L., Mangano V., Mereghetti S., Cusumano G., 2007, A&A, 469, L5
- Scargle (1982) Scargle, J. D. 1982, ApJ, 263, 835
- Sguera et al. (2005) Sguera, V., Barlow, E. J., Bird, A. J., et al. 2005, A&A, 444, 221
- Sguera et al. (2007) Sguera, V., Hill, A. B., Bird, A. J., et al. 2007, A&A, 467, 249
- Sidoli (2009) Sidoli, L. 2009, Advances in Space Research, 43, 1464
- Sidoli et al. (2006) Sidoli, L., Paizis, A., & Mereghetti, S. 2006, A&A, 450, L9
- Sidoli et al. (2009a) Sidoli, L., Romano, P., Ducci, L., et al. 2009a, MNRAS, in press, arXiv:0905.2815
- Sidoli et al. (2009b) Sidoli, L., Romano, P., Mangano, V., et al. 2009b, ApJ, 690, 120
- Sidoli et al. (2008) Sidoli, L., Romano, P., Mangano, V., et al. 2008, ApJ, 687, 1230
- Titarchuk (1994) Titarchuk, L. 1994, ApJ, 434, 570
- Titarchuk et al. (1996) Titarchuk, L., Mastichiadis, A., & Kylafis, N. D. 1996, A&AS, 120, C171
- Vaughan et al. (1994) Vaughan, B. A., van der Klis, M., Wood, K. S., et al. 1994, ApJ, 435, 362
- Vaughan et al. (2006) Vaughan S., Goad M. R., Beardmore A. P., et al., 2006, ApJ, 638, 920
- Zurita Heras & Chaty (2009) Zurita Heras, J. A. & Chaty, S. 2009, A&A, 493, L1