Explosive Disintegration of a Massive Young Stellar System in Orion
Abstract
Young massive stars in the center of crowded star clusters are expected to undergo close dynamical encounters that could lead to energetic, explosive events. However, there has so far never been clear observational evidence of such a remarkable phenomenon. We here report new interferometric observations that indicate the well known enigmatic wide-angle outflow located in the Orion BN/KL star-forming region to have been produced by such a violent explosion during the disruption of a massive young stellar system, and that this was caused by a close dynamical interaction about 500 years ago. This outflow thus belongs to a totally different family of molecular flows which is not related to the classical bipolar flows that are generated by stars during their formation process. Our molecular data allow us to create a 3D view of the debris flow and to link this directly to the well known Orion H2 “fingers” farther out.
1 Introduction
The outflow in Orion BN/KL is probably the most enigmatic of all high-velocity molecular outflows associated with a star forming region because of its wide-spread and multiple “finger” morphology, reminiscent of an explosive event, and of the non-alignment of its red- and blueshifted lobes. All other outflows in the Orion region appear to be highly collimated along their respective steady jets that are energized by a young, obscured star, see for an example: Zapata et al. (2005, 2006); Henney et al. (2007); O’Dell et al. (2008). Since their discovery the Orion fingers (Taylor et al., 1994; Allen & Burton, 1993) have been mapped in H2/IR by numerous authors, see O’Dell et al. (2008); the origin of the outflow has been even more debated than the fingers (Genzel & Stutzki, 1989; Menten & Reid, 1995; Beuther & Nissen, 2008).
Recently, large proper motions (equivalent to velocities of the order a few tens of km s-1) were reported for the radio sources associated with the infrared sources BN and n as well as for the radio source I (Rodríguez et al., 2005; Gómez et al., 2005, 2008). All three objects are located at the core of the BN/KL region and appear to be moving away from a common point at which they must have been located about 500 years ago. This suggests that all three were originally part of a massive multiple stellar system that has recently disintegrated as a result of some close dynamical interaction. The possibility of the Orion BN/KL outflow having been produced simultaneously as a result of a close dynamical interaction has been discussed (Bally & Zinnecker, 2005). Such merger-generated outflows are expected to be highly impulsive and poorly collimated. A different picture for the proper motion associated with BN has been discussed by Tan (2004) whose work proposes BN to be a runaway B star, ejected 4000 years ago from the 1 Orionis C System.
It is interesting to note that the kinetic energy released in the ejection of the three young stellar objects is estimated to be about 2 1047 erg (Gómez et al., 2005), a value very similar to that of the Orion BN/KL outflow of 4 1047 erg (Kwan & Scoville, 1976). Moreover, the dynamical ages of both events are also in good agreement, between 500 and 1000 years. For the outflow the age has been estimated as about 1000 yr (Doi et al., 2002); however, in the case that the proper motions of the expelled material were decelerated, this age would have to be reduced (Lee & Burton, 2000).
2 Observations
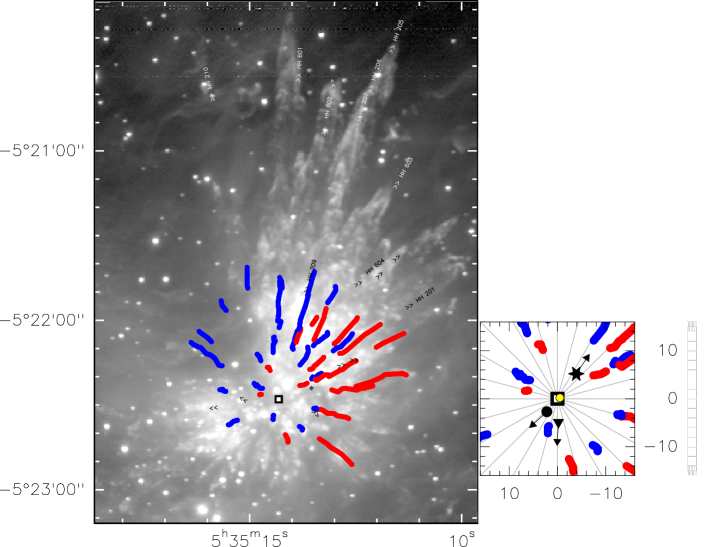
Observations were made with the Submillimeter Array111The Submillimeter Array is a joint project between the Smithsonian Astrophysical Observatory and the Academia Sinica Institute of Astronomy and Astrophysics, and is funded by the Smithsonian Institution and the Academia Sinica. (SMA) during 2007 January and 2009 February. The SMA was in its compact and sub-compact configurations with baselines ranging in projected length from 6 to 58 m. We used the mosaicing mode with half-power point spacing between field centers and covered the entire BN/KL outflow as far as it has been mapped in H2 by Bally et al. (in prep.), see Figure 1. Our mosaic boundaries fall outside the frame of that figure. The primary beam of the SMA at 230 GHz is about 50′′.
The receivers were tuned to a frequency of 230.5387970 GHz in the upper sideband (USB), while the lower sideband (LSB) was centered on 220.5387970 GHz. The CO(2-1) transition was detected in the USB at frequencies near of 230.5 GHz. The full bandwidth of the SMA correlator is 4 GHz (2 GHz in each band). The SMA digital correlator was configured in 24 spectral windows (“chunks”) of 104 MHz each, with 256 channels distributed over each spectral window, thus providing a spectral resolution of 0.40 MHz (1.05 km s-1) per channel. However, in this study we smoothed the spectral resolution to 5 km s-1, because of the large width of the CO line toward the Orion BN/KL region.
The zenith opacity () was 0.1 – 0.3, indicating reasonable weather conditions. Observations of Uranus and Titan provided the absolute scale for the flux density calibration. Phase and amplitude calibrators were the quasars 0530+135, 0541-056, and 0607-085. Further technical descriptions of the SMA and its calibration schemes can be found in Ho et al. (2004).
The data were calibrated using the IDL superset MIR, originally developed for the Owens Valley Radio Observatory (Scoville et al., 1993) and adapted for the SMA.222The MIR cookbook by C. Qi can be found at http://cfa-www.harvard.edu/cqi/mircook.html The calibrated data were imaged and analyzed in standard manner using the MIRIAD, GILDAS and AIPS packages. We used the ROBUST parameter set to 0 to obtain an optimal compromise between sensitivity and angular resolution. The line image rms noise was around 200 mJy beam-1 for each channel at an angular resolution of with a P.A. = -14.0∘.
3 Results and Discussion
Figure 1 displays the most prominent CO emission features detected outside of the velocity window -35 to 35 km s-1, overlaid on the H2 image (taken from Bally et al. in prep.) of the BN/KL fingers. Within this window the radiation stems predominantly from the ambient cloud and is spatially extended, thus cannot be properly reconstructed by an interferometer. Receding (redshifted) CO features show radial velocities up to 130 km s-1, approaching values down to -120 km s-1, in good correspondence to the ones observed (Chernin & Wright, 1996; Rodríguez-Franco et al., 1999) by single telescopes; the spatial extent (1′ to 2′) of our CO features also agrees well with these earlier images (Chernin & Wright, 1996; Rodríguez-Franco et al., 1999). This speaks against much missing flux at these high velocities. Furthermore, in the 12 resolution CO(2-1) single-dish observations (Rodríguez-Franco et al., 1999) the molecular gas associated with the outflow at high velocities is seen to be quite compact (see their Figure 2). Our CO(2-1) observations resolve for the first time the molecular content of the inner part of the expanding flow region into numerous clearly defined “jet-like” structures, many of them being well correlated in direction with the fingers visible in H2.
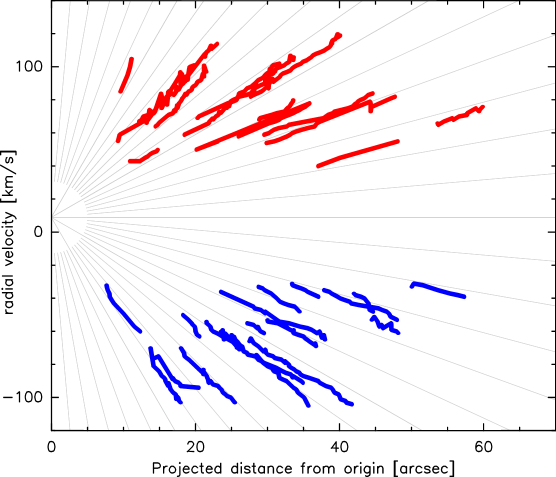
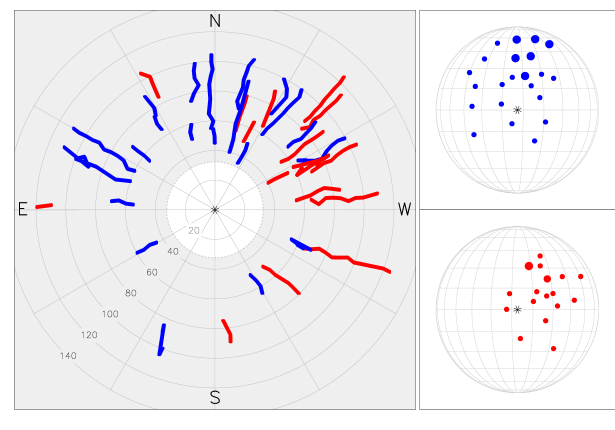
Maps in velocity windows of 5 km s-1 width each show several hundred localized emission features, the positions of which we determined by linearized least-squares fits to Gaussian ellipsoids using the task SAD of AIPS. Many of them are clearly aligned and with consistent velocity increments such that some 40 filaments can be discerned, see Figure 1. The filaments follow nearly straight lines and seem to all point toward a common center. This center is located in the middle between the three sources BN, I, and n. The radial velocity along each filament changes linearly with on-the-sky distance from this center, albeit with a velocity gradient different for each feature (Figure 2). At the common center all but a few velocities converge to the value 9 2 km s-1, in good correspondence with the 9 km s-1 value of the ambient material surrounding BN (Kwan & Scoville, 1976). In the polar diagram of Figure 3 (left) the line-of-sight velocities are displayed as distances along the radial coordinate of the diagram, while the angular coordinate gives the PA of the points along each filament. Note that nearly all filaments start with an innermost velocity well outside the above-mentioned 35 km s-1 window, thus demonstrating that the central ”hole“ is not merely an observational effect. Obviously the red- and blueshifted sectors do not cluster around one common straight line. This shows that the standard model of bipolar outflows cannot be applied to the high-velocity BN/KL system; a chance superposition of two separate one-lobe outflows also seems highly unlikely in view of the strong similarities between the two sectors. In addition, bipolar outflows usually show their highest velocities along the central axis while in the present case the peak flow velocities do not seem to vary much at all from cone center to cone edge.
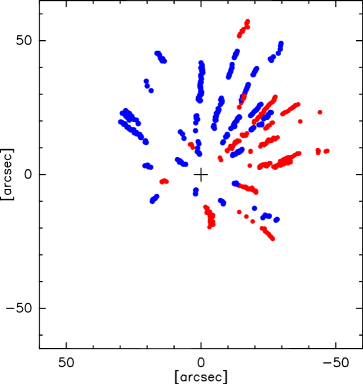
By fitting a straight line to each filament we determine the position of the CO “outflow’s” origin to be =05h 35m 14.37s 1.5′′ and =-05∘ 22′ 27.9′′ 1.5′′. This position coincides to within the errors with the position =05h 35m 14.35s 1′′ and =-05∘ 22′ 27.7′′ 1′′ from which according to proper motion measurements the radio and infrared sources BN, I, and n were ejected some 500 years ago (Rodríguez et al., 2005; Gómez et al., 2005, 2008). We have undertaken a careful kinematical and statistical analysis to determine the center of this explosive outflow, as will be presented in a forthcoming paper.
This position coincidence suggests that the outflow from the Orion BN/KL region was produced in the course of the disintegration of a young stellar system of which the three radio and infrared sources were members. If this was the case, the outflow should not have been fed for a long time because its “source” then is no longer there. There is an apparent age discrepancy between the H2 fingers ( 1000: yr Lee & Burton, 2000; Doi et al., 2002) and the runaway event ( 500 yr) which can however easily be resolved by assuming the ejected molecular material to gradually decelerate during its outbound motions. In our CO data no such deceleration is seen, as evidenced by Figure 2; however, the CO filaments extend only roughly half as far as the H2 structures, such that slowdown may set in at lager distances. A straightforward age determination from our CO measurements would require the filaments’ inclination i against the sky plane to be known since true age (real filament length divided by its real velocity) is related to apparent (“dynamical”) age by a factor . If one assumes all filaments to have started at the same time, i.e. in a singular explosive event, one can calculate an i value for each of them once a start time has been chosen. One thus obtains a 3D model of the entire flow system. The animation in Figure 4 displays the 3D configuration for an assumed age of 500 yr. As an example the resulting 3-space direction for each jet is indicated in Figure 3 (right) by a dot on the unit sphere around the explosion center, for the case of a start time 1000 yr ago. The dot marks the spot where the filament would cross the sphere; large dots here denote filaments clearly aligned with the most prominent H2 fingers. It appears that most such long H2 fingers are approaching the observer rather than receding from us, and they do so at inclinations i that are low relative to the average value of i of the aproaching filaments, as expected if all fingers had roughly equal true lengths. For ages larger than 1000 yr the direction vectors crowd closer to the center (i.e. nearer the line of sight), thus permitting some probabilistic discussion of the start time: For age 1000 yr the average direction of the redshifted filaments seem to be about 22∘ from the line of sight. The random chance that a filament cone axis is inclined no more than 22∘ to the line of sight is or 0.073, hence for one of the two some 15%. The same argument for age 2000 yr gives a probability of merely 0.05, for 500 yr of about 0.42. It thus seems much more likely that the true age of the system of CO filaments is 500 rather than 1000 yr.
In conclusion, we suggest that this complex of CO and H2 emission is due to an explosive phenomenon entirely different from the standard accretion disk outflows commonly associated with star formation. Outflows generated by a dynamical decay of star systems have been suggested to be the case in a large number of HH objects (Reipurth, 2000).
References
- Allen & Burton (1993) Allen, D. A., & Burton, M. G. 1993, Nature, 363, 54
- Bally & Zinnecker (2005) Bally, J., & Zinnecker, H. 2005, AJ, 129, 2281
- Beuther & Nissen (2008) Beuther, H., & Nissen, H. D. 2008, ApJ, 679, L121
- Chernin & Wright (1996) Chernin, L. M., & Wright, M. C. H. 1996, ApJ, 467, 676
- Doi et al. (2002) Doi, T., O’Dell, C. R., & Hartigan, P. 2002, AJ, 124, 445
- Genzel & Stutzki (1989) Genzel, R., & Stutzki, J. 1989, ARA&A, 27, 41
- Gómez et al. (2005) Gómez, L., Rodríguez, L. F., Loinard, L., Lizano, S., Poveda, A., & Allen, C. 2005, ApJ, 635, 1166
- Gómez et al. (2008) Gómez, L., Rodríguez, L. F., Loinard, L., Lizano, S., Allen, C., Poveda, A., & Menten, K. M. 2008, ApJ, 685, 333
- Henney et al. (2007) Henney, W. J., O’Dell, C. R., Zapata, L. A., García-Díaz, M. T., Rodríguez, L. F., & Robberto, M. 2007, AJ, 133, 2192
- Ho et al. (2004) Ho, P. T. P., Moran, J. M., & Lo, K. Y. 2004, ApJ, 616, L1
- Kwan & Scoville (1976) Kwan, J., & Scoville, N. 1976, ApJ, 210, L39
- Lee & Burton (2000) Lee, J.-K., & Burton, M. G. 2000, MNRAS, 315, 11
- Menten & Reid (1995) Menten, K. M., & Reid, M. J. 1995, ApJ, 445, L157
- Reipurth (2000) Reipurth, B. 2000, AJ, 120, 3177
- O’Dell et al. (2008) O’Dell, C. R., Muench, A., Smith, N., & Zapata, L. 2008, Handbook of Star Forming Regions, Volume I: The Northern Sky ASP Monograph Publications, Vol. 4. Edited by Bo Reipurth, p.544, 544
- O’Dell et al. (2008) O’Dell, C. R., & Henney, W. J. 2008, AJ, 136, 1566
- Lee & Burton (2000) Lee, J.-K., & Burton, M. G. 2000, MNRAS, 315, 11
- Scoville et al. (1993) Scoville, N. Z., Carlstrom, J. E., Chandler, C. J., Phillips, J. A., Scott, S. L., Tilanus, R. P. J., & Wang, Z. 1993, PASP, 105, 1482
- Taylor et al. (1994) Taylor, K. N. R., Storey, J. W. V., Sandell, G., Williams, P. M., & Zealey, W. J. 1984, Nature, 311, 236
- Tan (2004) Tan, J. C. 2004, ApJ, 607, L47
- Rodríguez-Franco et al. (1999) Rodríguez-Franco, A., Martín-Pintado, J., & Wilson, T. L. 1999, A&A, 351, 1103
- Rodríguez et al. (2005) Rodríguez, L. F., Poveda, A., Lizano, S., & Allen, C. 2005, ApJ, 627, L65
- Rodríguez et al. (2009) Rodríguez, L. F., Zapata, L. A., & Ho, P. T. P. 2009, ApJ, 692, 162
- Zapata et al. (2005) Zapata, L. A., Rodríguez, L. F., Ho, P. T. P., Zhang, Q., Qi, C., & Kurtz, S. E. 2005, ApJ, 630, L85
- Zapata et al. (2006) Zapata, L. A., Ho, P. T. P., Rodríguez, L. F., O’Dell, C. R., Zhang, Q., & Muench, A. 2006, ApJ, 653, 398