On the role of the post-starburst phase in the build-up of the red-sequence of intermediate redshift clusters
Abstract
We present new deep spectroscopic observations of 0.05–0.5 L∗ galaxies in one cluster (cl–) drawn from the ESO Distant Cluster Survey (EDisCS) sample, at . The new data extend the spectroscopy already available for this cluster by about 1 magnitude. The cluster has a large fraction of passive galaxies and exhibits a well defined and relatively tight colour-magnitude relation. Among spectroscopic members, only six galaxies are classified as ‘post-starburst’ (k+a). For another EDisCS cluster at similar redshift and with as deep spectroscopy, no member is found to have a k+a spectrum. The low measured numbers of post-starburst systems appear to be inadequate to explain the observed increase of faint red galaxies at lower redshift, even when accounting for the infall of new galaxies onto the cluster. Post-starburst galaxies represent a possible channel to move galaxies from the blue star-forming cloud to the red-sequence, but the available data suggest this is not the dominant channel in galaxy clusters. If the galaxies at the faint end of the red-sequence in nearby clusters originate from the blue galaxies observed in distant galaxy clusters, the transformation must have occurred primarily through physical processes that do not lead to a post-starburst phase. In addition, our data exclude a large population of k+a galaxies at faint magnitudes, as found in the Coma cluster.
keywords:
galaxies: clusters: general – galaxies: evolution – galaxies: fundamental parameters.1 Introduction
Early-type galaxies in clusters show a clearly defined relation between colour and luminosity. The existence of this relation has been known for a long time (Baum, 1959; de Vaucouleurs, 1961; Visvanathan & Sandage, 1977) and it has long been thought to encode important information about the formation history of early-type galaxies. The scatter around the colour-magnitude relation is very small, at all redshifts where it has been measured accurately, and its slope does not appear to have evolved significantly up to (Ellis et al., 1997; Mei et al., 2008, and references therein).
The traditional interpretation of these observations is that cluster early-type galaxies formed at high redshift () in a short duration event, and evolved passively thereafter. In this scenario, the colour-magnitude relation represents a sequence of increasing metallicity with increasing luminosity, and is produced because a galactic wind is induced progressively later in brighter galaxies, which have deeper potential wells (Faber, 1973; Arimoto & Yoshii, 1987; Kodama & Arimoto, 1997). Weak age trends are not excluded and are indeed measured (e.g. Ferreras, Charlot & Silk 1999; Poggianti et al. 2001; Nelan et al. 2005), but age is not traditionally considered the main driver of the colour-magnitude relation because younger stellar populations have more rapid colour evolution. If the colour-magnitude relation was indeed an age sequence, it would change dramatically with increasing redshift as smaller galaxies approach their formation epochs (Kodama et al., 1998).
This classical interpretation relies on the assumption that all galaxies sitting on the colour-magnitude relation today, can be identified as red-sequence members of high-redshift galaxy clusters - an assumption that is likely to be wrong. As noticed by van Dokkum & Franx (1996), evolutionary studies based on observations of early-type galaxies at different epochs are seriously complicated by what they named the progenitor bias: if the progenitors of some present early-types were spirals at higher redshift, they would not be included in the samples studied at higher redshift, biasing the measured population towards older ages. The existence of such a bias, as discussed below, has been directly demonstrated in recent studies of the colour-magnitude evolution.
In De Lucia et al. (2004), we analysed the colour-magnitude relation of 4 clusters in the redshift range 0.7-0.8 from the ESO Distant Cluster Survey (EDisCS), and found a deficiency of low-luminosity red-sequence galaxies with respect to the nearby cluster Coma. Similar results were found by Kodama et al. (2004) for early-type galaxies in a single deep field, and were later confirmed by a number of studies using independent datasets (De Lucia et al., 2007; Stott et al., 2007; Gilbank et al., 2008). The reported results are not unanimous and were criticised in particular by Andreon (2008) whose results are, however, consistent with ours over the same redshift range (see their Fig. 4). In addition, some evolution in the distribution of red-sequence galaxies is expected as a consequence of the established mass-dependence of early-type galaxy evolution (e.g. Thomas et al., 2005; Nelan et al., 2005; Gallazzi et al., 2006, but see Fontanot et al. 2009).
The population of blue galaxies observed in distant galaxy clusters provides the logical progenitors of the increasing number of faint red galaxies observed at low redshift. In De Lucia et al. (2007), we showed that a simple scenario in which infalling galaxies have their star formation histories truncated by the hostile cluster environment is consistent with the observed build-up of the colour-magnitude sequence (see also Smail et al. 1998). Which physical mechanism(s) is(are) responsible for the transformation from star-forming to passive galaxies, as well as the associated time-scale(s) remain, however, to be understood.
While the integrated colours of any new addition to the colour-magnitude relation indicate no sign of ongoing star formation, it is possible to apply more sensitive spectroscopic tests to identify the signature of their recent past activity. ‘K+a’ (also referred to as ‘E+A’ or ‘post-starburst’) galaxies, in particular, represent the best candidates for an evolutionary link between star-forming, gas-rich galaxies and quiescent, gas-poor systems. These galaxies are commonly identified on the basis of their optical spectra as having almost no emission lines (typically [OII]) and exceptionally strong Balmer lines in absorption (Dressler & Gunn, 1983; Couch & Sharples, 1987). Spectrophotometric modelling has demonstrated that the superposition of a young stellar population (represented by A stars) and an old population (dominated by K stars) indicates that star formation ceased abruptly in these galaxies in the past – years (see e.g. Couch & Sharples 1987; Newberry, Boroson & Kirshner 1990; Poggianti & Barbaro 1997; Bekki, Shioya & Couch 2001). First studied in galaxy clusters, k+a galaxies have also been found in low-density regions (Zabludoff et al., 1996; Blake et al., 2004; Yan et al., 2008; Wild et al., 2008) suggesting that interactions with the ‘cluster environment’ (e.g. ram-pressure stripping or harassment) are a possible but not a necessary condition for galaxies to pass through this evolutionary phase. The absolute fraction of k+a galaxies in different environments and at various cosmic epochs is still a matter of debate, depending significantly on the criteria for Balmer and [OII] strengths, the line measurement method, the spectral quality, and the ‘environment’ definition adopted (Poggianti et al., 2009, and references therein). At low redshift, k+a galaxies are rare among luminous galaxies, in all environments. For the Coma cluster, a conspicuous population of k+a galaxies has been detected at fainter magnitudes, representing a significant fraction of the cluster ‘dwarfs’ (Poggianti et al., 2004). Spectroscopic studies of distant cluster galaxy populations are unavoidably limited to the bright end of the galaxy luminosity function. Therefore, the presence of a large fraction of k+a galaxies at faint magnitudes in intermediate redshift galaxy clusters, is yet to be demonstrated.
To measure how much of the build-up of the colour-magnitude relation at low-redshift is caused by galaxies passing through a k+a phase, we have undertaken deep spectroscopic observations of 0.05–0.5 L∗ galaxies in one cluster drawn from the EDisCS sample, at . The time interval between this redshift (when clusters already contained numerous faint red galaxies) and (when clusters exhibit a clear deficit of this population) is approximately Gyr, comparable with the typical time-scale probed by a k+a spectrum. Below, we complement these spectroscopic data with EDisCS data available for the cluster cl1138.2-1133 (hereafter cl1138). This cluster was originally targeted as a high-z () cluster candidate, but it turned out that the field contains two clusters at . For this cluster, the available EDisCS spectroscopy is as deep as the new spectroscopy presented here.
The layout of the paper is as follows. Our target selection, observations, and data reduction are described in Section 2. In Section 3, we characterise the spectral composition of the clusters used in this study. In Section 4, we discuss our new results in the context of the build-up of the red-sequence galaxy population. Finally, we discuss our results and give our conclusions in Section 6. Where necessary in the following, we assume a CDM cosmology with , , and H.
2 The data
Our target cluster for new spectroscopic observations (cl1232.5-1250, hereafter abbreviated as cl1232) is a rich cluster at with a line-of-sight velocity dispersion of (Halliday et al., 2004), and a significant weak lensing detection (Clowe et al., 2006). For this cluster, the EDisCS programme obtained deep FORS2 (Appenzeller et al., 1998) photometry at , , and with integration times of approximately 2 hours (White et al., 2005), and deep near infrared imaging using SOFI at NTT, with integration times of 300 min at and 360 min at (Aragón-Salamanca et al. in preparation). Within the EDisCS programme, we also obtained for this cluster deep spectroscopy using 4 separate slit masks on FORS2 and exposure times of 106 (for one mask) and 120 (for the other three masks) minutes (Halliday et al., 2004). For cl1232, we also have mosaic images in the F814W filter from the Advanced Camera for Surveys (ACS) onboard the Hubble Space Telescope (HST), with one orbit exposure in the outer regions, and five orbit coverage of the cluster centre (Desai et al., 2007).
For our new spectroscopic observations, target selection was based on the available VLT/FORS2 photometry (White et al., 2005). The optical data cover and are well matched to the FORS2 spectrograph field of view. Our targets were selected among galaxies with I-band magnitude between 21.5 and 23. We excluded galaxies with V-I colour redder than 2.6, so as to exclude targets above the observed colour-magnitude relation for this cluster. At fainter magnitudes, when possible, we added slits on targets at I within a wedge-shaped region close to the observed colour-magnitude relation (see Fig. 3 below). For the target selection, we used magnitudes and colours computed within an aperture of radius , and uncorrected for Galactic extinction. The spectroscopic data presented in this work are deeper than available EDisCS spectroscopy by about magnitude.
Spectroscopic data were acquired during one observing run spanning four nights (starting on April 16, 2004) using the MXU multi-object mask facility of the FORS2 spectrograph, mounted on the VLT Yepun UT4 telescope in Paranal. The planned observations could not be carried out due to bad weather conditions (strong wind, high humidity, and seeing always above and varying strongly, up to during integration). Observations for only three masks out of the eight prepared were completed, with exposure times of 4.5 hours and using the high efficiency grism 600RI+19 ( Å, resolution Å). The signal-to-noise ratio around Å is at I=21.6, at I=22.4, and per FORS2 pixel ( Å/pixel) at I=23.0. Because of poor seeing, the quality of these spectra is too low to perform a detailed spectroscopic analysis. Nevertheless, as we discuss in the following, these data have been useful in assessing our strategy and quantifying the role of the post-starburst phase in the build up of the red-sequence for the cluster under investigation.
Data reduction was completed using IRAF111IRAF is distributed by the National Optical Astronomy Observatories, which are operated by the Association of Universities for Research in Astronomy, Inc., under cooperative agreement with the National Science Fundation. See: http://iraf.noao.edu/ and the improved sky subtraction method, flux calibration, and correction for telluric absorption, which are described in detail in Milvang-Jensen et al. (2008, see also and ). We refer to these papers for full details of the data reduction procedure.
Spectroscopic redshifts were measured using emission lines where possible, in particular the [OII]3727 line, or the most prominent absorption lines, e.g. calcium K and H lines at 3934Å and 3968Å. A quality flag was assigned manually to each measurement. In the following, we use only ‘secure’ redshift measurements. The equivalent widths of the [OII] and Balmer lines were measured with a line fitting technique similar to that used in Dressler et al. (1999), after inspecting each one-dimensional spectrum interactively. Each two-dimensional spectrum was also inspected so as to confirm the presence of an emission line, particularly in the case of weak lines.
As explained in Section 1, cl1138 was originally targeted as a high- cluster, with an expected redshift . The redshift of all candidate clusters observed within the EDisCS programme was estimated using an empirically calibrated relation between the redshift and the magnitude of the brightest galaxies (Gonzalez et al., 2001). For this cluster, however, a large part of the imaging data near the cluster detection was masked (likely due to a nearby bright star). As a result, the cluster centroid was shifted slightly away from the actual brightest cluster galaxy (BCG), which ended up just outside the automated search radius. As a result, a fainter galaxy was identified as BCG and the cluster redshift was overestimated (Gonzalez, private communication). The dominant spectroscopic peak for cl1138 is at (45 secure spectroscopic members). The field also contains a secondary peak at , with 11 secure spectroscopic members (Milvang-Jensen et al., 2008). The main cluster in the field has a line-of-sight velocity dispersion of , while the secondary cluster has a velocity dispersion of . Since the field was targeted as a high- cluster candidate, the available spectroscopy is deeper than that obtained for other EDisCS clusters at similar redshift, and extends down to a limiting magnitude similar to that obtained for cl1232 with our new spectroscopic observations. The spectroscopic data reduction and spectral analysis for this cluster was carried out using the same methods and procedures outlined above. We note that our photometric redshift estimates are not robust at for the filter set used for the high-redshift candidate clusters such as cl1138 (Pelló et al. submitted). B-band data would be needed for this cluster to achieve higher accuracy in the photometric redshift estimation.
| EDisCS ID | RA (J2000) | Dec (J2000) | z | EW[OII] | EW[H] | spectral type |
|---|---|---|---|---|---|---|
| EDCSNJ1232370-1248239(*) | 12:32:37.04 | -12:48:23.94 | 0.5399 | 0.0 | 2.7 | passive |
| EDCSNJ1232348-1248427 | 12:32:34.76 | -12:48:42.73 | 0.5335 | 80.3 | 0.0 | active |
| EDCSNJ1232342-1248565 | 12:32:34.20 | -12:48:56.45 | 0.5323 | 44.2 | 0.0 | active |
| EDCSNJ1232311-1249392 | 12:32:31.11 | -12:49:39.16 | 0.5445 | — | — | uncertain |
| EDCSNJ1232350-1249519 | 12:32:34.98 | -12:49:51.91 | 0.5450 | — | — | uncertain |
| EDCSNJ1232276-1250017 | 12:32:27.61 | -12:50:01.69 | 0.5411 | 0.0 | 0.0 | passive |
| EDCSNJ1232274-1250548 | 12:32:27.43 | -12:50:54.78 | 0.5441 | 0.0 | 0.0 | passive |
| EDCSNJ1232291-1251054 | 12:32:29.08 | -12:51:05.40 | 0.5433 | 0.0 | 1.3 | passive |
| EDCSNJ1232212-1251476 | 12:32:21.16 | -12:51:47.61 | 0.5399 | 0.0 | — | passive |
| EDCSNJ1232284-1251573 | 12:32:28.36 | -12:51:57.26 | 0.5437 | 0.0 | 0.0 | passive |
| EDCSNJ1232242-1252301(*) | 12:32:24.24 | -12:52:30.10 | 0.5386 | 0.0 | 2.9 | passive |
| EDCSNJ1232261-1252429(*) | 12:32:26.11 | -12:52:42.94 | 0.5376 | 0.0 | 3.0 | (weak) k+a |
| EDCSNJ1232230-1253041 | 12:32:22.97 | -12:53:04.07 | 0.5448 | 0.0 | 0.0 | passive |
| EDCSNJ1232369-1248246 | 12:32:36.88 | -12:48:24.58 | 0.5362 | 7.0 | 0.0 | active |
| EDCSNJ1232366-1248446 | 12:32:36.61 | -12:48:44.62 | 0.5352 | 53.3 | 0.0 | active |
| EDCSNJ1232335-1249293 | 12:32:33.54 | -12:49:29.29 | 0.5450 | 37.4 | 8.0 | active |
| EDCSNJ1232292-1249417 | 12:32:29.17 | -12:49:41.70 | 0.5360 | — | — | uncertain |
| EDCSNJ1232299-1250018 | 12:32:29.94 | -12:50:01.84 | 0.5409 | 0.0 | 0.0 | passive |
| EDCSNJ1232339-1250359 | 12:32:33.89 | -12:50:35.93 | 0.5416 | 0.0 | 0.0 | passive |
| EDCSNJ1232285-1250527 | 12:32:28.53 | -12:50:52.74 | 0.5416 | 0.0 | 0.0 | passive |
| EDCSNJ1232300-1251293 | 12:32:29.97 | -12:51:29.30 | 0.5419 | — | — | uncertain |
| EDCSNJ1232333-1252436 | 12:32:33.32 | -12:52:43.56 | 0.5430 | 9.3 | 2.7 | active |
| EDCSNJ1232320-1252551 | 12:32:31.97 | -12:52:55.15 | 0.5391 | 26.4 | 0.0 | active |
| EDCSNJ1232358-1249348 | 12:32:35.80 | -12:49:34.77 | 0.5328 | 0.0 | 0.0 | passive |
| EDCSNJ1232319-1250024 | 12:32:31.91 | -12:50:02.44 | 0.5475 | — | — | uncertain |
| EDCSNJ1232366-1250526 | 12:32:36.61 | -12:50:52.63 | 0.5391 | 0.0 | 0.0 | passive |
| EDCSNJ1232320-1251257 | 12:32:32.04 | -12:51:25.72 | 0.5485 | 41.1 | 0.0 | active |
| EDCSNJ1232311-1251563 | 12:32:31.07 | -12:51:56.32 | 0.5407 | 0.0 | 0.0 | passive |
| EDCSNJ1232261-1253040(*) | 12:32:26.08 | -12:53:04.00 | 0.5597 | 5.0 | 0.0 | active |
| EDCSNJ1232324-1253496 | 12:32:32.44 | -12:53:49.57 | 0.5407 | 0.0 | 11.4 | k+a |
| EDCSNJ1232361-1254185(*) | 12:32:36.10 | -12:54:18.52 | 0.5398 | 2.3 | 6.5 | k+a |
3 Spectral composition

The new spectroscopic data provide 31 cluster members for the cluster cl1232. Five of these members were already observed within the EDisCS programme, yielding a total of 26 new cluster members. The additional spectroscopic information does not modify significantly the dynamical and substructure analysis of this cluster discussed in Halliday et al. (2004). In the following, we therefore focus on an analysis of the spectral composition of the cluster cl1232, and compare it to the information available for cl1138.
We grouped all spectroscopic members into three broad spectral classes: galaxies with an absorption-line spectrum are classified as passive, while galaxies with significant emission in their spectra (EW[OII] Å) are classified as active. In addition, we classify as k+a galaxies all those with no significant [OII] emission ( Å), and with strong Balmer lines in absorption. At the redshift of cl1232, unfortunately, the 6300 Å sky line falls exactly on top of the H line. For our k+a classification, we therefore rely on higher-order Balmer lines, in particular H, which is strongly correlated to H, and provides a useful substitute whenever H is not available (Poggianti et al., 2009). In our study, we classify as post-starburst galaxies all those with EW Å and EW[OII] Å.
In Table 1, we provide, for each cluster member obtained through our new observations, the EDisCS object ID (column 1), the right ascension (column 2), the declination (column 3), the measured redshift (column 4), the equivalent widths of the [OII] (column 5) and H (column 6) lines, and the spectral type (column 7). Members already observed in the EDisCS programme are indicated with an asterisk.
The spectra of the six members classified as post-starburst galaxies are shown in Fig. 1, in order of increasing luminosity. The dashed vertical lines in the figure mark the main spectral lines over the wavelength range shown: [OII]3727, H3798, H3835, H3889, H3970, and H4101. Spectra are shown in the rest frame and have been rebinned to 5 Å/pixel. The signal-to-noise ratio decreases towards fainter magnitudes and, as discussed above, a sky line at 6300 Å is clearly visible in most of the panels and complicates significantly the measurement of the H equivalent width.
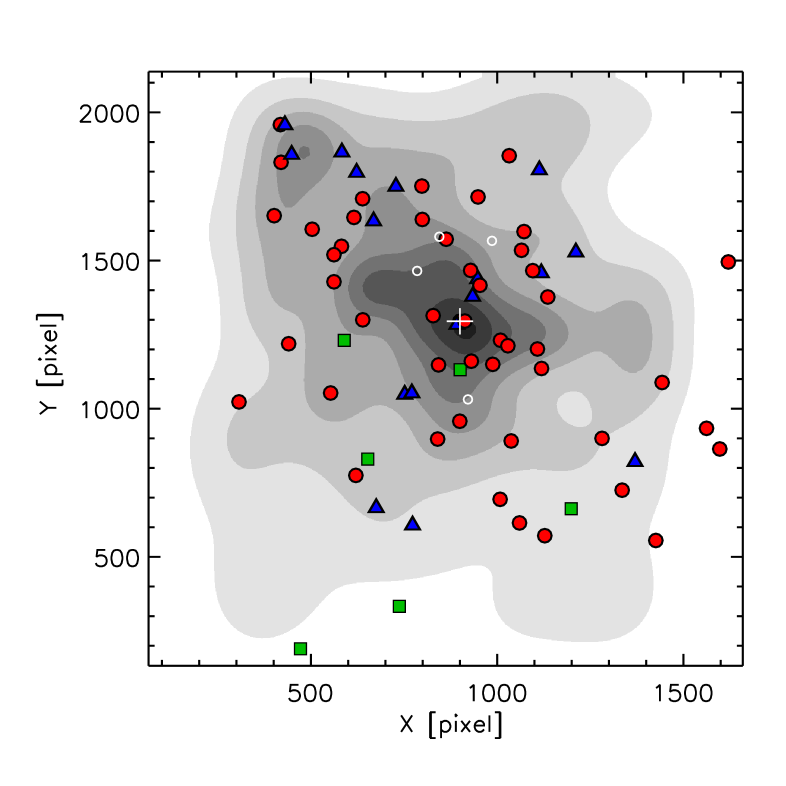
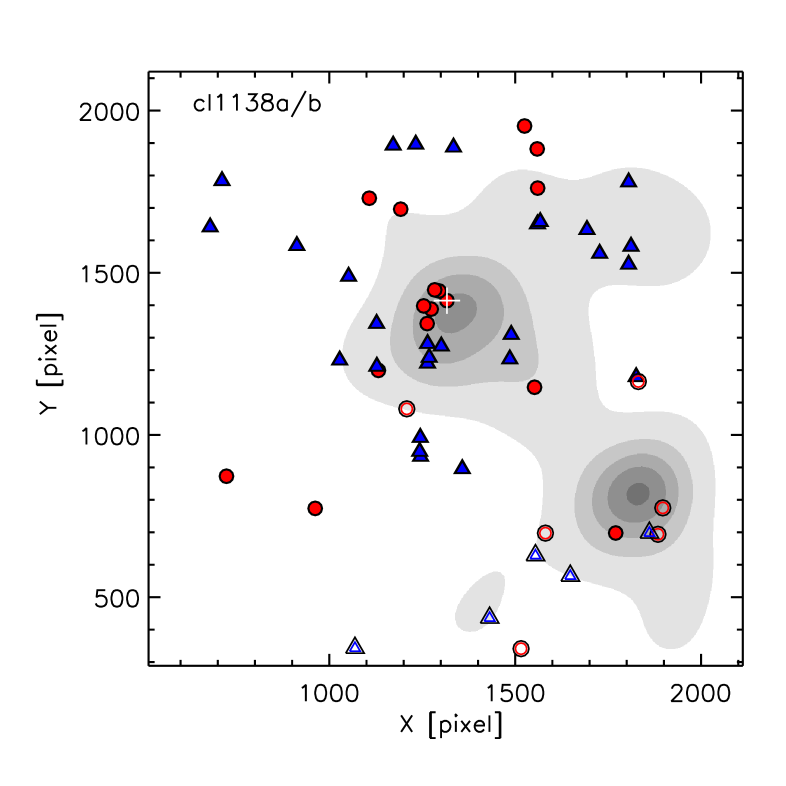
Fig. 2 shows the spatial distribution of all cluster members for cl1232 (left panel) and cl1138 (right panel), superimposed on adaptively smoothed isopleths created using all photometric redshift members in the region where both optical and near infrared data are available, and a scheme very similar to that outlined in Pisani (1993, 1996). Red circles and blue triangles mark the position of passive and active galaxies respectively, while green boxes correspond to galaxies classified as k+a. A few galaxies could not be assigned a ‘secure’ spectroscopic type222E.g. because the measurement of line intensities is contaminated by the presence of sky lines and are shown as open white circles in Fig. 2. The adaptively smoothed maps were constructed using the locations of all galaxies brighter than that have a high probability of being cluster members, according to the redshift probability distribution provided by two different photometric redshift codes (see section 3.1 in De Lucia et al. 2007 and Pelló et al. submitted). Note that we have not attempted to correct for boundary effects, so the estimated densities always drop close to the field boundaries.
Cl1232 is clearly dominated by a population of passive galaxies (about 62 per cent of all spectroscopic members) concentrated around the position of the BCG, which is marked by a white cross in Fig. 2. About 25 per cent of all members have an emission-line spectrum. These galaxies appear more uniformly distributed, with a small concentration in the north-west corner of the image, which might correspond to a small sub-clump infalling onto the main body of the cluster (this is confirmed by a Dressler-Shectman test on the available spectroscopy). Among all spectroscopic members of cl1232, we find 6 that are classified as post-starburst galaxies. Two of these are in common between the EDisCS sample and the sample presented in this study. One of them was classified as ‘passive’ on the basis of the available EDisCS spectroscopy, but is classified as k+a according to our deeper spectra. Most of the k+a galaxies are located in the southern region of the cluster and do not appear to reside preferentially in regions of high density. Interestingly, two of these galaxies are located in the south-west corner of the image, where our weak lensing reconstruction detects a second peak at more than significance (Clowe et al., 2006). This could suggest that these k+a galaxies originate in infalling groups from e.g. interactions with the intra-cluster medium. Unfortunately, however, these two galaxies are located very close to the field boundary, where our density reconstruction is not accurate.
The right panel of Fig. 2 shows the spatial distribution of spectroscopic members for both clusters identified in the field of cl1138, and the corresponding isopleths. Filled symbols represent the spectroscopic members of the main cluster, while open symbols correspond to the secondary clump in this field. The spectral properties of cl1138 are quite different from those of cl1232. Our EDisCS spectroscopy does not include any galaxy classified as post-starburst, and the star-forming galaxy fraction is twice as large in cl1138 as it is in cl1232 (Poggianti et al., 2006). The photometric redshift uncertainty does not allow us to isolate members of the two clusters in the field of cl1138, so that both of them appear in the corresponding isopleths.
4 Colour-magnitude relation
In De Lucia et al. (2007), we analysed the colour-magnitude relation of all clusters in the EDisCS sample and showed, confirming our previous findings, that the high redshift EDisCS clusters exhibit a significant deficit of faint red galaxies. Our results were later confirmed by an independent analysis of the red-sequence luminosity function of the EDisCS clusters (Rudnick et al., 2009). As mentioned in Section 1, we interpret these results in terms of a progressive build-up of the faint end of the red-sequence with decreasing redshift, possibly due to star formation being suppressed in infalling galaxies by the hostile cluster environment. In this section, we revisit our results for cl1232 using the new spectroscopic data presented in this study, and reanalyse our results for cl1138.
Fig. 3 shows the colour-magnitude diagram for the cluster cl1232. Small black open circles show galaxies for which the photometric redshift measurements provide a high probability of cluster membership, while larger symbols show spectroscopically confirmed members with (blue triangles) and without emission lines (red circles), and with a post-starburst spectrum (green boxes). The few spectroscopic members with uncertain spectral type are shown as filled black circles, and lie almost exactly on the faint end of the red-sequence for this cluster. The solid black line in Fig. 3 shows the best-fit relation to the red-sequence used in De Lucia et al. (2007), which was obtained by applying the bi-weight estimator (Beers, Flynn & Gebhardt, 1990) for the members without emission lines in their spectra, and adopting a fixed slope of . The grey shaded region corresponds to the region used for our target selection. As in De Lucia et al. (2007), we used magnitudes and colours measured within a fixed circular aperture with radius, corrected for Galactic extinction.
The data shown in Fig. 3 demonstrate that the best-fit relation used in De Lucia et al. (2007) provides a good fit to the observed red-sequence, down to the magnitude limit sampled by the new data presented in this study (we recall that the EDisCS spectroscopy extends down to 22 in the I-band for this cluster - see Fig. 1 in De Lucia et al. 2007). The dashed red line in Fig. 3 shows the best-fit relation obtained using the additional spectroscopic information presented in this work, and leaving both the zero-point and the slope of the relation free to vary. In this case, we derive a best-fit slope of , in very good agreement with the fixed slope adopted in our previous study.
Our fitting procedure measures a scatter of . Interestingly, this scatter is comparable to the scatter measured for a sample of clusters at similar redshift, observed with HST by Ellis et al. (1997)333Note that Ellis et al. (1997) estimated the rms scatter about the mean regression from the mean absolute deviation, which would generally yield a lower value than that provided by the method adopted in this study.. Uncertainties in the fit coefficients given above were estimated by bootstrapping the available data from 100 Monte Carlo simulations.
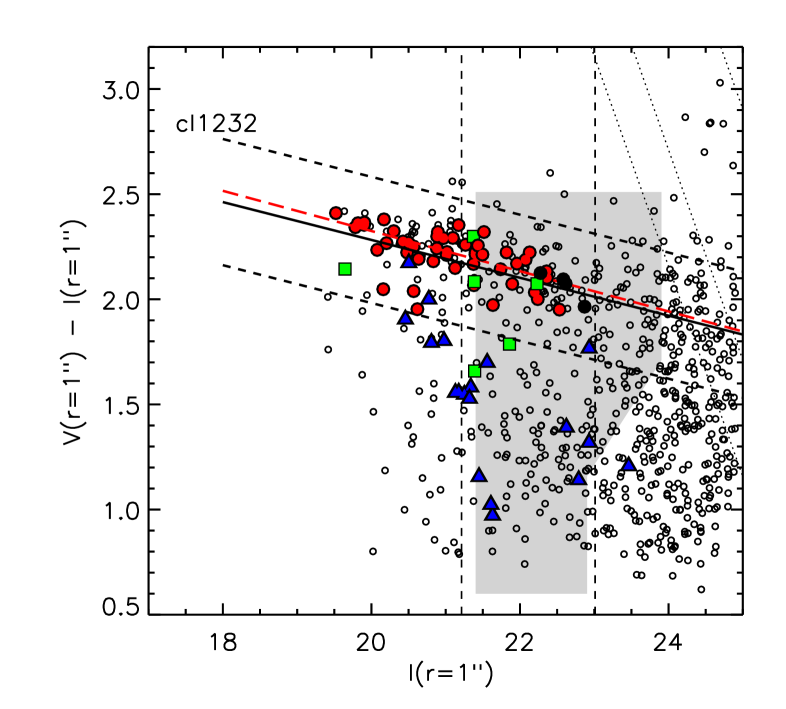
As noted in the previous section, cl1232 has a substantial population of passive galaxies that lie on a relatively tight red-sequence. The spectroscopic members with emission lines in their spectrum scatter below the best-fit relation, with a few of them having colours compatible with those of members with an absorption-line spectrum. Of the six members that have been classified as post-starburst galaxies, four of them have V-I colour within mag from the best-fit relation (dashed lines), and two are slightly bluer. Our data seem to exclude a large (larger than the number obtained on the basis of the EDisCS spectroscopy for brighter galaxies) population of post-starburst galaxies at faint magnitudes (), as found for the Coma cluster (Poggianti et al., 2004).
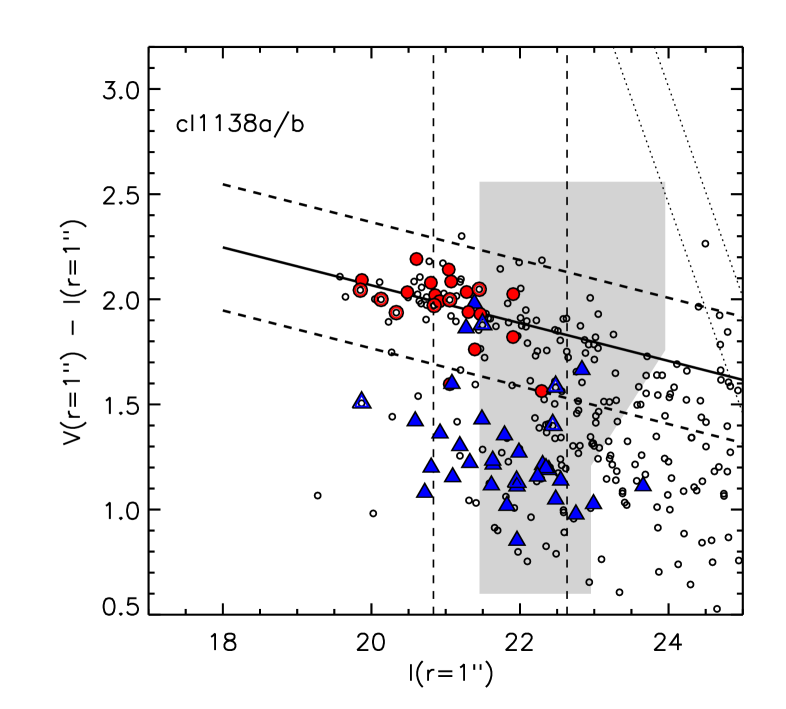
As discussed in Sec. 3, there is a large variation in the spectral composition of clusters at similar redshift. It is therefore interesting to compare the colour-magnitude relation of the cl1232 cluster to that of cl1138. This is shown in Fig. 4, using the same colour-coding adopted in Fig. 3. Spectroscopic members of the secondary cluster in the field of cl1138 are shown as empty symbols. The black solid line shows the best-fit relation used in De Lucia et al. (2007), while the dashed lines correspond to mag from it. For this cluster, a fit of the red-sequence using only members with an absorption line spectrum does not converge when leaving both the slope and the zero-point of the relation free to vary. Fig. 4 shows a tight red-sequence at bright magnitudes, with few passive members scattering below the best-fit relation at fainter magnitude. The population of active galaxies, more copious than for the cluster cl1232, is characterised by significantly blue colours, although a few members with emission lines in their spectra reside within mag from the best-fit red-sequence.
Figs. 3 and 4 show that the relative proportions of red and blue galaxies are quite different for the two clusters under consideration. In addition, as noted in the previous section, no spectroscopic member of cl1138 has been classified as ‘post-starburst’.
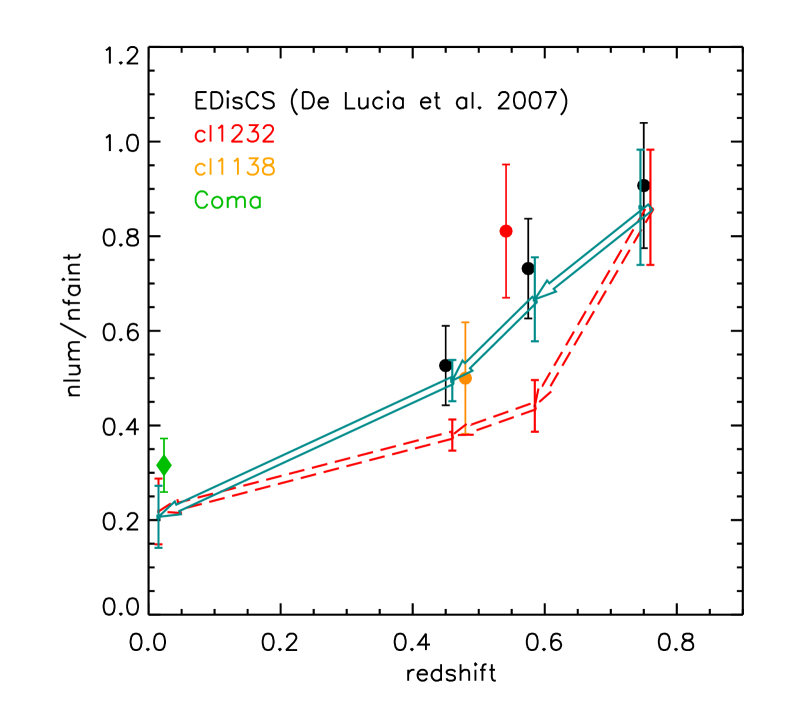
To analyse the distribution of red-sequence galaxies, we measure the ‘luminous-to-faint’ ratio, following the same definitions adopted in De Lucia et al. (2007). We use all galaxies that lie within mag from the best-fit colour-magnitude relation, measured using a fixed slope of . We then define as ‘luminous’ all galaxies brighter than , and as ‘faint’ all galaxies fainter than this and brighter than . The conversion from observed I-band magnitudes to rest-frame V-band magnitudes has been made by assuming a single burst model with redshift of formation , and takes into account passive evolution to redshift zero. The luminous-to-faint ratio measured444The measurement includes the new spectroscopic information discussed in this study, but it does not differ significantly from that obtained using EDisCS spectroscopy only. for cl1232 is shown as a red circle in Fig. 5, while the orange circle shows the corresponding measurement for the cluster cl1138. The black circles with error bars show the average luminous-to-faint ratio measured by binning 15 EDisCS clusters as discussed in De Lucia et al. (2007), and the green diamond shows the corresponding value measured for the Coma cluster. We recall that the EDisCS values shown in Fig. 5 have been obtained by averaging the measurements for different choices of cluster membership criteria and area. A conservative choice was adopted for the error bars, which were also averaged rather than combined in quadrature. Since our previous work demonstrated that results were not affected significantly by the use of different cluster membership criteria, the values for cl1232 and cl1138 shown in Fig. 5 have been measured by selecting members using the photometric redshift information. For cl1232, we have selected all photometric members within the maximum physical radius centred on the BCG and included in the SOFI field of view. For cl1138, we have selected the photometric members of both clusters in the field, within the SOFI field of view. The corresponding value of the luminous-to-faint ratio needs to be interpreted with caution.
Fig. 5 shows that the luminous-to-faint ratios of cl1232 and cl1138 are consistent, within the errors, with the average trend obtained considering all EDisCS clusters used in our previous study. In Fig. 5, we also show the evolution of the luminous-to-faint ratio expected using the two models described in De Lucia et al. (2007). We refer the reader to the original paper for details on the models. Briefly, these are constructed using the colour-magnitude distribution of the EDisCS clusters in the highest redshift bin, and evolving them forward in time assuming that the star formation histories of blue galaxies are truncated (‘truncation’ model) at the redshift of the observation of the cluster, or 1 Gyr later (‘delay’ model). An exponentially declining star formation history (with , , , and Gyr and redshift of formation ) is assigned to all galaxies bluer by mag than the best-fit red-sequence, by selecting the “closest model” in the colour-magnitude space. The adopted modelling is very simple and, as discussed in detail in De Lucia et al. (2007), results need to be interpreted with caution. Fig. 5 suggests that a scenario in which infalling galaxies have their star formation suppressed by the cluster environment is in qualitative agreement with the observed build-up of the colour-magnitude relation. Given the uncertainties in the modelling, however, the results discussed in our previous study and here do not yet convincingly confirm this scenario. In addition, they do not provide strong constraints on the physical process(es) responsible for the observed evolution, and on the associated time-scale(s). In the next section, we examine one specific scenario in which new additions to the colour-magnitude relation move from the blue cloud passing trough a k+a phase.
5 The importance of the k+a phase in the build-up of the red-sequence galaxy population
With the data in hand, we now attempt a first estimate of the contribution to the build-up of the colour-magnitude relation by galaxies passing through the k+a phase. Using the definitions given above, and complementing the photometric redshift information with the available spectroscopy to assign cluster membership, we have the following numbers of red luminous and faint galaxies for cl1232:
which implies a luminous-to-faint ratio of at z=0.54.
If is the age of the Universe corresponding to the redshift of the cluster555The age of the Universe corresponding to z=0.54 is Gyr., the expected number of new red galaxies at a subsequent time , associated with the k+a phase, can be written as:
where is the number of blue k+a galaxies in the magnitude bin considered. We use here only the blue post-starburst galaxies, because the red ones have already been included in the computed luminous-to-faint ratio. For consistency, we use the typical time-scale over which a k+a galaxy is blue (). In the above equation, is the number of photometric members, and is the number of luminous spectroscopic members in the same magnitude bin. The factor corrects for the incompleteness of our spectroscopic sample, assuming that the sample is representative. We note that the number of (blue) photometric members is quite uncertain (see De Lucia et al. 2007 and Rudnick et al. 2009) so that these numbers should be interpreted with caution. A similar equation can be written for the new additions to the red ‘faint’ galaxies passing through a k+a phase:
Assuming Gyr (Poggianti & Barbaro, 1997), Gyr, and considering that we observe no blue k+a galaxy in the ‘luminous’ bin, and two in the ‘faint’ bin, we obtain and . These numbers give an expected luminous-to-faint ratio at of , which is still consistent with the luminous-to-faint ratio measured for cl1232 and significantly higher than the ratio measured using all (5) EDisCS clusters in the lower redshift bin used in our previous work (black symbols in Fig. 5). When taking into account the (large) estimated uncertainties, this value becomes marginally consistent with the ratio measured at lower redshift.
The argument outlined above, however, provides a lower limit to the evolution of the luminous-to-faint ratio, because it does not account for the infall of new galaxies onto the cluster in the redshift interval considered. To obtain an estimate of the number of galaxies infalling onto a cluster similar to cl1232 between and , we use results from semi-analytic models of galaxy formation coupled to cosmological N-body simulations. In particular, we use here the model presented in De Lucia & Blaizot (2007, and references therein), which is publicly available through a SQL-queryable database666A description of the publicly available catalogues, and a link to the database can be found at the following webpage: http://www.mpa-garching.mpg.de/millennium/. The model has been shown to provide reasonable agreement with a large number of observational results both in the local Universe and at higher redshift (see the original paper and references therein for details).

Using the publicly available catalogues, we selected the 100 most massive haloes at (the available snapshot closest to the redshift of cl1232), and identified their descendants at . For each of the haloes at , we computed the line-of-sight velocity dispersion using the same procedure adopted for the EDisCS clusters (Halliday et al., 2004; Milvang-Jensen et al., 2008). We finally counted how many ‘new’ galaxies (i.e. galaxies which did not reside in the progenitor halo) are found in the descendant halo at . The black filled symbols in Fig. 6 show the number of recently accreted galaxies that are found within from the cluster centre at , and that are brighter than at . The adopted distance corresponds approximately to the maximum fraction of , for the EDisCS clusters, that lies within the region covered by the SOFI field of view. Assuming passive evolution, these galaxies will evolve into galaxies brighter than (the magnitude limit adopted in our analysis) at . The dashed vertical lines in Fig. 6 show the range of velocity dispersions corresponding to the value measured for the cluster cl1232. To illustrate how these results depend on the adopted magnitude limit, we show as empty symbols the number of recently accreted galaxies that lie within at the lower redshift considered, and that are brighter than the magnitude limit corresponding to the resolution limit of the simulation ( in the rest-frame V-band).
Fig. 6 shows that a halo with velocity dispersion similar to that measured for cl1232 accretes, on average, galaxies brighter than in the redshift interval considered, with a few haloes accreting up to new galaxies. The numbers are much lower when imposing a magnitude cut similar to the magnitude limit adopted in our analysis: when counting only galaxies brighter than -18.6 at , the average number of newly accreted galaxies is , and only two haloes in the relevant range of velocity dispersion accrete new galaxies.
Considering that the active and post-starburst galaxies in our sample have been forming stars at significant rates in the past Gyrs, and that a k+a spectrum requires a sharp truncation of the star formation activity in the past Gyr, the ratio of the number of k+a to the total number of active and k+a galaxies provides an estimate of the ‘quenching efficiency’ associated with the particular environment under consideration (see Poggianti et al., 2009). Our spectroscopic sample for the cluster cl1232 contains 6 k+a galaxies and 26 active galaxies (counting also those with a k+a spectrum), giving a quenching efficiency of per cent, in perfect agreement with the value measured by Poggianti et al. (2009, see their Table 6). We therefore expect new red galaxies at , which can be added to the numbers computed above on the basis of the observed number of blue k+a galaxies. If we assume that all new galaxies accreted onto the cluster end up on the ‘faint’ end of the colour-magnitude relation - which maximises the evolution of the luminous-to-faint ratio - we obtain:
With , the above equation gives . Even maximizing the number of newly accreted galaxies (), the expected luminous-to-faint ratio at becomes , which is not significantly different from the ratio obtained on the basis of the observed number of blue k+a galaxies. The number of newly accreted galaxies necessary to bring the expected luminous-to-faint ratio into agreement with the value measured at is , much larger than the numbers measured for any of the haloes shown in Fig. 6, even when counting all galaxies down to the resolution limit of the simulation.
The argument outlined in this section suggests that the observed number of k+a galaxies in cl1232 is too low to account for the observed progressive build-up of the faint red-sequence galaxy population. Cl1232 is only one cluster, and we know that there is a large cluster-to-cluster variation. The only other cluster for which we have as deep spectroscopy at approximately the same redshift is cl1138. As explained above, no spectroscopic member of this cluster is classified as post-starburst, so no new red galaxy addition to the faint end of the red-sequence is expected to pass through a k+a phase for this cluster. On the basis of available data then, k+a galaxies do not seem to play an important role in the building-up of the colour-magnitude relation of intermediate redshift clusters. More data are necessary, however, to draw statistically robust conclusions.
6 Discussion and conclusions
We present new spectroscopic observations for a cluster at intermediate redshift (cl1232 at z=0.54). The cluster belongs to the sample studied by the ESO Distant Cluster Survey (EDisCS) and the new data presented here extend the available spectroscopy by about 1 magnitude. Cl1232 has a large fraction of passive galaxies, and exhibits a well defined and relatively tight colour-magnitude relation. Among its spectroscopic members, we find six galaxies that can be classified as ‘post-starburst’ (k+a) systems, on the basis of the lack of significant emission and strong Balmer lines in absorption. The EDisCS sample contains another cluster (cl1138) at similar redshift that was originally targeted as a high-redshift () cluster, and whose spectroscopy extends down to similar limiting magnitude as that obtained for cl1232. Cl1138 is characterized by a significantly higher fraction of active galaxies and by a less populated (although still relatively tight) colour-magnitude relation. Among its spectroscopic members, no galaxy shows signs of recent truncation of star-formation history. At , cl1232 and cl1138 are the only two clusters for which unbiased and complete spectroscopic samples are available down to . The measured numbers of k+a galaxies are low (nominally zero for cl1138), and the available data exclude a large population of post-starburst galaxies at faint magnitudes.
Post-starburst galaxies represent a class of galaxies in the process of transition from blue actively star-forming population to red quiescent galaxies. Therefore, they are of significant interest in constraining the physical processes driving the progressive build-up of the colour magnitude relation observed in our previous work, and later confirmed by independent studies using different data-sets. We recall that strong Balmer absorption lines appear when the star formation in a galaxy is switched off rapidly. Spectra with strong Balmer lines ( Å), require the truncation to be preceded by a short-lived starburst. K+a spectra with moderate Balmer line intensities, like most of those measured in our study, might represent post-starburst galaxies in a later evolutionary stage, but can also be produced by truncation of ‘normal’ star formation activity. Therefore, the data presented here allow us to test one specific scenario in which new additions to the red-sequence are galaxies that have had their star-formation histories ‘truncated’ by the hostile cluster environment in their recent past.
Through simple calculations, we have shown that the observed low numbers of k+a galaxies do not appear sufficient to account for the measured increase in the faint red-sequence galaxy population. This conclusion remains valid even when accounting for the infall of new galaxies onto the cluster, and adopting the very conservative assumption that these all migrate towards the faint-end of the red-sequence. These arguments are even stronger in the case of cl1138, which does not contain any spectroscopic member with a k+a spectrum. Although they contribute at some level (and for some clusters) to the observed evolution of the faint red-sequence, post-starburst galaxies do not represent the main channel for the production of new faint red-sequence galaxies at intermediate redshift. If this population does originate from the blue galaxies observed in distant clusters, as we speculated in our previous work, the ‘quenching’ of the star formation probably occurs on longer time-scales (i.e. it is not a truncation) or, alternatively, the signature of a post-starburst phase might be too weak to be detected in our spectroscopic sample with the adopted classification.
In a recent study, Wild et al. (2008) used a principal component analysis of the spectra from the VIMOS VLT Deep Survey (VVDS) to identify galaxies with strong Balmer absorption lines, and estimated that galaxies that have passed through a strong post-starburst phase account for per cent of the growth in the red-sequence at . A direct comparison with our results is, however, difficult: we focus on a restricted redshift interval and on the cluster environment, while the results of Wild et al. refer to the general ‘field’ red-sequence, and provide an estimate of the contribution of post-starburst galaxies to the red-sequence growth for . In addition, it is difficult to compare our simple classification of k+a galaxies based on the equivalent widths of the [OII] and H lines with the more sophisticated method adopted in Wild et al. (2008). We note also that ‘pre-processing’ happening in other environments (e.g. groups of galaxies infalling onto the cluster) could help to reconcile our results with those of Wild and collaborators.
Our results are based on only two clusters with large differences in their spectral population, and we know that the fraction of post-starburst galaxies can show large cluster-to-cluster variations (Poggianti et al., 2009). Because of bad weather, our spectroscopic programme could not be completed, and the quality of our spectra is too low to perform a detailed spectroscopic analysis. Higher quality spectra can be obtained at this redshift and for the magnitude range considered in this study. With these data, it might be possible to detect signs of recent star formation activity in galaxies that we have classified as ‘passive’. It is clear that a larger sample of clusters with deeper spectroscopy would be needed to quantify the importance of the post-starburst phase in building-up the observed colour-magnitude relation in galaxy clusters.
Acknowledgements
Based on observations collected at the European Southern Observatory, Chile, as part of programme 073.A-0216. The Dark Cosmology Centre is funded by the Danish National Research Foundation. The Millennium Simulation databases used in this paper and the web application providing online access to them were constructed as part of the activities of the German Astrophysical Virtual Observatory. GDL thanks Nina Novak for precious advice on data reduction and Vivienne Wild for useful discussions, acknowledges the hospitality of the Kavli Institute for Theoretical Physics of Santa Barbara, where part of this paper was written, and financial support from the European Research Council under the European Community’s Seventh Framework Programme (FP7/2007-2013)/ERC grant agreement n. 202781. IRS acknowledges support from the STFC.
References
- Andreon (2008) Andreon S., 2008, MNRAS, 386, 1045
- Appenzeller et al. (1998) Appenzeller I. et al., 1998, The Messenger, 94, 1
- Arimoto & Yoshii (1987) Arimoto N., Yoshii Y., 1987, A&A, 173, 23
- Baum (1959) Baum W. A., 1959, PASP, 71, 106
- Beers et al. (1990) Beers T. C., Flynn K., Gebhardt K., 1990, AJ, 100, 32
- Bekki et al. (2001) Bekki K., Shioya Y., Couch W. J., 2001, ApJ, 547, L17
- Blake et al. (2004) Blake C. et al., 2004, MNRAS, 355, 713
- Clowe et al. (2006) Clowe D. et al., 2006, A&A, 451, 395
- Couch & Sharples (1987) Couch W. J., Sharples R. M., 1987, MNRAS, 229, 423
- De Lucia & Blaizot (2007) De Lucia G., Blaizot J., 2007, MNRAS, 375, 2
- De Lucia et al. (2004) De Lucia G. et al., 2004, ApJ, 610, L77
- De Lucia et al. (2007) De Lucia G. et al., 2007, MNRAS, 374, 809
- de Vaucouleurs (1961) de Vaucouleurs G., 1961, ApJS, 5, 233
- Desai et al. (2007) Desai V. et al., 2007, ApJ, 660, 1151
- Dressler & Gunn (1983) Dressler A., Gunn J. E., 1983, ApJ, 270, 7
- Dressler et al. (1999) Dressler A., Smail I., Poggianti B. M., Butcher H., Couch W. J., Ellis R. S., Oemler A. J., 1999, ApJS, 122, 51
- Ellis et al. (1997) Ellis R. S., Smail I., Dressler A., Couch W. J., Oemler A. J., Butcher H., Sharples R. M., 1997, ApJ, 483, 582
- Faber (1973) Faber S. M., 1973, ApJ, 179, 731
- Ferreras et al. (1999) Ferreras I., Charlot S., Silk J., 1999, ApJ, 521, 81
- Fontanot et al. (2009) Fontanot F., De Lucia G., Monaco P., Somerville R. S., Santini P., 2009, ArXiv:0901.1130
- Gallazzi et al. (2006) Gallazzi A., Charlot S., Brinchmann J., White S. D. M., 2006, MNRAS, 370, 1106
- Gilbank et al. (2008) Gilbank D. G., Yee H. K. C., Ellingson E., Gladders M. D., Loh Y.-S., Barrientos L. F., Barkhouse W. A., 2008, ApJ, 673, 742
- Gonzalez et al. (2001) Gonzalez A. H., Zaritsky D., Dalcanton J. J., Nelson A., 2001, ApJS, 137, 117
- Halliday et al. (2004) Halliday C. et al., 2004, A&A, 427, 397
- Kelson (2003) Kelson D. D., 2003, PASP, 115, 688
- Kodama & Arimoto (1997) Kodama T., Arimoto N., 1997, A&A, 320, 41
- Kodama et al. (1998) Kodama T., Arimoto N., Barger A. J., Aragón-Salamanca A., 1998, A&A, 334, 99
- Kodama et al. (2004) Kodama T. et al., 2004, MNRAS, 350, 1005
- Mei et al. (2008) Mei S. et al., 2008, ArXiv: 0810.1917
- Milvang-Jensen et al. (2008) Milvang-Jensen B. et al., 2008, A&A, 482, 419
- Nelan et al. (2005) Nelan J. E., Smith R. J., Hudson M. J., Wegner G. A., Lucey J. R., Moore S. A. W., Quinney S. J., Suntzeff N. B., 2005, ApJ, 632, 137
- Newberry et al. (1990) Newberry M. V., Boroson T. A., Kirshner R. P., 1990, ApJ, 350, 585
- Pisani (1993) Pisani A., 1993, MNRAS, 265, 706
- Pisani (1996) Pisani A., 1996, MNRAS, 278, 697
- Poggianti & Barbaro (1997) Poggianti B. M., Barbaro G., 1997, A&A, 325, 1025
- Poggianti et al. (2001) Poggianti B. M., Bridges T. J., Carter D., Mobasher B., Doi M., Iye M., Kashikawa N., Komiyama Y., Okamura S., Sekiguchi M., Shimasaku K., Yagi M., Yasuda N., 2001, ApJ, 563, 118
- Poggianti et al. (2004) Poggianti B. M., Bridges T. J., Komiyama Y., Yagi M., Carter D., Mobasher B., Okamura S., Kashikawa N., 2004, ApJ, 601, 197
- Poggianti et al. (2006) Poggianti B. M. et al., 2006, ApJ, 642, 188
- Poggianti et al. (2009) Poggianti B. M. et al., 2009, ApJ, 693, 112
- Rudnick et al. (2009) Rudnick G., von der Linden A., Pello R., Aragon-Salamanca A., Marchesini D., Clowe D., De Lucia G., Halliday C., Jablonka P., Milvang-Jensen B., Poggianti B., Saglia R., Simard L., White S., Zaritsky D., 2009, ArXiv e-prints
- Smail et al. (1998) Smail I., Edge A. C., Ellis R. S., Blandford R. D., 1998, MNRAS, 293, 124
- Stott et al. (2007) Stott J. P., Smail I., Edge A. C., Ebeling H., Smith G. P., Kneib J.-P., Pimbblet K. A., 2007, ApJ, 661, 95
- Thomas et al. (2005) Thomas D., Maraston C., Bender R., Mendes de Oliveira C., 2005, ApJ, 621, 673
- van Dokkum & Franx (1996) van Dokkum P. G., Franx M., 1996, MNRAS, 281, 985
- Visvanathan & Sandage (1977) Visvanathan N., Sandage A., 1977, ApJ, 216, 214
- White et al. (2005) White S. D. M. et al., 2005, A&A, 444, 365
- Wild et al. (2008) Wild V., Walcher C. J., Johansson P. H., Tresse L., Charlot S., Pollo A., Le Fevre O., de Ravel L., 2008, ArXiv:0810.5122
- Yan et al. (2008) Yan R. et al., 2008, ArXiv:0805.0004
- Zabludoff et al. (1996) Zabludoff A. I., Zaritsky D., Lin H., Tucker D., Hashimoto Y., Shectman S. A., Oemler A., Kirshner R. P., 1996, ApJ, 466, 104