44email: acorsico,aromero,althaus@fcaglp.unlp.edu.ar; garcia@fa.upc.edu
Hot C-rich white dwarfs: testing the DB–DQ transition through pulsations
Abstract
Context. Hot DQ white dwarfs constitute a new class of white dwarf stars, uncovered recently within the framework of the SDSS project. There exist nine of them, out of a total of several thousands white dwarfs spectroscopically identified. Recently, three hot DQ white dwarfs have been reported to exhibit photometric variability with periods compatible with pulsation -modes.
Aims. Here, we present a nonadiabatic pulsation analysis of the recently discovered carbon-rich hot DQ white dwarf stars. One of our main aims is to test the convective-mixing picture for the origin of hot DQs through the pulsational properties.
Methods. Our study relies on the full evolutionary models of hot DQ white dwarfs recently developed by Althaus et al. (2009), that consistently cover the whole evolution from the born-again stage to the white dwarf cooling track. Specifically, we present a stability analysis of white dwarf models from stages before the blue edge of the DBV instability strip ( K) until the domain of the hot DQ white dwarfs ( K), including the transition DBhot DQ white dwarf. We explore evolutionary models with and , and two values of the thickness of the He-rich envelope ( and ). These envelopes are orders of magnitude thinner than those of standard DB white dwarf models resulting from canonical stellar evolution computations.
Results. We found that at evolutionary phases in which the models are characterized by He-dominated atmospheres, they exhibit unstable -mode pulsations typical of DBV stars, and when the models become DQ white dwarfs with carbon-dominated atmospheres, they continue being pulsationally unstable with similar characteristics than DB models, and in agreement with the periods detected in variable hot DQ white dwarfs. In particular, for models with there exists a narrow gap separating the DB and DQ instability domains.
Conclusions. Our calculations provide strong support to the convective-mixing picture for the formation of hot DQs. In particular, our results point to the existence of pulsating DB white dwarfs with very thin He-rich envelopes, which after passing the DBV instability strip become variable hot DQ stars. The existence of these DB stars with very thin envelopes could be investigated through asteroseismology.
Key Words.:
stars: evolution — stars: interiors — stars: oscillations — white dwarfs1 Introduction
The recent years have witnessed a great deal of work in the field of white dwarf stars. A recent example is the unexpected discovery of a population of white dwarfs characterized by carbon-dominated atmospheres at effective temperatures between and K — also known as hot DQ white dwarfs (Dufour et al. 2007). This finding immediately attracted the attention of many researchers because the existence of these stars poses a challenge to the theory of stellar evolution, and could be indicative of the existence a new evolutionary channel of white-dwarf formation.
Dufour et al. (2008) proposed and evolutionary scenario to explain the origin of hot DQ white dwarfs. In this scenario, undetected amounts of He () remaining in the C- and O-rich outer layers of a PG1159 star like the exotic object H1504+65 would be forced to float at the surface due to gravitational separation, leading to a He-dominated white dwarf, first of the spectral class DO and later of the spectral class DB. In this picture, a C-rich atmosphere should eventually emerge as the result of convective mixing at lower effective temperatures. The first quantitative assessment of such diffusive/convective mixing scenario has been recently presented by Althaus et al. (2009). Using full evolutionary models that consistently cover the evolution from the born-again stage to the white dwarf cooling track, these authors presented strong theoretical evidence supporting this picture for the formation of hot DQs and the existence of an evolutionary link between these stars and the PG1159 stars, including H1504+65. It is worth mentioning that the models of Althaus et al. (2009) are characterized by a He content ranging from to .
Even when the impact of the discovery of DQ white dwarfs had not declined, Montgomery et al. (2008) reported on the finding of the first variable hot DQ star, SDSS J142625.70575218.4 (with and K), with a confirmed period s. Shortly after, Barlow et al. (2008) reported on the discovery of two additional variable hot DQ stars, SDSS J220029.08074121.5 (, K) and SDSS J234843.30094245.3 (, K), with periods s and s, respectively. The measured periodicities have been interpreted as nonradial -mode pulsations, similar to the well-studied pulsations of the GW Vir, V777 Her and ZZ Ceti classes of white-dwarf variables. The pulsation hypothesis, however, has been defied by the possibility that these stars could be AM CVn systems, due to the similarity exhibited in the pulse shape of the light curves (Montgomery et al. 2008). On the other hand, a compelling argument against the interacting binary hypothesis is that it does not explain why all hot DQ white dwarfs are grouped within the same range of temperatures, and none at higher or lower effective temperatures (Dufour et al. 2009). Ultimately, the confirmation of the pulsating nature of the variable hot DQ white dwarfs could came from the discovery of multiperiodicity. Following this line of reasoning, Fontaine et al. (2009) have recently announced the discovery of an additional period s (apart from the already known at s) in SDSS J142625.70575218.4.
The theoretical quest of the origin of variability in hot DQ stars has been addressed by Fontaine et al. (2008), who studied the hypothesis that the variability was due to pulsations. Their full nonadiabatic analysis revealed that -modes can be excited in the range of temperature where real DQs are found (below K) only if the models are characterized by substantial amounts of He () in their C-rich envelopes. In a subsequent effort, Dufour et al. (2008) estimated the , and C/He ratio for the nine known hot DQ stars and constructed a dedicated stellar model for each object using the same modeling as in Fontaine et al. (2008). By using a nonadiabatic approach, Dufour et al. (2008) predicted that only SDSS J14265752 should exhibit pulsations, and failed to predict variability in SDSS J220029.08074121.5 and SDSS J234843.30094245.3. However, it appears that the pulsation models of Fontaine et al. (2008) and Dufour et al. (2008) are not entirely consistent with their proposed evolutionary picture for the formation of hot DQs. Indeed, the background models they assumed for their stability calculations are characterized by a He content several orders of magnitude larger than the content of He required by their evolutionary scenario to work (Dufour et al. 2008). In fact, the bottom of the He-dominated envelope in their stellar models is located at a fractional mass depth of (Fontaine et al. 2008).
In this work, we perform a nonadiabatic analysis of the pulsations of hot DQ white dwarfs on the basis of the full evolutionary models recently developed by Althaus et al. (2009). The models consistently cover the whole evolution from the born-again stage to the hot DQ white dwarf domain. As it will be shown below, we are able to get a pulsational picture of the variable hot DQ white dwarfs that is entirely consistent with the diffusive/convective mixing evolutionary scenario proposed for their formation. The paper is organized as follows. In Sect. 2 we briefly describe some aspects of the stellar evolution and pulsation modeling we employ in the present work. Sect. 3 is devoted to describe to a some extent the diffusive/convective-mixing scenario. We elaborate on our stability analysis in Sect. 4. Finally, Sect. 5 is devoted to summarize our results.
2 Stellar and pulsation modeling
The stellar models employed in this work have been generated with the LPCODE stellar evolutionary code employed in our previous study of the formation of H-deficient post-AGB stars via a born-again episode — see Althaus et al. (2005) and Miller Bertolami & Althaus (2006) for details about the code. The code is specifically designed to compute the formation and evolution of white dwarf stars. In LPCODE, special emphasis is given to the treatment of the changes of the chemical abundances, including diffusive overshooting and non-instantaneous mixing, which are of primary importance in the calculation of the thermal pulses and born-again stage that lead to the formation of PG1159 stars. Of relevance for the present study, we mention that convection is treated within the formalism of the mixing length theory as given by the ML2 parametrization (Tassoul et al. 1990). We note that this parametrization leads to a theoretical blue edge of the DB instability strip consistent with observations (Beauchamp et al. 1999; Córsico et al. 2008).
The white dwarf evolutionary sequences employed in our stability study correspond to those developed in Althaus et al. (2009) to explore the formation of hot DQs via the diffusive/convective mixing scenario. The initial stellar models for those sequences are realistic PG1159 stellar configurations derived from the full evolution of their progenitor stars (Miller Bertolami & Althaus 2006). In particular, we have considered sequences with stellar masses of and . The chemical stratification of the initial models consists of a CO core, which is the result of core He burning in prior stages, surrounded by a He-, C- and O-rich envelope, in agreement to what is observed in PG1159 stars. The fractional mass of the He-rich envelope is in the range . The sequence with was specifically computed by Althaus et al. (2009) to explore the evolutionary connection between H1504+65 and hot DQ white dwarfs. For this stellar mass, the He content of corresponds to the maximum He content expected in H1504+65 if we assume a post-born-again origin for this star (Miller Bertolami & Althaus 2006). The evolutionary calculations have been computed from K down to the domain of effective temperatures typical of hot DQs ( K).
The pulsation stability analysis was performed with the finite-difference nonadiabatic pulsation code described in Córsico et al. (2006). The code solves the full sixth-order complex system of linearized equations and boundary conditions as given by Unno et al. (1989). Our code provides the dimensionless complex eigenvalue () and eigenfunctions according the formulation given in Unno et al. (1989). Nonadiabatic pulsation periods and normalized growth rates are evaluated as and , respectively. Here, and are the real and the imaginary part, respectively, of the complex eigenfrequency . Our code also computes the differential work function, , and the running work integral, , as in Lee & Bradley (1993). These functions are extremely useful for determining the driving and damping regions of the stellar models. As in Fontaine et al. (2008) and Dufour et al. (2008), our nonadiabatic computations rely on the frozen-convection approximation, in which the perturbation of the convective flux is neglected. While this approximation is known to give unrealistic locations of the red edge of instability, it leads to satisfactory predictions for the location of the blue edge of the ZZ Ceti (DAV) instability strip — see Brassard & Fontaine (1999) — and also for the V777 Her (DBV) instability strip — see Beauchamp et al. (1999) and, more recently, Córsico et al. (2008).
3 Evolutionary results: the diffusive/convective mixing scenario
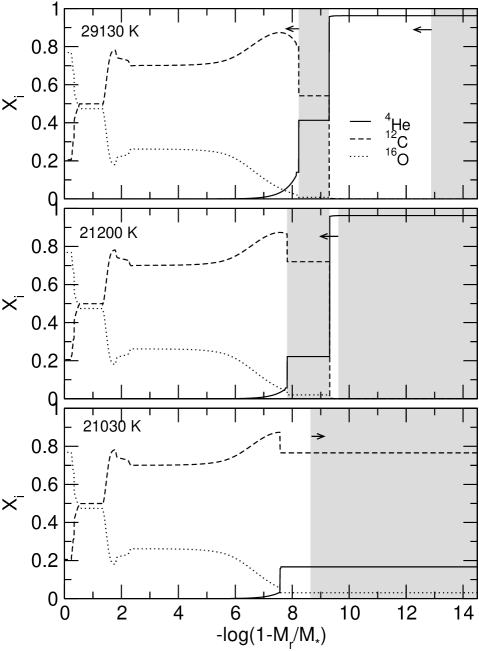
Let us briefly summarize the diffusive/convective mixing picture developed by Althaus et al. (2009) to explain the origin of the hot DQs. In this scenario, the starting models are realistic PG1159 stellar configurations with small contents of residual He, being the fractional masses in the range . At the beginning of the hot phase of white-dwarf evolution, the chemical abundance distribution of the envelope of PG1159 stars is drastically modified by gravitational settling that forces He to float at the surface and heavier elements (C and O) to sink. As a result, the star becomes a DO white dwarf with a very thin He-rich envelope. With further cooling, the star reaches the domain of DB white dwarfs ( K). The upper panel of Fig. 1 shows the internal abundance distribution of 4He, 12C, and 16O for a selected model with , , and K. Note that, at this effective temperature, the DB model star is characterized by a inward-growing outer He convection zone (gray region) which is due to the recombination of Heii. In addition, there is a convective intershell region at . The existence of this convection zone is the consequence of the large opacity of the C-enriched layers below the pure He envelope. As the model star cools, the bottom of this convection region moves inwards, thus increasing the C abundance there, as shown in the middle panel of Fig. 1 that corresponds to a DB model at K. At this stage, the bottom of the outer convection region is very close to the upper boundary of the intershell convective region. Shortly after, both convection zones eventually merge, and a very efficient mixing episode — favoured by the presence of the inthershell convection zone — leads to an envelope rich in C and He (, ), with a trace abundance of O (). As a result the DB white dwarf model appears as a hot DQ white dwarf. The chemical abundance distribution at this stage is depicted in the bottom panel of Fig. 1 ( K).
The evolution following the merger of the convection zones is difficult to model. In fact, once the C-rich convective envelope has developed, it is expected a substantial depletion of carbon in the whole convective envelope. Indeed, the diffusion timescale at the base of the convection zone of the newly formed DQ is about yr, substantially shorter than the cooling timescale, of about yr. Hence, we expect that the hot DQ stage is indeed a short-lived phase, after which the star should recover quickly its identity as a He-atmosphere DB white dwarf. The picture is complicated further because the change in composition in the convective envelope will lead to changes in the depth of the convection zone, which will affect, in turn, the timescales of diffusion. Our numerical treatment of diffusion does not allow to properly follow this feedback between convection and diffusion. It is not discarded that the star experiences additional mixing episodes, eventually reaching some stationary situation below K in which the star would be a He-rich DB white dwarf with traces of C, that is, a DQ white dwarf like the ones observed at such effective temperatures (see, e.g., Bergeron et al. 2001). Additional computations would be needed to test this possibility.

The evolution described above is qualitatively similar for the remainder sequences analyzed here. However, the effective temperature at which the transition from DB to DQ white dwarf takes place, and the final surface chemical abundances, vary for different He contents and different stellar masses. For instance, in the case of the sequence with and , the transition occurs at K, an effective temperature somewhat lower than for the case in which the He content is 20 times smaller ( K). On the other hand, the final abundance of C at the surface is markedly smaller for larger He contents. This trend is in line with observations (Dufour et al. 2008). If we consider more massive models and a fixed value of , the transition from DB to DQ takes place at somewhat lower effective temperatures (Althaus et al. 2009). To better clarify this point, we show in Fig. 2 the evolution of the convection zones in terms of the effective temperature for the two stellar masses and He contents analyzed in this paper. Note that for effective temperatures below K, the more massive sequence is characterized by deeper He convection envelopes. But for temperature less than about K, this trend is reversed and the less massive sequence is characterized by a deeper He convection envelope. By this effective temperature, the base of the He convection zone is close to the outer edge of the convective intershell region in the sequence with , and so we expect that the DQ is formed at about the same effective temperature in both stellar masses. For the sequence with , cleary the DQ formation is expected at a substantially lower effective temperature in the more massive model. Note also that the rate of inward increase of the base of the He convection zone by the time it approaches the convective carbon intershell is slowed down. This is due to the presence of traces of carbon left by chemical diffusion. The presence of trace carbon just above the outer edge of the convective intershell region leads to larger radiative opacities, larger temperature gradients and eventually to shallower convection zones, as compared with the behaviour expected in pure He envelopes.
Hitherto, we have described in some detail the diffusive/convective mixing scenario that is able to explain the formation of the hot DQ white dwarfs from DB white dwarfs with thin He-rich envelopes. At present, observations firmly indicate that DB white dwarfs exhibit pulsations at effective temperatures between K and K (the DBV instability strip), and that DQ white dwarfs show photometric variations at K. At this point, the question arises to whether the diffusive/convective mixing picture may also be able to predict the existence of the DB instability strip and the DQ instability domain at the effective temperatures demanded by the observations. In the next section we perform a stability analysis that will help us to answer this question.
4 Stability calculations
In this section we present a detailed pulsation stability analysis of our set of DB and DQ white dwarf models. As mentioned, numerical difficulties prevented us from following the further evolution of our DQ sequences far beyond the transition from DB to DQ white dwarf. Thus, we are restricted to study mainly the location of the blue edge of the DQ instability domain, its dependence with stellar mass and the content of He, and the stability properties of DQ models located near this blue edge. In the actual state of affairs, the study of these important properties characterizing the variable DQ white dwarfs on the basis of a self-consistent evolutionary picture is very timely and relevant.
We analyze the pulsational stability of about 800 stellar models covering a wide range of effective temperatures ( K) and stellar masses of and . For each mass value, we consider two values of the He content: and . For each stellar model we have studied the stability of -modes with periods in the range s, thus comfortably embracing the full period spectrum observed in variable DB and DQ stars.
4.1 Template models
We start by discussing the stability properties of two template white dwarf models picked out from the evolutionary sequence with and . One of these models is a DB white dwarf model ( K), and the other one is a hot DQ white dwarf model ( K). The normalized growth rate () in terms of pulsation periods () for overstable modes corresponding to these models is shown in Fig. 3. Note that modes excited in the DB model have pulsation periods in the range s, substantially longer than those excited in the DQ model ( s). For the DB model, reaches a strong maximum at a period of about s. In average, for this model the excitation is stronger for modes characterized by short periods, although at the edges of the instability band the value of notably drops. On the other hand, for the DQ model the modes with longer periods are more favoured for excitation, being the value of the growth rate for the shortest periods more than seven order of magnitude smaller than for the modes with longer periods. We note that, for modes with the shortest periods, the value of is so small () that they are only marginally unstable. Hence, hereinafter we shall consider that a mode is unstable if .
Clearly emphasized in Fig. 3 is the fact that -mode excitation is noticeably stronger for the DB model than for the DQ model. Thus, the question arises about what would be the chance for a given excited mode in a DQ star to have time enough for developing observable amplitudes. In this respect, we note that for our template DQ model, the maximum and minimum -folding times for the set of excited modes are yr (, s, ) and yr (, s, ), respectively111The -folding times are defined as , such that the time dependence of the amplitude of the pulsations is given by , and for overstable modes.. These times are by far shorter than the evolutionary timescale at the DQ stage, which ranges from to yr. This suggests that the excited modes in hot DQ white dwarfs should have time enough to reach observable amplitudes. It is worth mentioning that we arrive at the same conclusion as Fontaine et al. (2008), who use a set of DQ models and a nonadiabatic pulsation code completely independent from ours.
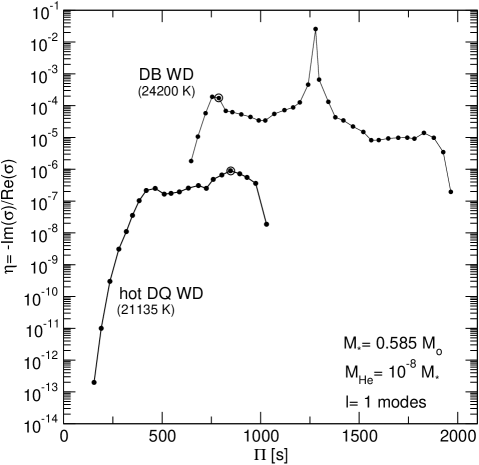
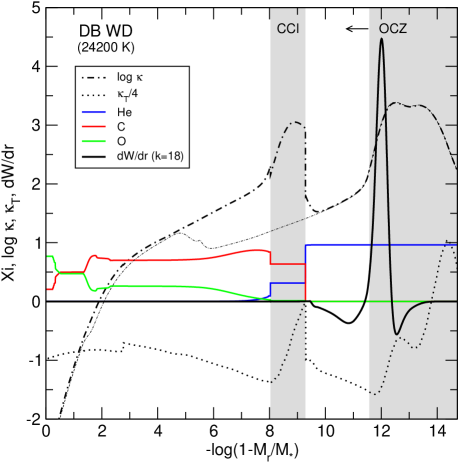
Fig. 4 shows details of the driving/damping process in our DB template model. The thick solid line corresponds to for an unstable mode with , s and (marked as a circumscribed dot in the upper curve of Fig. 3). Also plotted is the logarithm of the Rosseland opacity, , and its logarithmic derivative, . As can be seen, the region that destabilizes the mode (that where ) is located in a region slightly below the bump in the opacity at ( K), near the basis of the outer convection zone. This bump corresponds to the partial ionization of Heii. Above and below the driving region there are two zones of damping. Since the contributions to driving largely overcome the damping effects, the mode is globally excited.
Note also the presence of a second bump in the opacity at ( K), caused by the partial ionization of Cv and Cvi. Notably, this opacity bump does not contribute at all in the destabilization of the mode. So, in terms of pulsation stability, the mode does not “feel” the presence of the C-bump. For illustrative purposes, we have included in Fig. 4 the logarithm of the Rosseland opacity (thin dot-dashed line) corresponding to a DB white dwarf model with the same total mass and effective temperature than our DB template model, but characterized by a thick He-rich envelope. This model has been extracted from the calculations of Córsico et al. (2008). The run of the opacity is coincident with that of our DB template model, except at the location of the C-bump, because the thick-envelope DB model does not have C in that region.
In summary, the excitation of the overstable -mode of our template DB model is not affected by the presence of C at . Since this property is shared by all the overstable -modes of the DB models considered in this work, we conclude that overstable -modes of DB models having thin He-rich envelopes are excited in the same way as in DB models with thick He-rich envelopes. This property suggests that the DBV instability strip could be populated by DB white dwarfs with both thin and thick He-rich envelopes. This possibility could be tested through asteroseismological analysis performed on well-studied DBV stars.
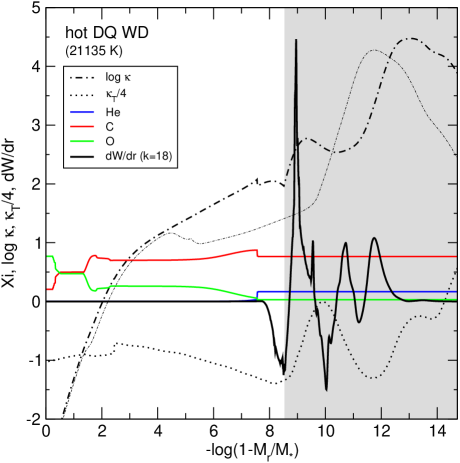
The details of the driving/damping process in our hot DQ template model for a selected overstable dipole mode with and s is displayed in Fig. 5. This mode, which is marked as a circumscribed dot in the lower curve of Fig. 3, has the largest growth rate in our DQ template model (). Note that, at variance with the DB template model, in this case most of excitation comes from the C-bump, located at ( K), close to the bottom of the outer convection zone. We caution, however, that some of the driving at this region could be due to the neglect of the perturbation of the convective flux (the frozen-convection approximation), as assumed in this work, instead of “genuine” driving due to the -mechanism acting at the C-bump. So, we would expect the driving at this region to be somewhat reduced if the frozen-convection assumption were relaxed in the stability computations. There are two additional driving regions, which also contribute to the mode excitation, located at and , respectively. The most external one is located at the hot side of the opacity bump of the partial ionization of Heii, corresponding to and K. On the other hand, the presence of the driving region at is not directly associated to any bump in the opacity. This is a feature absent in the models of Fontaine et al. (2008). Also, there are three regions in our model that contributes to the damping of the mode, instead of two regions as in the models of Fontaine et al. (2008). The total driving produced by the excitation regions overcomes the damping effects, and the mode is globally unstable.
The characteristics of the driving/damping process described above for a particular overstable mode of our DQ template model are also valid for all the unstable modes in all our hot DQ models. Thus, we conclude that overstable -modes in hot DQ white dwarf models are primarily driven by the strong destabilizing effect of the opacity bump due to the partial ionization of Cv and Cvi in a way similar to what occurs in GW Vir stars (Córsico et al. 2006), being the role of the partial ionization of Heii of much less relevance. These results are consistent with those reported by Fontaine et al. (2008), although in their models the partial ionization of HeII plays a more relevant role in the mode driving.
4.2 The theoretical blue edges
Since spectroscopic measurements of white dwarfs provide effective temperatures and surface gravities, it is useful to see how the evolutionary tracks and the instability domains look on the plane. In Fig. 6 we plot a set of DB evolutionary sequences on this plane (thin solid lines), extracted from the nonadiabatic study of DBVs of Córsico et al. (2008). These sequences correspond to DB white dwarf models characterized by thick He-rich envelopes (), as a result of which, they never become DQ white dwarfs. Superimposed are two evolutionary tracks ( and ) corresponding to DB white dwarfs with thin He-rich envelopes (thick solid curves). Note that, for a given value of the stellar mass, the tracks for DB models with thin and thick He-rich envelopes do not differ appreciably.
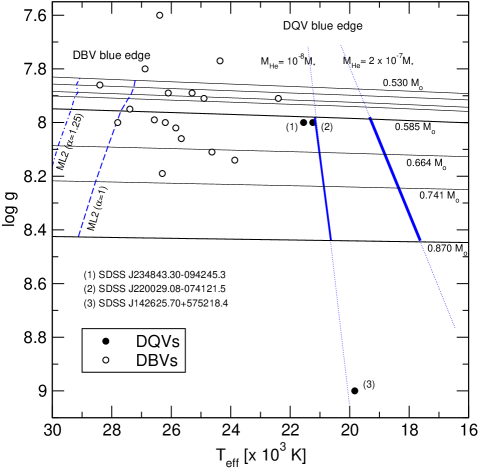
Fig. 6 includes the location of known DBVs — extracted from Beauchamp et al. (1999) and Nitta et al. (2009) — and also the known three variable DQ white dwarfs (hereinafter “DQVs”). Note that the observed blue edge for the DBV instability strip is well accounted for by a theoretical blue edge from nonadiabatic computations on DB models with the ML2 ( or ) flavor of the Mixing Length Theory (MLT) of convection (Córsico et al. 2008). Also displayed in the figure is the location of the blue edge for the DQV instability domain (thick solid segments). We recall that our DB and DQ white dwarf models assume the ML2 () prescription of the MLT. We found that our DQ white models become pulsationally unstable shortly after their formation, as can be seen by comparing the blue edge of DQVs from Fig. 6 with the values of effective temperature at which DQ white dwarf models are formed, see Table 1 of Althaus et al. (2009).
A feature revealed by Fig. 6 is that, in the current computations, the dependence of the blue edge on the stellar mass of the DQVs is the opposite to that found for the DBVs. That is, we find that the blue edge is hotter for less massive DQV stars. This is due to the fact that, in the context of the diffusive/convective mixing scenario, the temperature at which the DQV blue edge appears is directly dependent on the stellar mass and on the thickness of the He-rich envelope of the DB white dwarfs from which the DQ stars are formed. In particular, we have shown in Sect. 3 (see Fig. 2) that for the He envelope masses assumed in our models, the merger of the two convective zones, and thus, the formation of the DQ white dwarfs, happens at higher effective temperatures for the less massive models than for the more massive ones. Since the DQV blue edge occurs at the at which the DQs are formed, then this blue edge is hotter for less massive models. Note that this trend is at odds with the results of the stability analysis of Fontaine et al. (2008) and also the order-of-magnitude estimation obtained by Montgomery et al. (2008) from the thermal timescale () at the base of the outer convection zone.
Fig. 6 also shows that the blue edge is hotter ( K) for DQVs with smaller contents of He. It is due to the fact that the transition DB to DQ white dwarf occurs early for the case in which the He envelope of the DB model is less massive, as explained in Althaus et al. (2009). Since the pulsations are excited immediately after the formation itself of DQs, then the blue edge for DQV stars is hotter for smaller contents of He at the envelope.
We close this section by noting that the location of the three DQV stars in the plane is qualitatively supported by our computations of the blue edge for the case . Actually, only SDSS J142625.70575218.4 lies at right of this theoretical blue edge. Note that this star has a surface gravity large in excess, and no available track passes near its location. Presumably, this star would have a stellar mass . The other two DQVs, SDSS J220029.08074121.5 and SDSS J234843.30094245.3, with a stellar mass near , are located at temperatures slightly higher than the predicted blue edge. Note, however, that the blue edge could be easily accommodated at higher effective temperatures by simply considering stellar models with somewhat thinner He-rich envelopes ().
4.3 The plane
In this section we explore the domains of unstable dipole modes in terms of the effective temperature. Fig. 7 shows the instability domains on the plane for the sequence of and . The DBV instability domain is shown as a grey area, whereas the beginning of the DQV instability region is shown as a vertical red strip. Also included in the plot are the periods detected in the three known DQV stars. In the interest of a comparison, we also include the instability domain of DB models with thick He-rich envelopes (), according to Córsico et al. (2008) (dashed lines). Figs. 8, 9, and 10 depict the situation for the remainder sequences considered in this work. In each figure we have drawn a stripped region to illustrate the possible extension to lower temperatures of the DQV instability domains.
To begin with, we note that the hot side of the DBV instability domain for thin He-rich envelope models is virtually the same than for the case of DB models with thick He-rich envelopes. We have already mentioned such feature in Sect. 4.1. This means that DBVs with thick () or thin () He-rich envelopes should exhibit the same ranges of excited periods, at least in the hot half of the instability domain. Both types of DBV stars share the following properties. Firstly, there is a strong dependence of the longest excited periods with the stellar mass, being larger for less massive models. Secondly, the shorter excited periods, on the contrary, do not exhibit any dependence with . Finally, the blue edge is hotter for more massive DB models.
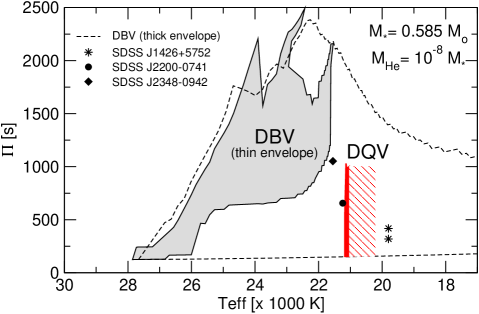
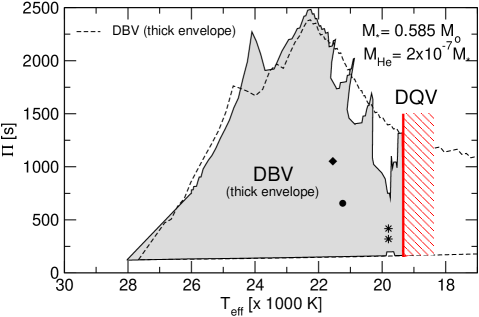
An interesting feature displayed by the plots is that the instability domains of DBVs and DQVs are clearly separated in the case of models with (Figs. 7 and 9). In fact, there is a noticeable gap in effective temperature between the point at which DB pulsations no longer exist and the location of the blue edge of the DQV instability strip, in which the pulsations of DQs begin. This gap is more pronounced in the case of white dwarfs with ( K) than for white dwarfs with ( K). For models with , on the other hand, the instability domains are “in contact” (Figs. 8 and 10). Thus, there exists a continuous transition from the pulsation instability of DBs to DQs. We recall, however, that modes in DBs are excited by the maximum in opacity due to the partial ionization of He, whereas overstable modes in DQs are mainly driven by the opacity bump produced by the partial ionization of C.
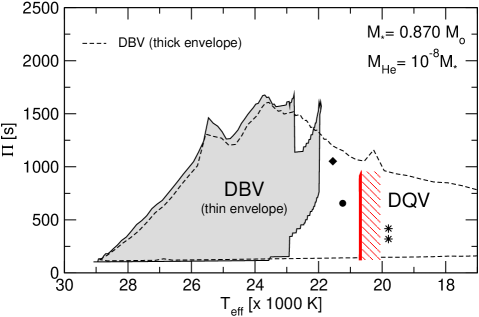
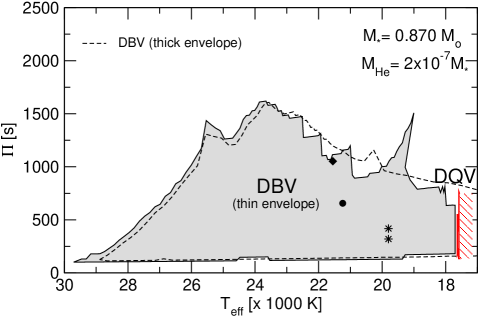
In Figs. 7 to 10 we have included the periods detected in the three presently known DQV stars. The longest periods excited in our DQ models are in the range s. The periods detected in SDSS J142625.70575218.4 and SDSS J220029.08074121.5 are well within the predicted period ranges, but the period at s corresponding to SDSS J234843.30094245.3 is too long and is not well accounted for by our models, except by the case and . On the other hand, only the sequences of DQs with are able to nearly account for the effective temperatures at which the variable DQ stars are located. As we mentioned in Sect. 4.2, apparently we could get rid the small discrepancies in simply by considering smaller contents of He in the envelopes.
5 Summary and conclusions
In this study, we have presented a pulsation stability analysis of the recently discovered carbon-rich hot DQ white dwarf stars. These stars constitute a new class of white dwarf stars, uncovered recently within the framework of SDSS project. There exist nine hot DQs, out of a total of several thousands white dwarfs spectroscopically identified. Three hot DQ white dwarfs have been reported to exhibit photometric variations with periods compatible with pulsation -modes. One of the main aims of the present work was to test the convective-mixing picture for the origin of hot DQs through the pulsational properties. Specifically, we have employed the full evolutionary models of hot DQ white dwarfs recently developed by Althaus et al. (2009), that consistently cover the whole evolution from the born-again stage to the DQ white dwarf stage. We have presented a stability analysis on white dwarf models from stages before the blue edge of the DBV instability strip ( K) until the domain of the hot DQ white dwarfs ( K), including the transition from DB to hot DQ white dwarfs. We explored evolutionary models with and , and two values for the thickness of the He-rich envelope ( and ). These envelopes are order of magnitude thinner than those of standard DB white dwarf models resulting from canonical stellar evolution calculations.
We found that at epochs when the models are characterized by He-dominated atmospheres, they exhibit -mode pulsations typical of DBV stars, and when the models become hot DQ white dwarfs with carbon-dominated atmospheres, they continue being pulsationally unstable with characteristics similar to those of DB models, and in qualitative agreement with the periods observationally detected in variable hot DQ white dwarfs. Our main results are the following:
-
•
Generally, -modes excited in hot DQ white dwarfs have small linear growth rates, noticeably smaller than those typical of DB models. In spite of this, the excited modes in hot DQ white dwarfs should have time enough as to reach observable amplitudes. This conclusion is in line with the results of Fontaine et al. (2008).
-
•
Overstable -modes of DB white dwarf models having thin He-rich envelopes () are excited in the same way as in DB models with thick He-rich envelopes (), that is, by the action of the -mechanism acting on the region of partial ionization of Heii. The opacity bump due to the partial ionization of C, present in DB models with thin envelopes, does not contribute at all in the destabilization of modes.
-
•
Overstable -modes in hot DQ white dwarf models are primarily driven through the -mechanism by the strong destabilizing effect of the opacity bump due to the partial ionization of C, being the role of the partial ionization of Heii of much less relevance. This is somewhat at variance with the models of Fontaine et al. (2008), in which both opacity bumps are equally active in destabilizing of modes.
-
•
The blue edge of DQVs is hotter for less massive models than for more massive ones. This is at odds with the results of Fontaine et al. (2008) and Montgomery et al. (2008). The reason for this discrepancy relies in the way itself in which the DQ models are conceived, being in our case the result of fully evolutionary computations in the context of the diffusive/convective mixing scenario presented by Althaus et al. (2009).
-
•
The blue edge for DQV stars is hotter for smaller contents of He at the envelopes.
-
•
The location of the three DQV stars in the diagram is qualitatively accounted for by our calculations of the blue edge with , and the small discrepancies in could be accounted for by simply considering stellar models with somewhat thinner He-rich envelopes ().
-
•
The prototype star SDSS J142625.70575218.4, that lies at right of our theoretical DQV blue edge, has a surface gravity large in excess, and we have no available DB/DQ track that passes near its location. Presumably, this star could have a stellar mass .
-
•
The instability domains of DBVs and DQVs are clearly separated in the plane for the case of models with the thinnest He-rich envelopes considered in this work (), but there is a continuous transition from the pulsation instability of DBs to DQs for the case in which .
-
•
The periods detected in SDSS J142625.70575218.4 and SDSS J220029.08074121.5 are well within our theoretical ranges of excited periods, but the period at s corresponding to SDSS J234843.30094245.3 is long in excess, and is not well accounted for by our models.
In summary, our calculations support the diffusive/convective mixing picture for the formation of hot DQs, an idea originally proposed by Dufour et al. (2008) and quantitatively elaborated on recently by Althaus et al. (2009). In particular, the results of the present work demonstrate that the diffusive/convective mixing scenario not only is able to nicely explain the origin of hot DQ white dwarfs, but it also accounts for the variability of these stars.
According to this scenario, a fraction of DB white dwarfs — those which are immediate progenitors of hot DQ white dwarfs — should be characterized by He-rich envelopes to times thinner than the canonical thickness predicted by the standard theory for the formation of DB white dwarfs (Althaus et al. 2005). The existence of such DBs, and thus, the validity of the diffusive/convective mixing scenario, could be investigated using an adiabatic asteroseismological analysis of DBV stars with a rich pulsation spectrum which have high quality observational data available, like GD 358, EC 20058-5234, and CBS 114.
In closing, it is worth to stress that the conclusions arrived at in this work — and also the results of Fontaine et al. (2008) and Dufour et al. (2008) — in particular concerning the location of the blue edge of the DBV and DQV instability strips, could substantially change if a fully consistent treatment of the interaction between convection and pulsation like that of Dupret et al. (2008), or even the simpler approach of Wu & Goldreich (1999), were taken into account in the stability analysis.
Acknowledgements.
We would like to warmly acknowledge the comments and suggestions by our referee, Dr. M. H. Montgomery, that allowed us to improve the original version of this paper. This research was supported by AGENCIA: Programa de Modernización Tecnológica BID 1728/OC-AR, by the AGAUR, by MCINN grant AYA2008–04211–C02–01, by the European Union FEDER funds and by PIP 6521 grant from CONICET. LGA also acknowledges AGAUR through the Generalitat de Catalunya for a PIV grant. This research has made use of NASA’s Astrophysics Data System. Finally, we thank H. Viturro and R. Martínez for technical support.References
- (1) Althaus, L. G., García–Berro, E., Córsico, A. H., et al., 2009, ApJL, 693, L23
- (2) Althaus, L. G., Serenelli, A. M., Panei, J. A. et al., 2005, A&A, 435, 631
- (3) Barlow, B. N., Dunlap, B. H., Rosen, R., & Clemens, J. C., 2008, ApJL, 688, L95
- (4) Beauchamp, A., Wesemael, F., Bergeron, P., et al., 1999, ApJ, 516, 887
- (5) Bergeron, P. , Legget, S. K., & Ruiz, M. T. 2001, ApJS, 133, 413
- (6) Brassard, P., & Fontaine, G., 1999, “Theory and Tests of Convection in Stellar Structure”, 173, 329
- (7) Burgers, J. M., 1969, “Flow Equations for Composite Gases”, Academic Press: New York
- (8) Cassisi, S., Pothekin, A. Y., Pietrinferni, A., Catelan, M., & Salaris, M., 2007, ApJ, 661, 1094
- (9) Córsico, A. H., Althaus, L. G., Miller Bertolami, M. M., & García–Berro, E., 2008, arXiv:0810.2963
- (10) Córsico, A. H. , Althaus, L. G., & Miller Bertolami, 2006, A&A, 458, 259
- (11) Dufour, P., Liebert, J., Swift, B., Fontaine, G., & Sukhbold, T., 2009, arXiv:0901.3487
- (12) Dufour, P., Fontaine, G., Liebert, J., Schmidt, G. D., & Behara, N., 2008, ApJ, 683, 978
- (13) Dufour, P., Liebert, J., Fontaine, G., & Behara, N., 2007, Nature, 450, 522
- (14) Dupret, M. A., Quirion, P. O., Fontaine, G., Brassard, P., & Grigahcéne, A., 2008, Journal of Physics Conference Series, 118, 012051
- (15) Fontaine, G., Brassard, P., Dufour, P., Green, E. M., & Liebert, J., 2009, arXiv:0901.3489
- (16) Fontaine, G., Brassard, P., & Dufour, P., 2008, A&A, 483, L1
- (17) Haft, M., Raffelt, G., & Weiss, A., 1994, ApJ, 425, 222
- (18) Iglesias, C. A., & Rogers, F. J., 1997, ApJ, 464, 943
- (19) Itoh, N., Hayashi, H., Nishikawa, A., & Kohyama, Y., 1996, ApJS, 102, 41
- (20) Lee, U., & Bradley, P. A., 1993, ApJ, 418, 855
- (21) Magni, G., & Mazzitelli, I., 1979, A&A, 72, 134
- (22) Miller Bertolami, M. M. & Althaus, L. G., 2006, A&A, 454, 845
- (23) Montgomery, M. H., Williams, K. A., Winget, D. E., Dufour, P., DeGennaro, S., & Liebert, J. 2008, ApJL, 678, L51
- (24) Nitta, A., Kleinman, S. J., Krzesinski, J., et al., 2009, ApJ, 690, 560
- (25) Segretain, L., Chabrier, G., Hernanz, M., García–Berro, E., & Isern, J., 1994, ApJ, 434, 641
- (26) Tassoul, M., Fontaine, G., & Winget, D., 1990, ApJS, 72, 335
- (27) Unno, W., Osaki, Y., Ando, H., Saio, H., & Shibahashi, H., 1989, “Nonradial Oscillations of Stars”, University of Tokyo Press, 2nd. edition