A comparative study of fracture in Al: quantum mechanical vs. empirical atomistic description
Abstract
A comparative study of fracture in Al is carried out by using quantum mechanical and empirical atomistic description of atomic interaction at crack tip. The former is accomplished with the density functional theory (DFT) based Quasicontinuum method (QCDFT) and the latter with the original Quasicontinuum method (EAM-QC). Aside from quantitative differences, the two descriptions also yield qualitatively distinctive fracture behavior. While EAM-QC predicts a straight crack front and a micro-twinning at the crack tip, QCDFT finds a more rounded crack profile and the absence of twinning. Although many dislocations are emitted from the crack tip in EAM-QC, they all glide on a single slip plane. In contrast, only two dislocations are nucleated under the maximum load applied in QCDFT, and they glide on two adjacent slip planes. The electron charge density develops “sharp corners” at the crack tip in EAM-QC, while it is smoother in QCDFT. The physics underlying these differences is discussed.
keywords:
Plastic Deformation , Dislocations , First-Principles Electron Structure Theory , Atomistic Simulation , fracture mechanicsPACS:
71.15.Mb , 62.20.Mk , 71.15.Dx1 Introduction
Understanding fracture behavior in materials is a challenging undertaking. Despite nearly a century of study, several important issues remain unsolved. For example, there is little fundamental understanding of brittle to ductile transition as a function of temperature in many materials; there is still no definitive explanation of how fracture stress is transmitted through plastic zones at crack tips; and there is no complete understanding of the disagreement between theory and experiment regarding the limiting speed of crack propagation. These difficulties to a great extent stem from the fact that fracture phenomena are governed by processes occurring over a wide range of length and time scales; these processes are all connected and all contribute to the total fracture energy (Van der Giessen and Needleman, 2002).
As emphasized by Van de Giessen and Needleman, although the atomistic interaction at a crack tip may only account for a small fraction of the total fracture energy, it can be a controlling factor (Van der Giessen and Needleman, 2002) - after all, all fractures take place by breaking atomic bonds. Critical atomistic information, such as surface energy, stacking fault energy, dislocation nucleation/propagation energy and twinning formation energy, etc, has been known to play central roles in fracture. In fact, some of these quantities are at the heart of fracture mechanics, including the Griffith’s criterion for brittle fracture (Griffith, 1920), Rice’s criterion (Rice, 1992) for crack tip blunting and more recently a criterion for twinning at crack tip (Tadmor and Hai, 2003), to name a few.
Because of the inherent multiscale nature of fracture - the process at each scale depends strongly on what happens at the other scales, the modeling and simulation of fracture calls for concurrent multiscale approaches (Lu and Kaxiras, 2005). One of the first concurrent multiscale modeling of fracture was based on Macroscopic Atomistic ab initio Dynamics (MAAD) method for Silicon (Broughton et al., 1999). MAAD couples a quantum mechanical description of atoms at crack tip, to an empirical (or classical) atomistic description of atoms at a short distance away from the crack tip, and to the continuum finite-element description of the rest of the system. Since MAAD, several other concurrent multiscale methods have been developed, all involving some level of quantum mechanical modeling at the crack tip (Csányi et al., 2004; Bernstein and Hess, 2003; Ogata et al., 2001). All these methods were developed/applied for Si owning to the following technical reasons: (1) large-scale electronic structure methods such as linear-scaling algorithms are only applicable to covalently-bonded semiconductors like Si; general approaches for metals still remain elusive; (2) satisfactory QM/MM coupling schemes for metals were less well developed until recently (Bernstein et al., 2009; Liu et al., 2007; Zhang and Lu, 2007). On the other hand, concurrent multiscale approaches that do not involves quantum mechanics are readily available (Miller et al., 1998; Kohlhoff et al., 1991; Buehler et al., 2006). Among them, Quasicontinuum (QC) method is particularly promising and it has been widely applied to many materials problems, including fracture in metals (Tadmor and Miller, 2005). QC strives to achieve a “seamless” coupling between atomistic and continuum descriptions and allows quantum mechanical interactions incorporated in a systematical manner. For example, although the original QC was based on classical atomic interactions, significant progress has been made recently to incorporate quantum mechanical interactions in the local QC region (Hayes et al., 2006), nonlocal QC region (Lu et al., 2006) and entire QC system (Peng et al., 2008). The coarse-graining strategy of QC has also been explored to perform large-scale electronic structure calculations (Gavini et al., 2007).
Despite the impressive advance in multiscale methodology development, a crucial question remains unanswered. Although it is clear that an atomistic description at a crack tip is indispensable for many purposes, it is not well established whether a quantum mechanical description at the crack tip is truly necessary. This is a poignant point given the continuing improvement of empirical potentials and the still heavy costs for quantum simulations. It is to address this question that motivates the present study. As a first look at the problem, we focus on crack tip plasticity in Al and compare results received from a quantum mechanical description vs. an empirical atomistic description at the crack tip, both in the framework of QC. Since the atomistic resolution is only necessary near the crack tip while the linear elastic fracture mechanics boundary conditions can be applied in the far field, QC is well poised for such fracture simulations. In addition, QC simulations involve quasi-static energy minimization, thus the unrealistically high strain rates common to molecular dynamics simulations are avoided. Unfortunately, as a result thermally activated processes are precluded in QC. Al is chosen in this study because it is relatively inexpensive for density functional theory (DFT) calculations and an excellent embedded-atom-method (EAM) empirical potential exists for Al (Ercolessi and Adams, 1994). The goal of this work is to examine how and why the results received in the empirical simulations differ from those in quantum mechanical DFT simulations at the crack tip. To this end, we employ so-called QCDFT method in which the nonlocal atoms at the crack tip are treated with DFT. The QCDFT results are compared to those obtained from the original QC method in which all nonlocal atoms are treated with EAM empirical potential.
The structure of the paper is as follows. The methodology is introduced in Section 2 for both QC and QCDFT methods. A semi-infinite crack under mode I loading is set up in Section 3.1. The computational parameters are described in Section 3.2 and the loading procedure for the crack is summarized in Section 3.3. The simulation results and analysis are presented in Section 4 and discussions are given in Section 5. Finally we conclude in Section 6.
2 Methodology
The QC method (Shenoy et al., 1999; Tadmor et al., 1999) is a multiscale approach (Lu and Kaxiras, 2005) that combines atomistic models with continuum theories, and thus offers an advantage over conventional atomistic simulations in terms of computational efficiency. The idea underlying the QC method is that atomistic processes of interest often occur in very small spatial domains (e.g., crack tip) while the vast majority of atoms in the material behave according to well-established continuum theories. To exploit this fact, the QC method retains atomic resolution only where necessary and coarsens to a continuum finite element description elsewhere. This is achieved by replacing the full set of atoms with a small subset of “representative atoms” or repatoms () that approximate the total energy through appropriate weighting. The energies of individual repatoms are computed in two different ways depending on the deformation in their immediate vicinity. Atoms experiencing large deformation gradients on an atomic-scale are computed in the same way as in a standard fully-atomistic method. In QC these atoms are called nonlocal atoms. In contrast, the energies of atoms experiencing a smooth deformation field on the atomic scale are computed based on the deformation gradient in their vicinity as befitting a continuum model. These atoms are called local atoms. The total energy (which for a classical system can be written as , with the energy of atom ) is approximated as
| (1) |
The total energy has been divided into two parts: an atomistic region of nonlocal atoms and a continuum region of local atoms ().
The original formulation of QC was limited to classical potentials for describing interactions between atoms. However, since many materials properties depend crucially on the behavior of electrons, such as bond breaking/forming at crack tips or defect cores, chemical reactions with impurities, surface reactions and reconstructions, electron excitation and magnetism, etc, it is desirable to incorporate appropriate quantum mechanical descriptions into the QC formalism. QCDFT is one strategy to fill this role. In specific, QCDFT combines the coarse graining idea of QC and the coupling strategy of the quantum mechanics/molecular mechanics (QM/MM) method. This method can capture the electronic structure at the crack tip within the accuracy of DFT and at the same time reach the length-scale that is relevant to experiments(Lu et al., 2006; Peng et al., 2008).
The original QC formulation assumes that the total energy can be written as a sum over individual atom energies. This condition is not satisfied by quantum mechanical models. To address this limitation, in the present QCDFT approach the nonlocal region is treated by an EAM-based QM/MM coupling approach (Lu et al., 2006; Liu et al., 2007): the Kokn-Sham density functional theory (KS-DFT) is coupled to EAM with the interaction energy calculated also by EAM. The local region, on the other hand, is dealt with by EAM, which is the same energy formulation used in the MM part of the nonlocal region. This makes the passage from the atomistic to continuum seamless since the same underlying material description is used in both. This description enables the model to adapt automatically to changing circumstances (e.g. the nucleation of new defects or the migration of existing defects). The adaptability is one of its main strengths of QC and QCDFT, which is missing in many other multiscale methods.
More specifically, in the present QCDFT approach the material of interest is partitioned into three distinct types of domains: (1) a nonlocal quantum mechanical DFT region (region I); (2) a nonlocal classical region where classical EAM potentials are used (region II); and (3) a local region (region III) that employs the same EAM potentials as region II. The coupling between regions II and III is achieved via the QC formulation, while the coupling between regions I and II is accomplished by the QM/MM scheme (Choly et al., 2005; Liu et al., 2007). The total energy of the QCDFT system is then (Lu et al., 2006)
| (2) |
where is the total energy of the nonlocal region (I and II combined with the assumption that region I is embedded within region II), [I] is the energy of region I in the absence of region II computed with DFT, [II] is the energy of region II in the absence of region I computed with EAM, and is the energy of the nonlocal region computed with EAM.
Other types of combination with quantum mechanical and classical atomistic methods may also be implemented in QCDFT. The great advantage of the present implementation is its simplicity; it demands nothing beyond what is required for a DFT calculation and an EAM-QC calculation. Another important practical advantage of QCDFT method is that, if region I contains many different atomic species while region II contains only one atom type, there is no need to develop reliable EAM potentials that can describe each species and their interactions. This is because if the various species of atoms are well within region I, the energy contributions of these atoms are canceled out in the total energy calculation. This advantage renders the method particularly useful in dealing with impurities, which is an exceedingly difficult task for empirical potential simulations.
The equilibrium structure of the system is obtained by minimizing the total energy in Eq. 2 with respect to all degrees of freedom. Because the time required to evaluate [I] is considerably more than that required for computation of the other EAM terms in , an alternate relaxation scheme turns out to be useful. The total system can be relaxed by using conjugate gradient approach on the DFT atoms alone, while fully relaxing the EAM atoms in region II and the displacement field in region III at each step. An auxiliary energy function can be defined as
| (3) |
which allows for the following relaxation scheme: (i) minimize with respect to the atoms in regions II () and the atoms in region III (), while holding the atoms in region I fixed; (ii) calculate , and the forces on the region I atoms; (iii) perform one step of conjugate gradient minimization of ; (iv) repeat until the system is relaxed. In this manner, the number of DFT calculations performed is greatly reduced, albeit at the expense of more EAM and local QC calculations. A number of tests have shown that the total number of DFT energy calculations for the relaxation of an entire system is about the same as that required for DFT relaxation of region I alone.
3 Computational details
3.1 Model setup
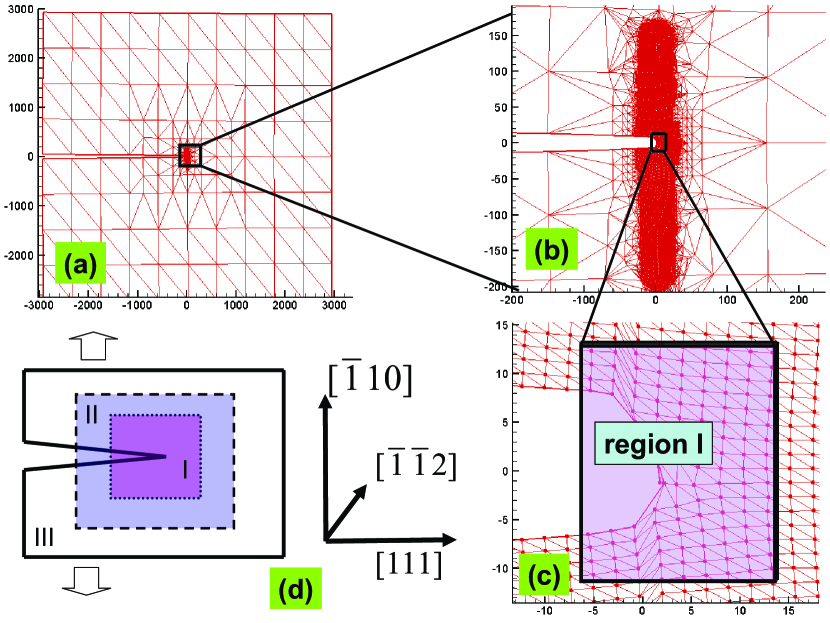
A semi-infinite crack in a single Al crystal is studied by both QC and QCDFT for comparisons. The crack is made by removing two layers of atoms with and Å. The crack plane is (10) and in this orientation, (111) plane is the only active slip plane for dislocations emitted from the crack tip; all other -type planes lie obliquely to the crack plane and are thus precluded by the imposed plane strain conditions (Tadmor and Hai, 2003). This configuration was used previously in a MD study by Hoagland et al. (Hoagland et al., 1990) and an EAM-QC study by Hai et al. (Hai and Tadmor, 2003) although the initial crack opening and the EAM potential used are different in these studies. The initial crack opening in the present work is determined based on two competing considerations: (1) it cannot be too narrow otherwise the crack will close and/or large number of loading steps is required to observe the onset of plasticity; (2) it cannot be too wide otherwise the DFT region is too large to render calculations feasible. Of course, the DFT region has to be large enough to capture the crucial plasticity events at the tip. The crack is subject to mode I loading along direction shown schematically in Fig. 1(d).
The dimension of the system is along the , , directions respectively. The system is periodic in z-direction, and has Dirichlet boundary conditions in the other two directions. The system contains over 11 million Al atoms - a size that is well beyond the reach of any full-blown quantum calculation. The schematic overview of the system is shown in panel (a) of Fig. 1 with finite element meshes. Panel (b) is a zoomed-in view of the nonlocal region and panel (c) displays the atomic detail of the crack tip.
3.2 Computational parameters
Two comparative calculations are carried out for the crack: EAM-QC vs. QCDFT for Al. EAM-QC is the original QC with EAM potential for atomic interactions. In this work, the EAM potential used is rescaled from the original “force-matching” EAM (Ercolessi and Adams, 1994) potential so that it matches precisely the value of the lattice constant and bulk modulus of Al from the DFT calculations (Choly et al., 2005). Although the re-scaling changes very little to the original potential, it eliminates lattice parameter mismatch at the QM/MM interface, and thus reduce QM/MM coupling errors.
DFT calculations are carried out with the Vienna Ab-initio Simulation Package (VASP) (Kresse et al., 1993; Kresse and Hafner, 1994; Kresse and Furthuller, 1996a, b) which is based on Kohn-Shem Density Functional Theory (KS-DFT) with the local density approximation and ultrasoft pseudopotentials. A plane-wave cutoff of 129 eV is used in the calculations and the -points are sampled according to the Monkhorst-Pack method (Monkhorst and Pack, 1976) with a mesh in the Brillouin zone. There are 134 DFT atoms in region I.
3.3 Loading procedure
The simulations are performed quasi-statically with displacement
boundary conditions where the displacement is prescribed as a
function of intended stress intensity factor (SIF) at each loading
step. For EAM-QC, the loading procedure is outlined as following:
(1) For a small initial stress intensity factor , the
anisotropic Linear Elastic Fracture Mechanics (LEFM) solution
(Sih and Liebowitz, 1968) is
obtained. Each atom is displaced according to
,
where is the displacement field and is the position of nodes in the model.
(2) The displacement at the model boundaries is fixed except for
the crack surfaces; the positions for all repatoms are obtained by energy minimization as explained before.
(3) The finite-element mesh, the status of repatoms (local vs.
nonlocal) and the neighbor list are updated.
(4) The SIF is increased by a small amount as
and repeat from step (1) until the intended SIF is achieved.
In this study the increment is used. The loading procedure adopted here follows
closely that of reference (Hai and Tadmor, 2003).
Because DFT calculations are much more expensive than EAM, we use EAM-QC to load the crack until an incipient plasticity is about to take place, at which point QCDFT is switched on. In other words, a QCDFT relaxation starts from a configuration that is obtained by EAM-QC for . QCDFT then increases the SIF by . This is a reasonable approximation because EAM is known to give accurate results for deformations prior the onset of crack tip plasticity or the appearance of lattice defects. As will be shown later, since the critical load for the onset of plasticity from QCDFT is smaller than that from EAM-QC, the present loading strategy does not run the risk of missing incipient plasticity of QCDFT.
4 Results and Analysis
4.1 EAM-QC calculation of Al
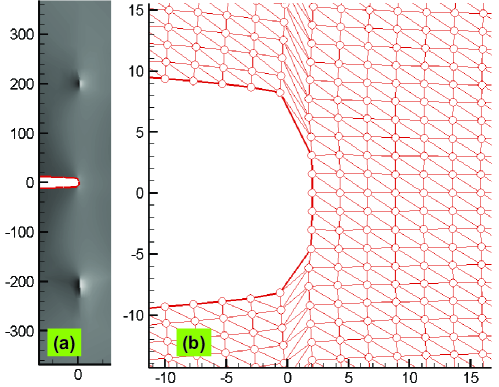
To establish the validity of present EAM-QC method, we first perform EAM-QC calculations for the same crack studied in reference (Hai and Tadmor, 2003). We use the same EAM potential and the same initial crack opening as that in (Hai and Tadmor, 2003). The results are presented in Fig. 2 where two edge dislocations are emitted from the crack tip and they glide at the same slip plane in a symmetrical manner. The critical SIF is 0.144 . All these results are identical to those found in (Hai and Tadmor, 2003) and thus validate the present EAM-QC method.
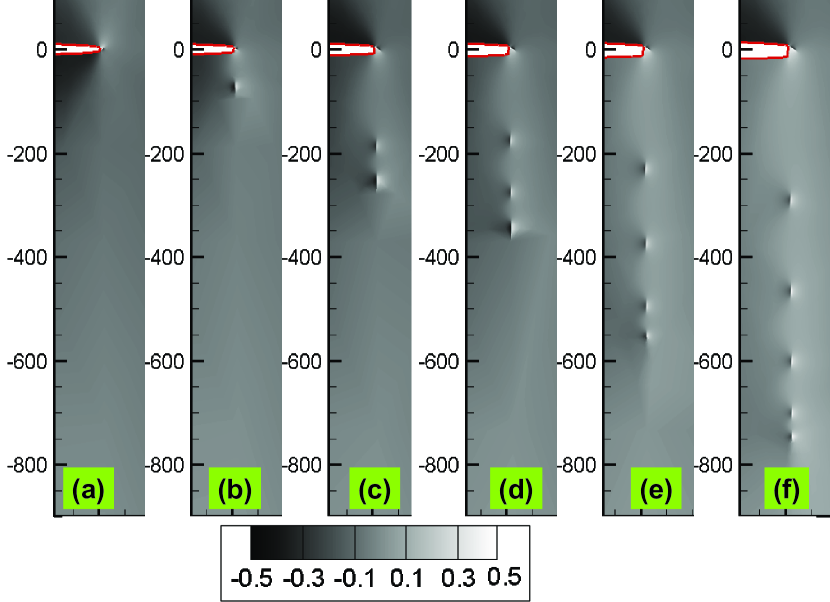
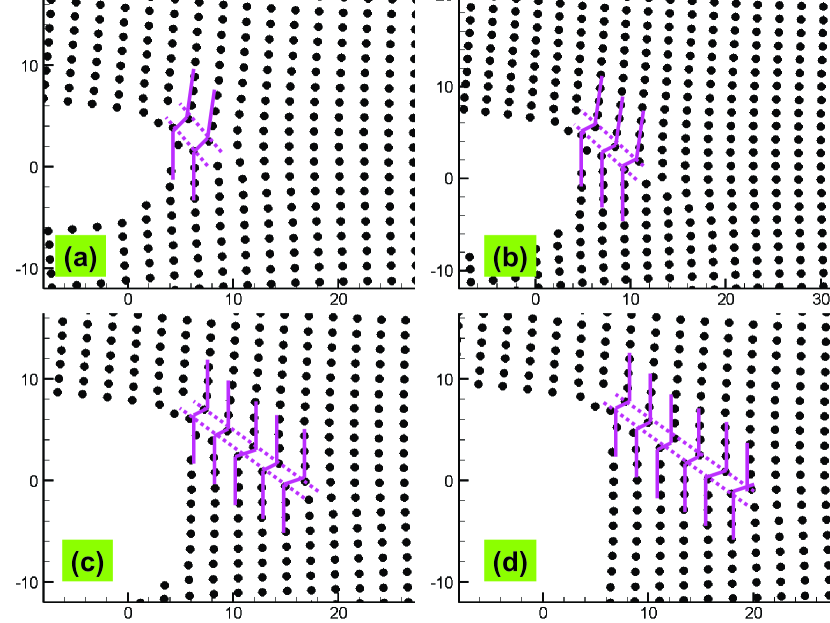
Next, we apply EAM-QC to the crack of interest. The crack is loaded quasi-statically and no crack tip plasticity is observed until the SIF reaches . By comparison, the critical SIF for pure brittle cleavage computed from the Griffith criterion for this orientation is . In Fig. 3, we present the out-of-plane displacement as a function of applied values. For , although no dislocation is observed, significant deformation at the crack tip is clearly visible (panel a). At , the first dislocation is nucleated and subsequently moves away from the crack tip. The dissociated edge dislocation is stabilized at about 70 Å below the crack on a (111) plane (panel b). The contour shading of Fig. 3 corresponds to the magnitude of , whose non-zero values indicate that the edge dislocation is dissociated into partials. Interestingly, at the same time, a micro-twin is also nucleated from the crack tip (Fig. 5a). The micro-twn is two layers in both length and width, the twinning direction is [714] and the twinning plane is (). As value is increased, more dislocations are emitted on the (111) plane and at the same time, the micro-twin grows in length but not in width. More specifically, as increases to 0.184, 0.186, 0.191, 0.198 , two, three, four and five dislocations are emitted from the crack tip and they glide on the same (111) plane, as shown in the panel of (c), (d), (e) and (f) of Fig. 3 respectively. Correspondingly, the micro-twin grows to three, four, five and six layers in length, respectively. The micro-twin structures of two, three, five and six layers in length are shown in the panel of (a), (b), (c), (d) of Fig. 5 respectively. The width of the micro-twin is not increasing perhaps due to unfavorable stacking fault energy along the usual twinning plane. The reason that the twinning was not observed in Hai et al. (Hai and Tadmor, 2003) is probably due to the the different initial crack openings rather than the different EAM potentials used. We have done additional calculations for the present crack opening (2 layers) with the same EAM potential used in reference (Hai and Tadmor, 2003) and found a similar twinning at the crack tip.
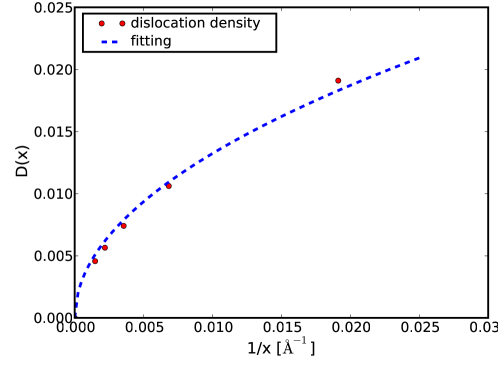
The emitted dislocations share the following characteristics: (1) They are all edge dislocations of Burgers vector and dissociated into Shockly partials with a separation distance of 16 Å. This result agrees with the previous study of Hai et al. (Hai and Tadmor, 2003) with the similar EAM potential. But this value is too large compared to the experimental splitting distance of 5.5 Å, measured by Mills and Stadelmann(Mills and Stadelmann, 1989). The discrepancy may be attributed to still too low stacking fault energy of the EAM potential. (2) They are all on the same slip plane whose position is , where is is (111) inter-plane distance. The active slip plane is slightly ahead of the crack front position at . The emitted dislocations move away from the crack tip and form a pile-up against the local/nonlocal QC interface. For , the dislocation density defined as the number of dislocations per unit distance along pileup line, is found to be the square root of the inverse of the distance (Hirth and Lothe, 1970). The distance refers to the distance between the dislocation center and the local/nonlocal interface. The fitted curve (dashed line) in Fig. 4 qualitatively agrees well with the elastic theory where the fitting function is given as .
4.2 QCDFT calculation of Al
The crack is first loaded by EAM-QC until reaches 0.169 at which point QCDFT is started. This critical loading is determined by trial and error; we launch a number of QCDFT calculations at different from previously relaxed EAM-QC structures and examine whether any crack tip plasticity is taking palce. The smallest value that results in incipient plasticity is the critical loading. In comparison, the critical SIF for pure brittle cleavage computed from the Griffith criterion is .
The crack tip behavior of QCDFT is much different. At , two dissociated edge dislocations are nucleated - one above the crack plane and one below it. In contrast to EAM-QC, the two dislocations glide at two adjacent (111) slip planes, as shown in Fig. 7(d). The positions of the two slip planes are at and respectively; they are slightly behind the crack front position. The separation distance of the two Schockly partials is 16 Å, the same as that in EAM-QC calculation. This result is consistent with the fact that the dislocation cores are outside the DFT box where atomic interaction is determined by the rescaled EAM potential.
As the load is increased, the two emitted dislocations are driven further away from the crack plane, however, no more dislocation is nucleated within the maximum load that we have explored in this study. For the largest , there are only two emitted dislocations gliding at 380 Å (up) and 258 Å (down) away from the crack plane. Due to the computational cost of QCDFT, we did not pursue more calculations for even larger loadings. However, it is evident from the present study that the crack tip plasticity observed in QCDFT is qualitatively different from that in EAM-QC. The differences are more striking given the fact that the QCDFT results are continued relaxation of EAM-QC configurations.
5 Discussion
| (Å) | ||||||||
| EAM | 3.99 | 0.60 | 0.98 | 1.10 | 0.124 | 0.134 | 0.180 | 0.89 |
| DFT | 3.99 | 70.93 | 1.31 | 1.18 | 0.148 | 0.205 | 0.262 | 0.93 |
| Exp | 4.032 | 1.14a | 1.14a | 1.14a | 0.12 |
a Estimates for an “average” orientation.
5.1 Dislocation nucleation at the crack tip
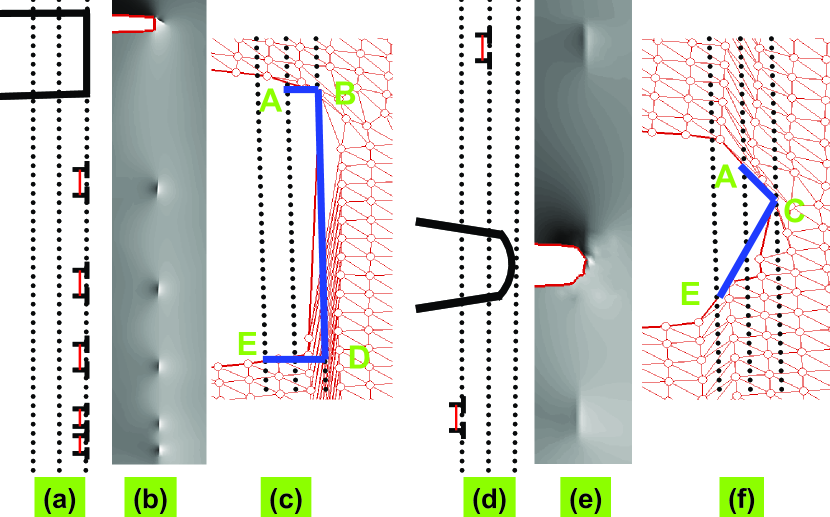
EAM-QC shows that the crack blunts by emitting dislocations gliding on a single slip plane, and the number of emitted dislocations increases as the SIF is increased. However, QCDFT predicts that two dislocations are nucleated from the crack tip and they glide at two adjacent slip planes. Moreover, the number of emitted dislocations remains the same (two) for all SIFs. These distinctions are highlighted in Fig. 7 where schematic diagrams, displacement contours and atomic structures at the crack tip for the two calculations are presented. In the schematic diagrams (a and d), the crack tip is represented by solid black lines/curves, and the dotted black lines denote the three relevant (111) slip planes at and . The stacking fault between the Shockley partials is indicated by a short red line segment. The displacement contour plots are the same as those shown in Fig. 3 and Fig. 6; they are reproduced here for convenience to the reader. The open circles in the atomic structure plots represent atomic positions. The sheared finite-element mesh in the atomic structure plots is the result of passing-by dislocations (the amount of shear corresponds to the net Burgers vector of the dislocations). The crack tip profile is approximated by blue line segments in the atomic structure plots. In Fig. 7(c) the crack tip profile is approximated by rectangular line segments ++ to model the fact that the crack tip is blunted by emitting dislocations on a single slip plane. The active slip plane is represented whose position is at . In Fig. 7(f), however, the crack tip profile of QCDFT is approximated by zigzag line segments because two adjacent slip planes are activated, and their positions are at and .
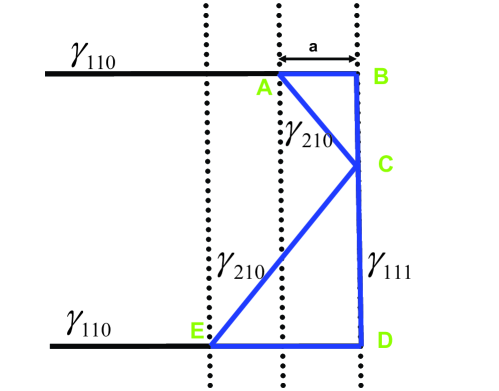
To understand the origin of the differences, we resort to a simple model that captures the essential features of the crack configuration shown in Fig. 8. One can consult Fig. 7 to understand the correspondence between the model and the actual crack tip configuration. The reason why the rectangular segments ++ are preferred in EAM-QC while the zigzag segments + are favored in QCDFT can be understood from the following surface energy analysis. Without loss of generality, we consider here the case where two dislocations are emitted for both EAM-QC and QCDFT. The length of equals to the magnitude of the Burgers vector because a full dislocation has been emitted upper-ward from A. As a result, represents a {210} surface. There are two layers of atoms removed in the initial crack openning, which is one Burgers vector wide. Therefore in addition to a full dislocation emitted downward from E, the length of equals to twice of the Burgers vector magnitude. Hence is also a {210} surface. Therefore , (and ) and (and ) represents (111), {210} and (10) surface, respectively. The total surface energy associated with the zigzag and rectangular segments can be written as and , respectively. is the repeat distance along z axis. The various surface energies have been calculated by both DFT and rescaled EAM as summarized in Table 1. For this particular crack configuration, the surface energy of the rectangular segments is 0.05 eV lower than that of the zigzag segments based on EAM energetics. On the other hand, the surface energy of the zigzag segments is 1.23 eV lower than that of the rectangular segments according to the DFT energetics (see note 111 where is the lattice constant. , , , , , , and . Taking a = 2.3036 Å, the total surface energy of the zigzag configuration is 3.67 eV for EAM and 3.93 eV for DFT. The total surface energy of the rectangular segments is 3.62 eV for EAM and 5.16 eV for DFT.). Therefore, the zigzag segments are preferred in QCDFT while the rectangular segments are favored in EAM-QC. The same conclusion holds for other loadings as well.
5.2 Deformation twinning at the crack tip
According to the Peierls criterion of deformation twinning at a crack tip (Tadmor and Hai, 2003), one can define twinnability which is the likelihood of a material to twin as opposed to slip at the crack tip. The dimensionless twinnability can be expressed as (Tadmor and Bernstein, 2004)
| (4) |
The coefficients 1.136 and 0.151 are universal constants for an fcc lattice. , , and are intrinsic stacking fault, unstable stacking fault and unstable twinning energy respectively. A material will emit a dislocation before twinning if and will twin first if . Our DFT and EAM calculations find that is less than 1 as shown in Table I, which suggests that no true deformation twinning along (111) plane be formed, consistent with the QCDFT and EAM-QC simulation results. However, a two-layer-wide micro-twin along () plane is formed in EAM-QC while no such twin is present in QCDFT. The distinction between the QCDFT and EAM-QC results is due to the large discrepancy of , which is the energy barrier for a leading partial nucleation at a crack tip (Rice, 1992). The large DFT value of renders the nucleation of the leading partial difficult, which in turn prohibits the formation of deformation twinning.
5.3 Electron density at the crack tip
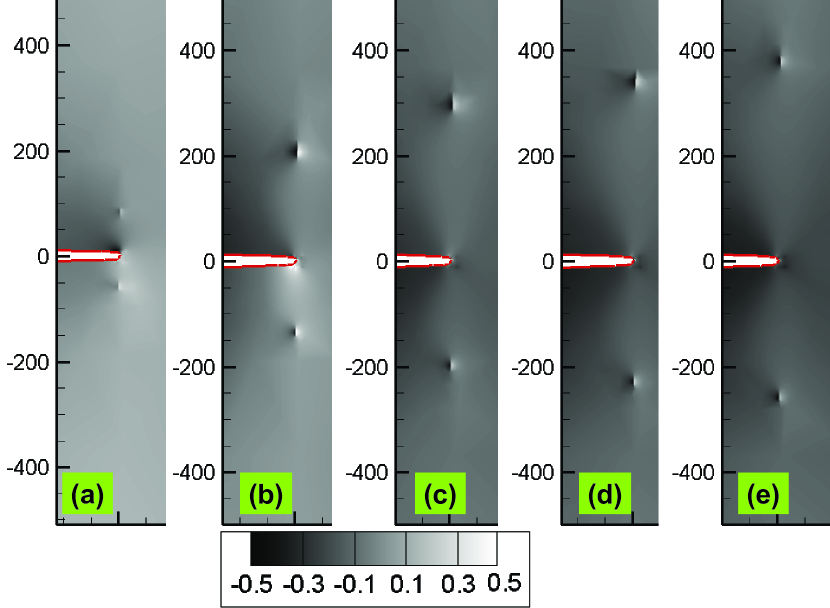
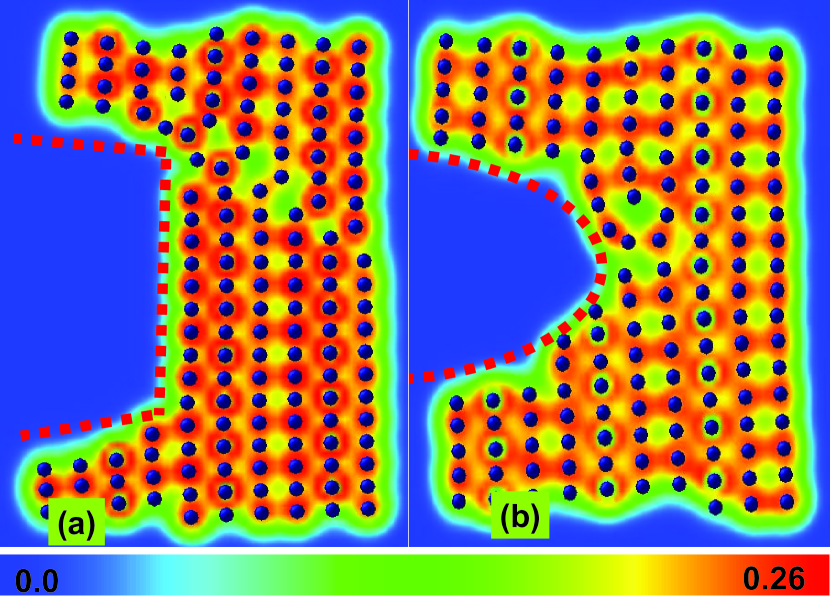
In Fig. 10, we present the electron charge density around the crack tip for the EAM-QC configuration of (left) and the QCDFT configuration of (right). The charge density for EAM-QC is determined by a superposition of atomic densities (obtained by VASP) centered at each EAM atoms. The distortion of charge density due to the defects is clearly visible. In EAM-QC the atomic bonding is weakened along the twin plane while in QCDFT the atomic bonding is significantly disrupted at the center of the crack. More importantly, the charge density profile of QCDFT is smoother than that of EAM-QC as indicated by the dashed curves. The “sharp” corners of EAM-QC charge density lead to higher kinetic energy of electrons. Since EAM-QC does not involve quantum mechanics, the “sharp corner” is not penalized energetically and thus permissible. Of course, the electron charge density profile reflects the underlying atomic structure: “sharp corners” correspond to a straight crack front thanks to a single active slip plane; smooth corners correspond to a more rounded crack front.
6 CONCLUSION
In summary, we have carried out a comparative study of fracture in Al by using two distinctive atomic interactions: quantum mechanical density functional theory and empirical embedded atom method. The DFT description of the crack tip is achieved by QCDFT method while the empirical description by EAM-QC method. In addition to quantitative differences, qualitatively different fracture behavior is also observed between the two methods. EAM-QC predicts a more or less rectangular crack tip configuration while QCDFT yields a more rounded tip profile. The difference is due to the fact that the emitted dislocations glide on a single slip plane in EAM-QC while two adjacent slip planes are active in QCDFT. As the stress intensity factor is increased, more and more dislocations are emitted from the crack tip in EAM-QC while the number of dislocations remains the same up to the maximum loading applied in QCDFT calculations. A micro-twin is observed at the crack tip in EAM-QC, but it is absent in QCDFT. The electron density profile at the crack tip is also different between EAM-QC and QCDFT. All these differences can be understood in terms of defect energetics, including surface energy and stacking fault energy.
The different results received suggest that the atomic nature of a crack tip is important and an accurate description of the atomic interaction at the crack tip is indispensable. Although empirical potentials can be developed by fitting to DFT results, it is unlikely they will reproduce all relevant DFT energetics. This is particularly so since one does not know a priori what are the relevant energetics for a given crack. If several chemical species are present in a crack tip, the task of fitting a satisfactory potential becomes even more daunting. Therefore the solution lies at an explicit quantum mechanical description of the crack tip, most likely in a form of DFT-based multiscale modeling, such as QCDFT. The present paper concerns atomistic aspect of fracture which is important for many purposes. However, there are interesting fracture phenomena that do not depend on atomistic features and thus are beyond the scope of the present paper. Finally, we have not touched upon fracture dynamics. The questions - such as will finite temperature dynamics amplify or diminish the differences that we observed and what are the best strategies to implement dynamics in a multiscale setting - remain unanswered. We hope that the present paper could spawn more research effort in answering these questions.
7 ACKNOWLEDGEMENTS
We thank Ellad Tadmor for his assistance of constructing the crack model and many helpful discussions. The work at California State University Northridge was supported by NSF PREM grant DMR-0611562 and DoE SciDAC grant DE-FC02-06ER25791.
References
- Bernstein and Hess (2003) Bernstein, N., Hess, D. W., 2003. Lattice trapping barriers to brittle fracture. Phys. Rev. Lett. 91 (2), 025501.
- Bernstein et al. (2009) Bernstein, N., Kermode, J. R., Csanyi, G., 2009. Hybrid atomistic simulation methods for materials systems. Rep. Prog. Phys. 72, 026501.
- Broughton et al. (1999) Broughton, J. Q., Abraham, F. F., Bernstein, N., Kaxiras, E., 1999. Concurrent coupling of length scales: Methodology and application. Phys. Rev. B 60 (4), 2391–2403.
- Buehler et al. (2006) Buehler, M. J., van Duin, A. C. T., Goddard III, W. A., 2006. Multiparadigm modeling of dynamical crack propagation in silicon using a reactive force field. Phys. Rev. Lett. 96 (9), 095505.
- Choly et al. (2005) Choly, N., Lu, G., E, W., Kaxiras, E., 2005. Multiscale simulations in simple metals: A density-functional-based methodology. Phys. Rev. B 71 (9), 094101.
- Csányi et al. (2004) Csányi, G., Albaret, T., Payne, M. C., De Vita, A., 2004. Learn on the fly: A hybrid classical and quantum-mechanical molecular dynamics simulation. Phys. Rev. Lett. 93 (17), 175503.
- Ercolessi and Adams (1994) Ercolessi, F., Adams, J. B., 1994. Interatomic potentials from 1st-principles calculations - the force-matching method. Europhys. Lett. 26 (8), 583–588.
- Gavini et al. (2007) Gavini, V., Bhattacharya, K., Ortiz, M., 2007. Quasi-continuum orbital-free density-functional theory: A route to multi-million atom non-periodic DFT calculation. J. Mech. Phys. Solids 55 (4), 697–718.
- Griffith (1920) Griffith, A. A., 1920. The phenomenon of repture and flow in solids. Phil. Trans. Roy. Soc. London A221, 163.
- Hai and Tadmor (2003) Hai, S., Tadmor, E. B., 2003. Deformation twinning at aluminum crack tips. Acta Mater. 51 (1), 117–131.
- Hayes et al. (2006) Hayes, R. L., Ho, G., Ortiz, M., Carter, E. A., 2006. Prediction of dislocation nucleation during nanoindentation of Al3Mg by the orbital-free density functional theory local quasicontinuum method. Philos. Mag. 86, 2343.
- Hirth and Lothe (1970) Hirth, J. P., Lothe, J., 1970. Theory of Dislocations. McGraw-Hill, New York.
- Hoagland et al. (1990) Hoagland, R. G., Foiles, S. M., Baskes, M. I., Daw, M. S., 1990. An atomic model of crack tip deformation in aluminum using an embedded atom potential. J. Mater. Res. 5, 313.
- Kohlhoff et al. (1991) Kohlhoff, S., Gumbsch, P., Fischmeister, H. F., 1991. Crack-propagation in bcc crystals studied with a combined finite-element and atomistic model. Phil. Mag. A 64, 851.
- Kresse et al. (1993) Kresse, G., , Hafner, J., 1993. Ab initio molecular dynamics for liquid metals. Phys. Rev. B 47, 558.
- Kresse and Furthuller (1996a) Kresse, G., Furthuller, J., 1996a. Efficiency of ab-initio total energy calculations for metals and semiconductors using a plane-wave basis set. Comput. Mater. Sci. 6, 15.
- Kresse and Furthuller (1996b) Kresse, G., Furthuller, J., 1996b. Efficient iterative schemes for ab initio total-energy calculations using a plane-wave basis set. Phys. Rev. B 54, 11169.
- Kresse and Hafner (1994) Kresse, G., Hafner, J., 1994. Ab initio molecular-dynamics simulation of the liquid-metal camorphous-semiconductor transition in germanium. Phys. Rev. B 49, 14251.
- Liu et al. (2007) Liu, Y., Lu, G., Chen, Z., Kioussis, N., 2007. An improved QM/MM approach for metals. Simul. Mater. Sci. Eng. 15, 275.
- Lu and Kaxiras (2005) Lu, G., Kaxiras, E., 2005. Overview of Multical Simulations of Materials. in Theoretical and Computational Nanotechnology. American Scientific Publisher, Stevenson Ranch, CA, Ch. 22.
- Lu et al. (2006) Lu, G., Tadmor, E. B., Kaxiras, E., 2006. From electrons to finite elements: A concurrent multiscale approach for metals. Phys. Rev. B 73, 024108.
- Miller et al. (1998) Miller, R., Tadmor, E. B., Phillips, R., Ortiz, M., 1998. Quasicontinuum simulation of fracture at the atomic scale. Modelling Simul. Mater. Sci. Eng. 6, 607.
- Mills and Stadelmann (1989) Mills, M. J., Stadelmann, P., 1989. A study of the structure of lomer and 60-degrees dislocations in aluminum using high-resolution transmission electron-microscopy. Philos. Mag. A 60 (3), 355–384.
- Monkhorst and Pack (1976) Monkhorst, H. J., Pack, J. D., 1976. Special points for brillouin-zone integrations. Phys. Rev. B 13, 5188.
- Ogata et al. (2001) Ogata, S., Lidorikis, E., Shimojo, F., Nakano, A., Vashishta, P., Kalia, R. K., 2001. Hybrid finite element moleculardynamics electronic density functional approach to materials simulations on parallel computers. Comput. Phys. Commun. 138 (2), 143–154.
- Peng et al. (2008) Peng, Q., Zhang, X., Hung, L., Carter, E. A., Lu, G., 2008. Quantum simulation of materials at micron scales and beyond. Phys. Rev. B 78, 054118.
- Rice (1992) Rice, J. R., 1992. Dislocation nucleation from a crack tip: an analysis based on the Peierls concept. J. Mech. Phys. Solids 40, 239–271.
- Shenoy et al. (1999) Shenoy, V. B., Miller, R., Tadmor, E. B., Rodney, D., Phillips, R., Ortiz, M., 1999. An adaptive finite element approach to atomic-scale mechanics - the quasicontinuum method. J. Mech. Phys. Solids 47, 611.
- Sih and Liebowitz (1968) Sih, G. C., Liebowitz, H., 1968. Fracture: an advanced treatise. Vol. 2. Academic, New York, Ch. Mathematical theories of brittle fracture, p. 68.
- Tadmor and Bernstein (2004) Tadmor, E. B., Bernstein, N., 2004. A first-principles measure for the twinnability of FCC metals. J. Mech. Phys. Solids 52, 2507–2519.
- Tadmor and Hai (2003) Tadmor, E. B., Hai, S., 2003. A Peierls criterion for the onset of deformation twinning at a crack tip. J. Mech. Phys. Solids 51, 765–793.
- Tadmor et al. (1999) Tadmor, E. B., Miller, R., Phillips, R., 1999. Nanoindentation and incipient plasticity. J. Mater. Res. 14, 2249.
- Tadmor and Miller (2005) Tadmor, E. B., Miller, R. E., 2005. Handbook of Materials Modeling. Vol. 1. Kluwer Academic Publishers, Ch. The Theory and Implementation of the Quasicontinuum Method.
- Van der Giessen and Needleman (2002) Van der Giessen, E., Needleman, A., 2002. Micromechanics simulations of fracture. Annual Review of Materials Research 32, 141–162.
- Zhang and Lu (2007) Zhang, X., Lu, G., 2007. Quantum mechanics/molecular mechanics methodology for metals based on orbital-free density functional theory. Phys. Rev. B 76, 245111.