A Broad-Band FT-ICR Penning Trap System for KATRIN 111The results which are presented here are part of the PhD thesis of M. Ubieto-Díaz
Abstract
The KArlsruhe TRItium Neutrino experiment KATRIN aims at improving the upper limit of the mass of the electron antineutrino to about 0.2 eV (90 c.l.) by investigating the -decay of tritium gas molecules . The experiment is currently under construction to start first data taking in 2012. One source of systematic uncertainties in the KATRIN experiment is the formation of ion clusters when tritium decays and decay products interact with residual tritium molecules. It is essential to monitor the abundances of these clusters since they have different final state energies than tritium ions. For this purpose, a prototype of a cylindrical Penning trap has been constructed and tested at the Max-Planck-Institute for Nuclear Physics in Heidelberg, which will be installed in the KATRIN beam line. This system employs the technique of Fourier-Transform Ion-Cyclotron-Resonance in order to measure the abundances of the different stored ion species.
keywords:
Atomic masses, mass spectra, abundances , Fourier-transform mass spectrometry , Ion cyclotron resonance mass spectrometryPACS:
32.10 Bi. , 82.80.Nj. , 82.80.Qx.1 Introduction
The observation of neutrino oscillations in recent experiments implies a non-zero neutrino mass () [1]. So far, the experiments aiming at directly measuring the neutrino mass only succeeded to set an upper limit (see e.g. the recent review by Otten and Weinheimer [2]).
The most recent evaluation of the limit of the antineutrino mass, which yields eV (90 c.l.) [3], is based on the results from two experiments, both performed by means of an electrostatic spectrometer, one in Troitsk [4] and the other at the University of Mainz [3]. In these experiments, the neutrino mass is extracted by analyzing the energy region near the end-point energy of the -decay spectrum of tritium ( y, keV which is derived from the 3He-T mass difference [5]). In the decay , only an energy interval eV below is used for the analysis. However, the fraction of electrons in this energy interval is only . In order to improve the sensitivity or reduce the upper limit of by studying the -decay of T2, long data collection periods using a strong tritium source and a spectrometer with a large acceptance solid angle for the electrons coming from the decay are required. To this end, the KArlsruhe TRItium Neutrino experiment (KATRIN) [6] was initiated aiming at reaching eV (90 c.l.). Figure 1 shows the KATRIN beam line indicating the main components.
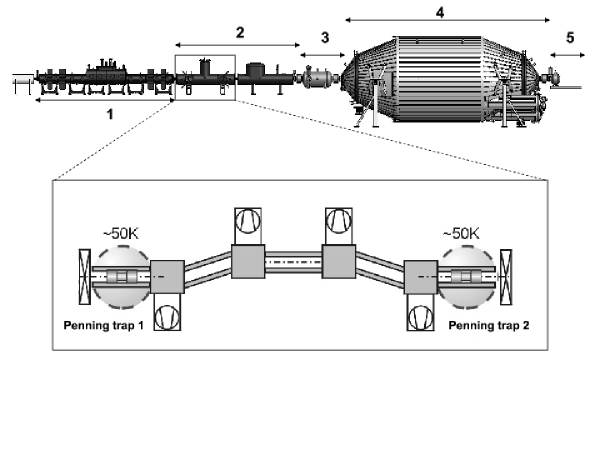
An important issue to control systematic effects in KATRIN is the precise knowledge of the abundance of ion species such as T+, T-, 3He+, (3HeT)+, T2+, T3+, T5+, and even larger cluster ions formed by decay, ionization processes and chemical reactions, since they have different final state energy spectra than . Assuming a T2 density of cm-3 in the source position, the expected density for T- is cm-3, and the one for T+ is in the range - cm-3. For monitoring these ion species, two Penning trap systems will be installed in the transport section of KATRIN. This section is marked with 2 in the upper part of Fig. 1. The comparison of the concentrations of the different species observed in the two traps will also serve to monitor the level of suppression of contaminating ions by the use of crossed electric and magnetic fields in the cryogenic transport section, while allowing the -decay electrons to pass and to enter the spectrometers.
The monitoring of the ion species captured in the Penning trap is done by detecting the image current induced in the ring electrodes. The mass-to-charge ratio of the different ion species confined in the trap is extracted from the measurements of their so-called modified-cyclotron frequencies (). This is a non-destructive detection method known as Fourier-Transform Ion-Cyclotron-Resonance (FT-ICR) technique [7, 8], commonly used in chemistry [9]. The ratio of the different cluster ions formed in the KATRIN source can be determined since the FT-ICR technique allows monitoring of all the ion species simultaneously. The amplitudes of the signals observed in the frequency spectrum are proportional to the number of ions for each ion species.
The maximum resolving power required for the FT-ICR Penning traps to be installed at KATRIN is in the order of for MHz in order to distinguish T+ from 3He+ ions. The minimum number of ions needed to observe an FT-ICR signal is expected to be in the order of a few thousand ions in the mass range of interest. This sensitivity will be further enhanced once the traps and the detection system are installed in the KATRIN beam line at the cryogenic temperature K. In the following, the KATRIN Penning trap system as well as its commissioning will be presented. For the characterization, the mass-to-charge ratios of the different test species were not monitored simultaneously in the frequency spectrum.
2 The KATRIN Penning trap: principle and experimental setup
In the ideal Penning trap, the electric potential is harmonic and the ions are confined by the combination of an electrostatic and a magnetic field [10, 11].
This electric field allows for confinement in the axial direction (), while the magnetic field confines the ions in the radial plane. As a result, the motion of trapped charged particles in an ideal Penning trap can be described as the superposition of three independent motions with characteristic eigenfrequencies. The frequencies are:
| (1) |
for the axial motion and
| (2) |
for the modified cylotron (+) and magnetron () motions, respectively. In Eq. (1), is the mass of the ion, the electric charge, the potential difference between ring and endcap electrodes, and is a parameter which describes the trap dimensions [10]. This parameter reads:
| (3) |
where and are the minimum distance from the center of a hyperbolic trap to the ring and endcap electrodes, respectively. in Eq. (2) represents the cyclotron frequency of a charged particle moving in a pure magnetic field and is given by:
| (4) |
The characteristic frequency of the reduced-cyclotron motion is slightly lower than the free cyclotron frequency. In an ideal Penning trap Eq. (2) obeys the relation In a real Penning trap, is valid and it is known as the Brown-Gabrielse invariance theorem [12].
The identification of the ions in FT-ICR mass spectrometry is mainly done by measuring [8]. The induced ion current is measured during a fixed time and the frequency is unfolded after applying Fourier transformation. The induced current of an ion with kinetic energy is given by the relationship [7]:
| (5) |
where is the so-called effective distance in the trap, which is in the order of the trap diameter. This current, which is typically in the order of a few fA, transforms into a voltage signal by flowing through parasitic capacitances, either of the trap itself or of the attached current amplifiers. The resulting voltage signal for one ion is , where is the sum of all capacitances present at the trap electrodes. In the KATRIN trap pF.
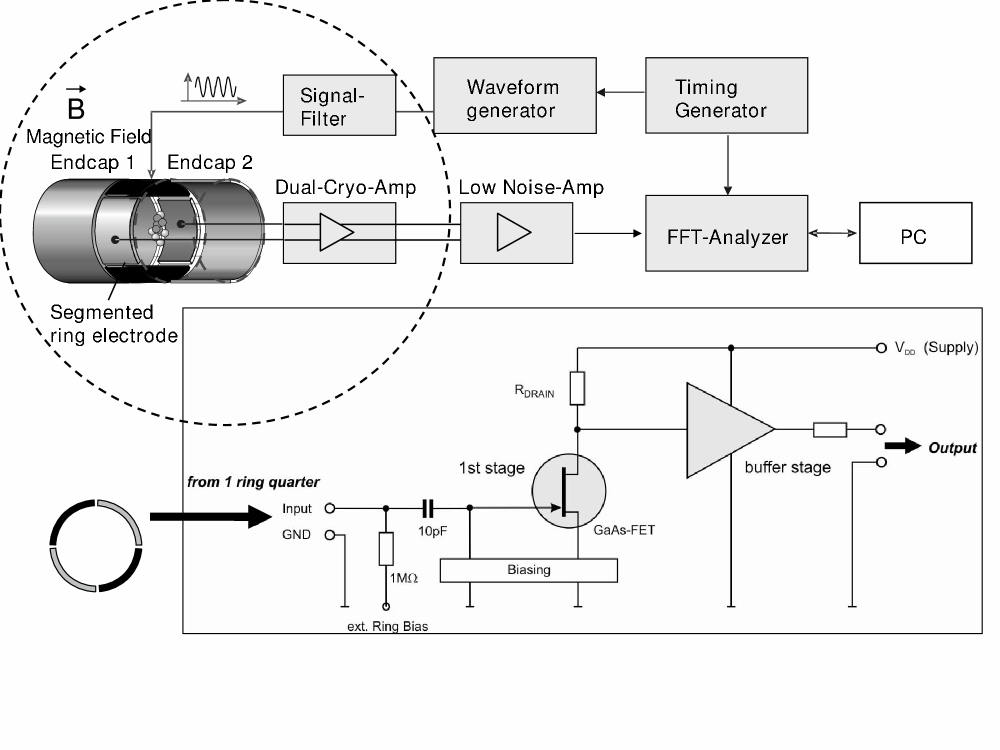
The KATRIN trap system is a three-electrode cylindrical Penning trap [10] shown schematically in Fig. 2. The trap with an inner diameter of mm consists of one ring and two endcap electrodes. This is unusually large in order to allow for an efficient transport of the electrons from the source to the spectrometers in the KATRIN experiment. The ring electrode is four-fold segmented as shown schematically in Fig. 2. One pair of opposite segments is used for excitation of the ion motion and the other one is used for detection. The excitation is done by applying a radio-frequency (RF) dipolar field scanning the frequency around the modified cyclotron frequency of the ions stored in the trap. The ions then gain energy from the RF dipolar field and the induced current is detectable provided a) sufficient number of ions are stored in the trap, b) they move coherently, and c) the resulting signal is above the noise level. The signal-to-noise ratio is given by:
| (6) |
where are introduced above, the bandwidth of one FFT channel, and is the noise density. The later is a measurement of the input voltage noise in a certain frequency width at the analyzer and is given in V/Hz1/2.
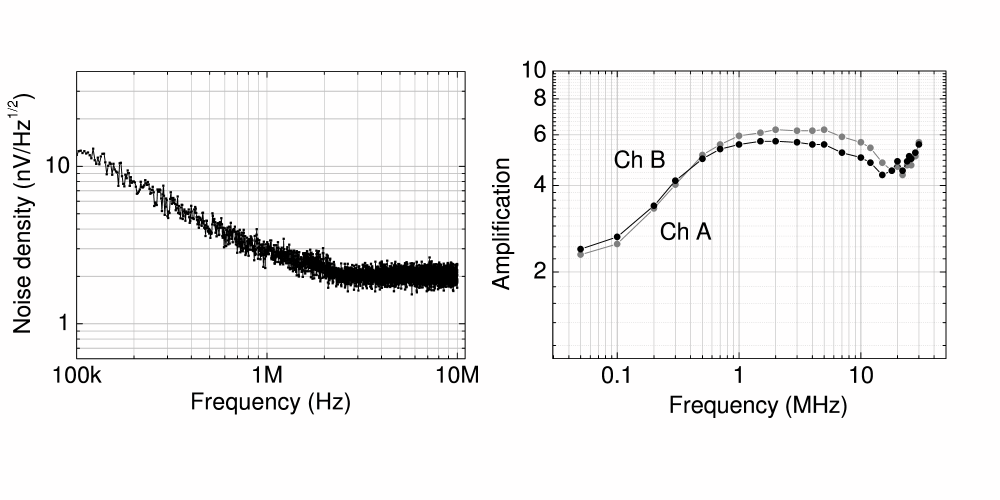
Amplifier boxes containing the preamplification stages, which are designed to be operated at a later time under cryogenic temperatures, are attached to the trap. In a first stage the signal is passed through a GaAs Field Effect Transistor (FET) amplifier mounted on the trap assembly. The electronic circuit for one channel is shown in the square box of Fig. 2. Some characteristics of the amplifier are shown in Fig. 3. In the frequency range of interest (1-20 MHz) a noise-density level below 3 nV/Hz1/2 and an amplification of about was achieved. The second amplification (25-fold amplification) takes place outside the vacuum chamber. The signal is fed into an FFT analyzer to compute the frequency spectrum. For the measurements presented here an analyzer from Rohde Schwarz model FSP3 with a frequency range from 9 kHz to 3 GHz was used.
The test setup comprises an electron impact ion source, a micro-channel plate detector and the Penning trap system housed in a superconducting magnet. The magnet provides a field strength of 4.7 T in the center of the trap. This value is slightly smaller than the field strength in the KATRIN beam line (5.6 T). For the tests presented here ions were created either by discharges or by electron impact on gas molecules and atoms inside the trap. The electrons were produced using an ion source with a photoelectric-emission cathode constructed to test different components of the KATRIN experiment [13].
3 Results
The measurements presented here were performed at room temperature using He+, H2O+ and N2+ ions as test species. All species were identified by exciting the ion motion at their modified cyclotron frequency. The trap system was running in repeated cycles. The cycle time was 100 ms and the measurement sequence consisted of three steps:
-
1.
injection (100 s): endcap at 0 V and endcap at potential .
-
2.
trapping (100 ms): endcap and at potential .
-
3.
ejection (100 s): endcap at potential and endcap at 0 V.
The ring electrode was always at ground potential. During trapping, dipolar excitation at a frequency around the nominal value was applied. This excitation frequency was varied after each cycle “injection-trapping-ejection” in steps of 50 Hz. The amplitude of the induced (FT-ICR) signal was recorded every cycle for the corresponding frequency. Figure 4 shows the amplitudes of the FT-ICR signals for trapped He+ and H2O+ ions. The number of RF excitation periods in the waveform generator (AGILENT model 33250A) was 20,000. Thus, the duration for the excitation for any cycle (data point) was ms for He+ ions and ms for H2O+ ions.
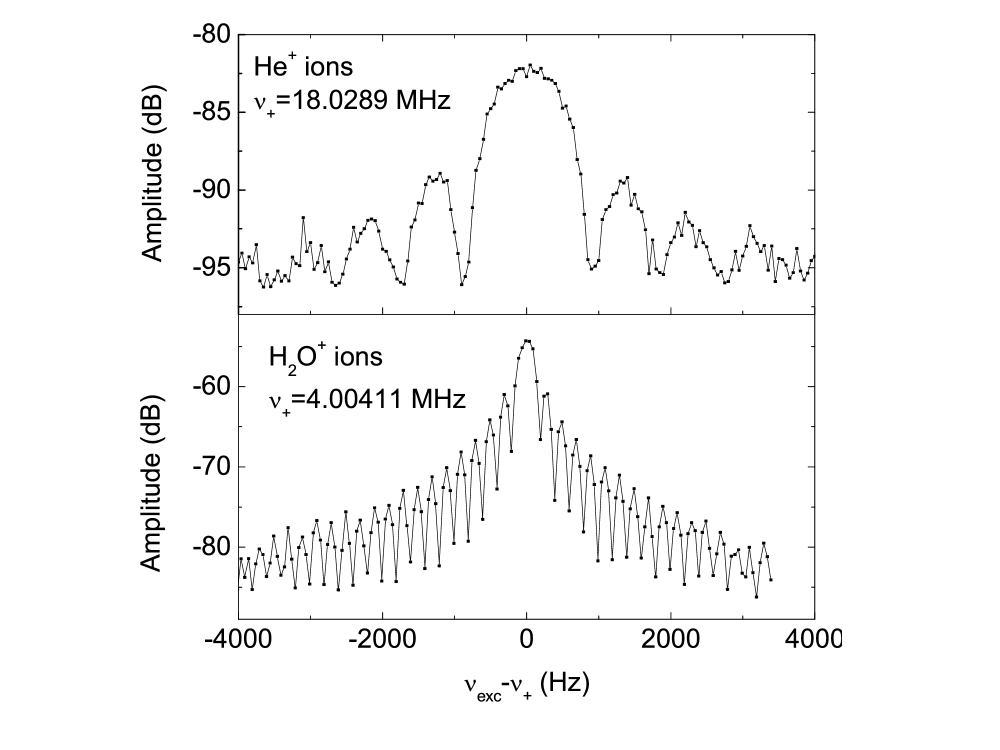
The side bands in Fig. 4 arise from the finite excitation, which has in the time domain a rectangular shape. The mass resolving power with being the full-width-at-half-maximum is for He+ ions and for H2O+ ions, respectively. Measurements with He+ ions were also carried out for longer excitation times of 5.5 ms using 100,000 RF periods resulting in . A resolving power of will be required to distinguish in the frequency spectrum T+ from 3He+ ions. This will be possible due to the higher frequency and by chosing a proper excitation time of about 10 ms. For all these measurements the acquisition time to record the image current was ms. Larger observation times imply a reduction in the amplitude of the FT-ICR signal due to the short coherence time.
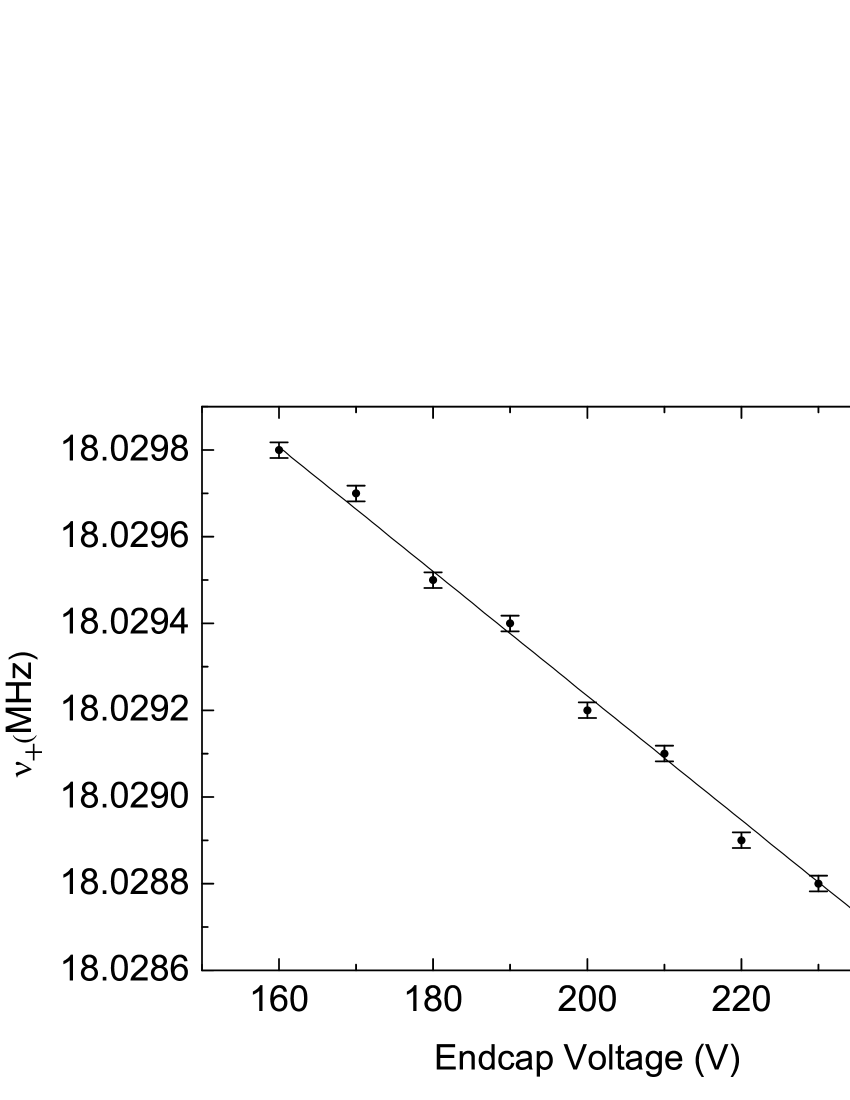
After probing the excitation, the FT-ICR signal at was recorded for different potentials applied to the endcap electrodes. Figure 5 shows the modified cyclotron frequency for He+ ions as a function of the voltage applied to the endcap electrodes. The solid line is the result of a least-square linear fit following the relationship:
| (7) |
which is obtained from Eq. (2) by substituting and . Applying a linear fit to the data shown in Fig. 5 and using the mass value for He+ [14], one can obtain the magnetic field from the first term in Eq. (7) as T. Similar measurements were perfomed with H2O+ ions yielding T. The parameter was also obtained using Eq. (7). The results are (He) cm and (H2O) cm, also in excellent agreement.
The last set of measurements presented here to characterize the Penning traps was dedicated to determine the minimum number of ions needed to observe an FT-ICR signal at room temperature. For these measurements a set of two attenuation grids were mounted in front of the micro-channel plate detector resulting in an intensity reduction by a factor of . This allowed the characterization of the trap with up to about 20,000 ions. The attenuation factor of 100 was measured with laser light and a photodiode. The voltage signal from the photodiode was measured using a multimeter for both situations, i.e. with and without the attenuation grids behind the laser beam. The results of the measurements are shown in Fig. 6 for He+ ions. The -axis of the figure is the signal-to-noise ratio recorded with the FFT analyzer running in average mode. Each data point is the average over 100 measurements.

The number of detected ions was corrected for the micro-channel plate detection efficiency of 30 [15]. After correction, the minimum number for 4He+ ions is around 6,000. This number is higher than the one for H2O+ ions, which was measured to be around 1,000. This can be explained by the different effective voltages () and by the different amplification factors in the frequency domain (see Fig. 3).
The maximum number of ions detectable by this technique was not yet reached in the experiments described above. The maximum FT-ICR signal measured yielded an amplitude four times higher than the one associated to 20,000 trapped ions shown in Fig. 6. The number of ions arriving at the micro-channel plate was not measured due to saturation of the detector. The characterization in this case requires further attenuation in front of the detector. If one assumes a linear dependence, the maximum signal observed would correspond to about 150,000 He+ ions. FT-ICR signals with larger amplitudes have been observed for H2O+ ions.
4 Conclusions and outlook
In this paper, the experimental setup as well as first results obtained with the three-electrode Penning trap system developed for the KATRIN experiment are presented. Excitation at the modified cyclotron frequency of stored ions and detection of the induced image current in the trap electrodes have been accomplished. These results show the proof of principle of the three-electrode Penning trap system to be operated in the KATRIN beamline and reveal its present performance. The noise-signal density at room temperature of the GaAs FET-based amplifier is nV/Hz1/2, and the amplification factor is between 4 and 6 in the frequency range of interest for KATRIN. In this range, the present limit in sensitivity is around 6,000 ions for mass and about 1,000 ions for . Still the sensitivity limit can be improved once the three-electrode Penning trap system is operated at cryogenic temperatures in the transport section of the KATRIN beam line. The resolving power has to exceed to distinguish in the frequency spectrum T+ from 3He+ ions. This is feasible with the current system if excitation times above 10 ms are used.
5 Acknowledgement
The two Penning traps have been financed by the BMBF (grant to the University of Karlsruhe) under project codes 05CK5VKA/5 and 05A08VK2. The support of the Deutsche Forschungsgemeinschaft for the development of the FT-ICR detection technique for precision mass spectrometry under contract number BL981-2-1 is gratefully acknowledged. We thank A. Gotsova for her help during tests in Mainz and Prof. C. Weinheimer for useful discussions related to this project. We warmly thank the LPC trappers group for providing the attenuation grids. D. Rodríguez is a Juan de la Cierva fellow and acknowledges support from the Spanish Ministry of Science and Innovation through the José Castillejo program to provide funding for a five-months stay at the MPI-K. Sz. Nagy acknowledges support from the Alliance Program of the Helmholtz Association EMMI. S. Luckic acknowledges support by the Transregional Collaborative Research Centre No. 27 “Neutrinos and Beyond”, funded by Deutsche Forschungsgemeinschaft.
References
- [1] Q. Ahmad , Phys. Rev. Lett. 89 (2002) 89.
- [2] E.W. Otten and C. Weinheimer, Rep. Prog. Phys. 71 (2008) 086201.
- [3] C. Kraus , Eur. Phys. J. C 40 (2005) 447.
- [4] A.I. Belesev , Phys. Lett. B 350 (1995) 263.
- [5] S. Nagy , Europhys. Lett. 74 (2006) 404.
- [6] J. Angrik , KATRIN Design Report 2004. Wissenschaftliche Berichte FZKA 7090.
- [7] M. Comisarow , J. Chem. Phys. 69 (1978) 4097.
- [8] A.G. Marshall , Mass Spectrom. Rev. 17 (1998) 1.
- [9] A.G. Marshall , Int. J. Mass Spectrom. 200 (2000) 331.
- [10] L. Brown and G. Gabrielse, Rev. Mod. Phys. 58 (1986) 233.
- [11] K. Blaum, Phys. Rep. 425 (2006) 1.
- [12] S. Brown and G. Gabrielse, Phys. Rev. A 25 (1982) 2423.
- [13] M. Schöppner, Diploma Thesis, Westfälische Wilhelms-Universität Münster, 2008.
- [14] G. Audi , Nucl. Phys. A 729 (2003) 337.
- [15] J.L. Wiza, Nucl. Instrum. Methods 162 (1979) 587.