Is the current lack of solar activity only skin deep?
Abstract
The Sun is a variable star whose magnetic activity and total irradiance vary on a timescale of approximately 11 years. The current activity minimum has attracted considerable interest because of its unusual duration and depth. This raises the question: what might be happening beneath the surface where the magnetic activity ultimately originates? The surface activity can be linked to the conditions in the solar interior by the observation and analysis of the frequencies of the Sun’s natural seismic modes of oscillation - the modes. These seismic frequencies respond to changes in activity and are probes of conditions within the Sun. The Birmingham Solar-Oscillations Network (BiSON) has made measurements of -mode frequencies over the last three solar activity cycles, and so is in a unique position to explore the current unusual and extended solar minimum. We show that the BiSON data reveal significant variations of the -mode frequencies during the current minimum. This is in marked contrast to the surface activity observations, which show little variation over the same period. The level of the minimum is significantly deeper in the -mode frequencies than in the surface observations. We observe a quasi-biennial signal in the -mode frequencies, which has not previously been observed at mid- and low-activity levels. The stark differences in the behavior of the frequencies and the surface activity measures point to activity-related processes occurring in the solar interior, which are yet to reach the surface, where they may be attenuated.
1 Introduction
The level of the Sun’s magnetic activity is observed to vary on an 11-year time scale and we are currently in the minimum between cycles 23 and 24. The current solar minimum is attracting a great deal of attention as it is proving to be quite unusual. Observations of surface and atmospheric effects, such as the number of visible sunspots, the rate of occurrence of solar flares and the strength of the solar wind, highlight just how quiet the Sun is333http://science.nasa.gov/headlines/y2009/01apr_deepsolarminimum.htm.
The Sun’s activity cycle influences everyday life on the Earth. The rate of occurrence of solar flares is dependent on the number of spots on the Sun’s surface, and large solar flares can disrupt satellite communications and cause power outages. Coronal mass ejections (CMEs), which are another source of radiation that can disrupt life on the Earth, are still being observed regularly on the Sun, even in this unusual solar minimum (see the STEREO COR1 CME catalog444 http://cor1.gsfc.nasa.gov/docs/prelim_events/COR1prelimCMErate_Feb2009.pdf). Cosmic rays, which are a significant space radiation hazard, are anticorrelated with the solar cycle. The level of solar activity is possibly correlated to the Earth’s climate (see, for example, Lockwood & Fröhlich, 2007, and references therein). Space-weather groups use predictions of solar cycles to anticipate the amount of orbital drag experienced by satellites.
The next solar cycle has already proven difficult to predict as the current solar minimum is lasting significantly longer than expected. Pesnell (2008) reviews 50 predictions for the size and timing of cycle 24 and finds a wide range of results, especially in comparison to predictions made before the previous solar cycle (Joselyn et al., 1997). For example, predictions of when cycle 24 will reach its maximum range from 2009 December (Maris & Oncica, 2006) to 2014 December (Tsirulnik, Kuznetsova & Oraevsky, 1997). In fact, the official NOAA, NASA and ISES Solar Cycle 24 Prediction Panel, which studied the predictions collated by Pesnell (2008), failed to reach a consensus on when the peak of cycle 24 will occur and how active the upcoming cycle will be. Meanwhile, the number of predictions for cycle 24 is ever increasing.
Surface measures of the Sun’s activity, such as the number of sunspots, which are used to aid cycle predictions, indicate that we are still in an extended solar-cycle minimum. We ask the question: can we learn anything about this unusual solar minimum from the Sun’s interior?
To answer this question we investigate the variation with the solar cycle of the frequencies of the Sun’s natural resonant oscillations, which are known as modes. Solar modes are trapped in cavities below the surface of the Sun and their frequencies are sensitive to properties, such as temperature and mean molecular weight, of the solar material. It has been known since the mid 1980s (Woodard & Noyes, 1985) that -mode frequencies vary throughout the solar cycle with the frequencies being at their largest when the solar activity is at its maximum. By examining the changes in the observed -mode frequencies throughout the solar cycle, we can learn about solar-cycle-related processes that occur beneath the Sun’s surface.
The Birmingham Solar-Oscillations Network (BiSON; Chaplin et al., 1996) makes Sun-as-a-star (unresolved) Doppler velocity observations, which are sensitive to the modes with the largest horizontal scales (or the lowest angular degrees, ). Consequently, the frequencies measured by BiSON are of the truly global modes of the Sun. These modes travel to the Sun’s core but their dwell time at the surface is longer than at the solar core because the sound speed inside the Sun increases with depth. Consequently, the low- modes are most sensitive to variations in regions of the interior that are close to the surface and so are able to give a global picture of the influence of near-surface activity. BiSON is a network of autonomous ground-based observatories that are strategically positioned at various longitudes in order to provide as continuous coverage as possible of the Sun. BiSON is in a unique position to study the changes in oscillation frequencies that accompany the solar cycle as it has now been collecting data for over 30 years. However, when the network was first established the quality of the data was relatively poor, in comparison to recent years, because of the sporadic coverage of the observations. Here, we have been able to analyze the mode frequencies observed during the last two solar cycles in their entirety.
2 Analysis and results
The precision with which -mode frequencies can be determined is directly related to the length of time series under consideration. Consequently, -mode frequencies are often determined from time series whose lengths are of the order of years. However, a compromise must be made here regarding the appropriate length of time series for study so that changes in the solar cycle can be resolved. Before 1985 April the observed data are sparse because the early BiSON data were collected from just one or two sites and, initially, just in summer months in the northern hemisphere. Therefore, when considering the data collected before 1985 April the -mode frequencies were obtained from seven time series of different lengths, which reflected the availability of data. These data are included here for completeness but are not used in the later analysis as the data are too sparse to provide reliable results. After the third BiSON site, at Carnarvon, Western Australia, was established in 1985 the duty cycle of the BiSON data increased significantly. Therefore, after 1985 April 22 the time series were truncated to 54 days in length, which corresponds to approximately twice the rotation period of the solar surface. The analysis performed here concentrates on the data obtained after this date.
A standard likelihood maximization method was used to fit the power spectra of these time series (e.g., Chaplin et al., 1999), enabling the observed mode frequencies to be determined. We have concentrated on the strongest modes of oscillation, which are in the frequency band from 2100 to 3500.
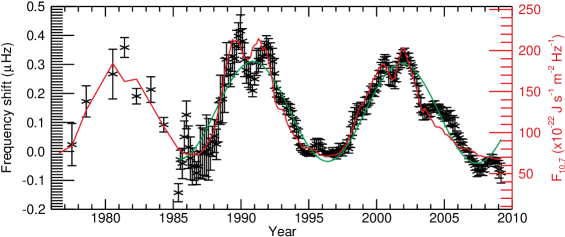
To maintain consistency with previous work (e.g., Chaplin et al., 2007) a minimum activity reference set was determined by averaging the frequencies from time series observed during the minimum activity epoch at the boundary between cycle 22 and cycle 23. We then defined the solar-cycle frequency shifts, , as the differences between frequencies given in the minimum activity reference set and the frequencies of the corresponding modes observed at different epochs and, consequently, different levels of activity. The size of a frequency shift has a well-known dependency on frequency and mode inertia and these dependencies were removed in the manner described in Chaplin et al. (2007). This allowed a weighted average of the frequency shifts observed for each time series to be determined, which provided a mean frequency shift for each epoch, . Figure 1 shows the frequency-shift data that were observed during cycles 21, 22, and 23. The data are shown up to 2009 April. After 1985 April the data plotted in Figure 1 have been smoothed over five points, as the mean frequency shifts were obtained from time series of the same length.
One of the most obvious manifestations of the Sun’s solar cycle is the variation in the number of sunspots on the solar surface, formally recorded as the International Sunspot Number (ISN). However, the sunspot number is not the only variable that can be used as a proxy for the solar activity. For example, the radio flux emitted from the Sun at a wavelength of 10.7cm (hereafter ) also responds to changes in the solar cycle. Many authors (e.g., Elsworth et al., 1990; Howe, 2008, and references therein) have determined and commented upon the good correlations between shifts in the -mode frequencies and activity proxies such as the and the ISN. Therefore, for comparison purposes, the average 10.7 cm flux has been plotted on top of the observed frequency shifts in Figure 1. After the first seven points plotted in Figure 1 the has been smoothed as per the frequency shifts. To determine the scale on which the proxy axis was plotted, a linear least-squares fit between the observed frequency shifts and the activity proxy was performed.
The rise and decline of cycle 23 appears to be slow in comparison to cycle 22. The oscillation frequencies observed in the current unusual solar minimum are significantly lower than the previous minimum in 1996 and the most recent data indicate that we are still on a downward trend. Notice that the shapes of the previous and current solar minima are very similar, with both appearing to show a double minimum. This implies that we may still have to wait some time before the rising phase of cycle 24 begins. It is also interesting to note that, if account is taken of the lower quality of the data observed before 1990, the minimum between cycles 21 and 22 is also deeper than the last solar minimum. This could be because both the minimum between cycles 21 and 22 and the current solar minimum (between cycles 23 and 24) correspond to the same phase of 22-year magnetic Hale cycles.
It is clearly apparent from Figure 1 that there is an unusually large difference between the activity proxy and the frequency shifts on the declining phase of cycle 23. Notably, the frequency shifts are still observed to be changing throughout the solar minimum, which is in contrast to the activity proxy data that show little structure in its variation with time since 2006.
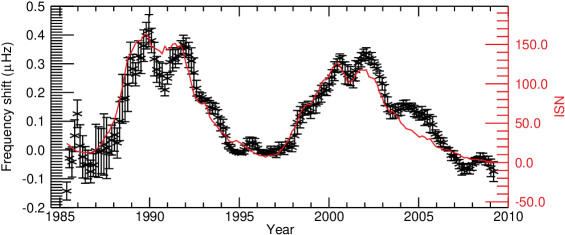
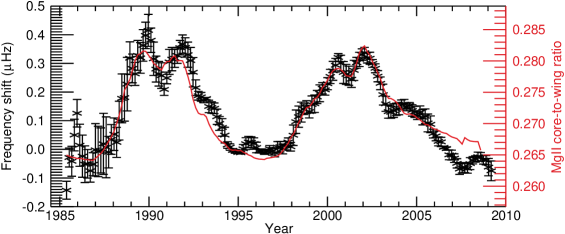
Figure 2 allows a comparison between the BiSON frequency shifts and two proxies of the Sun’s activity, other than the . As noted above the ISN is a measure of the number of active sunspot groups and individual spots on the visible disk. The MgII core-to-wing ratio (Viereck et al., 2001) is determined from space-based UV spectral irradiance measurements. The MgII H and K line cores originate in the chromosphere and the ratio of the core size to that of the more stable background gives a robust indication of the chromospheric activity.
The and the MgII core-to-wing ratio appear to show better agreement with the frequency shifts than the ISN. This behavior has been observed before (Chaplin et al., 2007) and occurs because the frequency shifts are sensitive to both the strong and weak components of the Sun’s magnetic flux. The and the MgII core-to-wing ratio show similar relative sensitivity to the different components of the Sun’s magnetic flux, whereas, the ISN is predominantly sensitive to the strong component of the Sun’s magnetic field.
For the purposes of this Letter it is most important to notice that there are large discrepancies between, respectively, all three of the proxies plotted in Figures 1 and 2 and the frequency shifts in the declining phase of cycle 23. Furthermore, the structure that is observed in the frequency shifts in the current solar minimum is not replicated by any of the proxies. It is also important to note that the seismic minimum is decidedly lower than the minimum predicted by the three proxies. The oscillations are sensitive to the conditions beneath the solar surface, whereas the activity proxy is a measure of the magnetic field that is present on the surface. We therefore assume that there are processes happening in the solar interior, which have yet to manifest themselves at the surface.
2.1 Short-Term Variations in the Frequency Shifts
We now turn our attention to the shorter-term variable structure in the frequency shifts visible on top of the general 11-year trend, which has a period of around two years. Similar “quasi-biennial” variation of activity proxies has been noted before in data from the green coronal emission line at 530.3 nm at high solar activity (Vecchio & Carbone, 2008). These authors used variations near the solar equator and poles and evidence was found of quasi-biennial variability at both low and high latitudes. An explanation of such quasi-biennial behavior has been put forward in terms of two different types of dynamo operating at different depths (Benevolonskaya, 1998a, b). Elsewhere (Saar & Brandenburg, 2002), it has been possible to identify shorter secondary periods in the activity cycles of some stars and it is conceivable that asteroseismology may be able to detect such effects in data sets which will become available, for example, from the recently launched satellite (Christensen-Dalsgaard et al., 2008).
In spite of the known behavior of the proxies, this is the first time that the quasi-biennial variability has been noted in seismic data. Furthermore, the signature of the two-year signal in the activity index was previously restricted to times of moderate to high solar activity. For the first time, we are seeing this short-term variability at low solar activity. To investigate this further, a sine wave was fitted to the frequency shifts observed after 1985 April (see Figure 1). The sine wave took the form
| (1) |
where is the time in years after 1985 April 22, which is the start date of the first 54 d time series. The coefficients are given in Table 1. The sine wave was calculated using a weighted least-squares fit to the unsmoothed frequency shifts. In equation 1, the first collection of terms accounts for the sine wave structure of the frequency shifts. The second and third terms account for an offset which linearly decreases with time.
| 0 | |
|---|---|
| 1 | |
| 2 | |
| 3 | |
| 4 |
We have determined the residuals between the best-fitting sine wave and the observed frequency shifts and the results are plotted in Figure 3. Flux residuals were also determined between a sine wave, which was scaled in amplitude using the linear fit between the flux and the frequency shifts, and the . Clearly, there is a lot of structure in both sets of observed residuals and since the frequency-shift residuals are quite substantial in size. Large discrepancies between the two sets of residuals are clearly evident. A periodogram of the data from the last two cycles shows significant periods of about two and three years with greater than 99% confidence, but the phase of the signal is not locked to that of the underlying 11-year cycle and several incidences of phase jumps are evident, meaning that periods are not easy to determine. The three-year periodicity is not visible in a periodogram of the activity proxy residuals.

3 Summary
The solar-cycle shifts that are observed in -mode frequencies are usually well correlated with proxies of the Sun’s activity, such as the 10.7 cm radio flux. However, in the declining phase of cycle 23 and the current solar minimum we find unusually large differences between the frequencies observed in BiSON data and the activity levels. The current cycle minimum indicated by the helioseismic data is significantly deeper than the minima observed by the activity proxies and the structure that is clearly evident in the frequency shifts is not replicated in the proxy data. We also observe a quasi-biennial signal in the -mode frequencies at all activity levels. Interestingly, this signal is only visible at high-activity levels in the proxy data. As the frequency shifts respond to conditions beneath the surface of the Sun whereas the proxies respond to changes at or above the surface, we suggest that these differences may be caused by changes in the magnetic flux that have yet to manifest at the surface. It is also possible that the magnetic flux responsible for the discrepancies between the frequency shifts and the activity proxies will never reach the Sun’s surface. The analysis presented here was based on averages made over groups of modes (, ). Further work on individual modes may allow one to isolate the location of the variability because each mode shows a different sensitivity to the latitudinal distribution of the surface activity. Such an analysis is currently in progress.
In the seismic data, the previous solar minimum exhibited a double minimum and it appears that the current solar minimum is showing a similar structure. Furthermore, the most recent -mode frequencies indicate that the current minimum is still declining. Therefore, it may still be some time before we observe the rising phase of cycle 24. There have been suggestions that this recent strange behavior of the Sun is indicative that the current grand maximum is about to end (Abreu et al., 2008). That would indeed be an occurrence of great significance. Although our results cannot predict whether this is true they do indicate that the next solar cycle should be observed with great interest.
References
- Abreu et al. (2008) Abreu, J.A., Beer, J., Steinhiber, F., Tobias, S.M. & Weiss, N.O., 2008, Geophys. Res. Lett., 35, 20109
- Benevolonskaya (1998a) Benevolonskaya, E. E., 1998a, ApJ, 509L, 49
- Benevolonskaya (1998b) Benevolonskaya, E. E., 1998b, Sol. Phys., 181, 479
- Chaplin et al. (1999) Chaplin, W. J., Elsworth, Y., Isaak, G. R., Miller, B. A., & New, R., 1999, MNRAS, 308, 424
- Chaplin et al. (2007) Chaplin, W. J., Elsworth, Y., Miller, B. A., Verner, G.A. & New, R., 2007, ApJ, 659, 1749
- Chaplin et al. (1996) Chaplin, W. J. et al., 1996, Sol. Phys., 168, 1
- Christensen-Dalsgaard et al. (2008) Christensen-Dalsgaard et al., 2008, Commun. in Asteroseismol., 157, 266
- Elsworth et al. (1990) Elsworth, Y. et al., 1990, Nature, 345, 536
- Howe (2008) Howe, R., 2008, Adv. Space Res., 41, 846
- Joselyn et al. (1997) Joselyn, J. A. et al., 1997, EOS Trans., 78, 205
- Lockwood & Fröhlich (2007) Lockwood, M. & Fröhlich, C., 2007, Proc. R. S., 463, 2447
- Maris & Oncica (2006) Maris, G. & Oncica, A., 2006, Sun Geosphere, 1, 1
- McComas et al. (2008) McComas, D. J. et al., 2008, Geophys. Res. Lett., 35, 18103
- Pesnell (2008) Pesnell, W. D., 2008, Sol. Phys., 252, 209
- Saar & Brandenburg (2002) Saar, S. H., & Brandenburg, A., 2002, Astron. Nachr., 323, 357
- Tsirulnik, Kuznetsova & Oraevsky (1997) Tsirulnik, L. B., Kuznetsova, T. V. & Oraevsky, V. N., 1997, Adv. S. Res., 20, 2369
- Vecchio & Carbone (2008) Vecchio, A. & Carbone, V. 2008, ApJ, 683, 536
- Viereck et al. (2001) Viereck, R. et al., 2001, Geophys. Res. Lett., 28, 1343
- Woodard & Noyes (1985) Woodard, M. F. & Noyes, R. W. 1985, Nature, 318, 449