Observation of the Kohn anomaly near the K point of bilayer graphene
Abstract
The dispersion of electrons and phonons near the K point of bilayer graphene was investigated in a resonant Raman study using different laser excitation energies in the near infrared and visible range. The electronic structure was analyzed within the tight-binding approximation, and the Slonczewski-Weiss-McClure (SWM) parameters were obtained from the analysis of the dispersive behavior of the Raman features. A softening of the phonon branches was observed near the K point, and results evidence the Kohn anomaly and the importance of considering electron-phonon and electron-electron interactions to correctly describe the phonon dispersion in graphene systems.
pacs:
63.20.D-, 63.20.kd, 78.30.Na, 81.05.UwGraphene systems exhibit a strong electron-phonon coupling at special points in the Brillouin zone, that softens the phonon energy and gives rise to kinks in the phonon dispersion (infinities in ), which are called Kohn anomaly piscanec04 ; Kohn . This effect has been demonstrated experimentally at the point of monolayer and bilayer graphene using gated Raman scattering experiments pisana07 ; yan07 ; das08 ; das09bi ; yan08bi ; malardprl08 . However, the electron-phonon coupling is expected to be stronger at the K point piscanec04 , but Raman experiments in graphene systems performed with visible light cannot probe phonons near the K point das08 . Moreover, in the case of AB-stacked bilayer graphene, due to its special electronic and phonon structure castronetoreview , Raman experiments involve phonons closer to the K point when compared to monolayer graphene malardreports09 . This work presents a resonance Raman investigation of AB-stacked bilayer graphene using many laser lines in the near-infrared (near-IR) and visible range. The Kohn anomaly for both symmetric (S) and anti-symmetric (AS) phonons was evidenced, and results show the importance of considering higher renormalization terms such as electron-electron interactions to correctly describe the phonon dispersion near the K point lazzeri08 . These effects are especially relevant for understanding the dispersion of electrons and phonons bostwick07 ; gruneisprl08 ; gruneis09 and transport properties in this novel material castronetoreview .
In a previous resonance Raman study of bilayer graphene performed in the visible range lmalard07 , the electronic structure of bilayer graphene was probed by analyzing the dispersion of G′ Raman band (also called 2D band) as a function of the laser energy, and described within a tight-binding approximation wallace47 ; McClure1957 ; SW1958 by determining the nearest-neighbors hopping parameters , , and . It was shown in this work that a linear iTO phonon dispersion provided a good fit of the experimental data obtained with visible photons lmalard07 .
In the present work, we have extended the range of laser energies, measuring the G′ Raman band with many laser lines in the range 1.33 to 2.81 eV. The measurements in the near-IR range (1.33 to 1.69 eV) are especially relevant since we can probe phonons that are much closer to the K point. The analysis of the low energy data allowed us to observe a non-linear softening of the phonon branch near the K point, and the significant splitting of the symmetric (S) and anti-symmetric (AS) phonon branches. In particular, we show that the phonon softening is stronger for the S branch. Concerning the electronic structure, we have also considered the in-plane second-neighbor hopping parameter, which is expected to be of the same order as the out-of-plane nearest-neighbor parameters, to describe the G′ Raman band dispersion.
The graphene samples used in this experiment were obtained by a micro-mechanical exfoliation of graphite (Nacional de Grafite, Brazil) on the surface of a Si sample with a 300 nm SiO2 coverage. The laser power was kept at 1 mW in order to avoid sample heating. We used He-Cd, Ar-Kr and dye lasers for the laser lines in the visible range (1.91–2.81 eV) and a Ti:Saphire laser for the excitation in the near-IR range (1.33–1.69 eV).
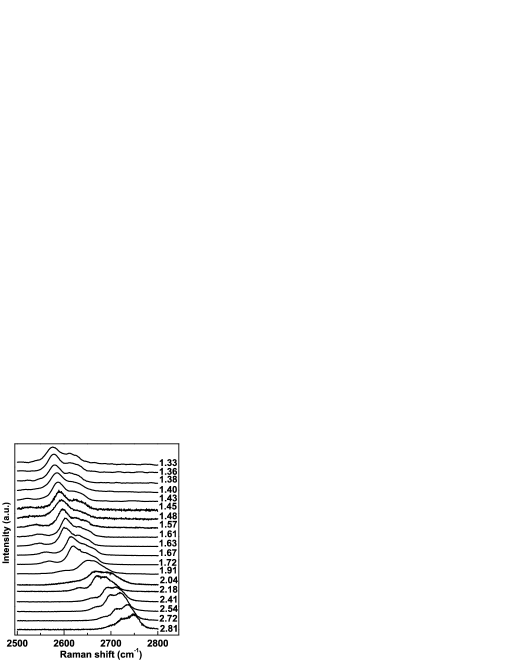
Figure 1 shows the G′ band of bilayer graphene recorded with 19 different laser lines between 1.33 and 2.81 eV (932 to 440 nm). We can see that both the position and the shape of the G′ band are strongly dependent on the energy of the exciting laser. The G′ band in graphene systems comes from an intervalley double resonance (DR) Raman process thomsen00 ; saito02 that involves one initial electronic state with wavevector near the K point, one intermediate electronic state with wavevector near the K′ point, and two in-plane transverse optical (iTO) phonons with wavevectors malardreports09 . Since photons with different energies excite electrons and phonons with different wavevectors and , respectively, the dispersion of electrons and phonons near the K point can be measured in when the energy of the incident photons can be tuned malardreports09 .
In the case of AB-stacked bilayer graphene, the electronic branches split into two valence bands ( and ) and two conduction bands ( and ) castronetoreview . The iTO phonon branch also splits into two branches, related to the symmetric (S) and anti-symmetric (AS) phonons. It has been shown that the DR scattering process occurs preferentially in the high symmetric KM direction maultzsch04b ; bob07 , involving electrons in the K direction and phonons in the KM direction.
Group theory analysis for bilayer graphene malardPRB09 predicts four distinct DR processes (P11, P22, P12 and P21) along the KM direction, which are illustrated in Figs. 2(a) and (b). Since the lower and upper conduction bands ( and ) belong to different irreducible representations, the S phonons (T1 symmetry) are associated with the P11 and P22 processes [see Fig. 2(a)] involving electrons with same symmetry ( or ) whereas the AS phonons (T2 symmetry) occur for processes P12 and P21 [Fig. 2(b)] involving electrons with different symmetries ( or ) lmalard07 .
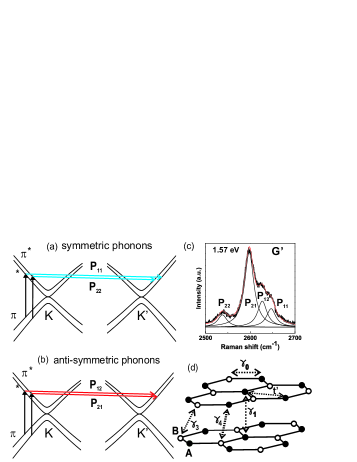
Each of these processes (P11, P22, P12 and P21) is responsible for one peak in the G′ band of AB-stacked bilayer graphene. Fig. 2(c) shows the Raman spectrum of the G′ band measured with 1.57 eV laser energy and fitted with four peaks. All have the same FWHM of 24 cm-1, which is the FWHM of the single band in monolayer graphene ferrari06 ; malardreports09 . We see in Fig.2(a) that the P11 process involves the phonon with higher wavevector, while the phonon with smaller wavevector gives rise to the P22 process. Therefore, the P22 process is especially relevant since it involves phonons closer to the K point, even when compared to the phonon in monolayer graphene probed by the same laser line. Since the iTO phonon frequency increases with increasing , we conclude that the lowest and highest frequency peaks of the G′ band are associated with the P11 and P22 processes, respectively. The two intermediate Raman peaks are due to the P12 and P21 processes, as shown in Fig.2(c).
All G′ bands shown in Fig.1 were fitted by four Lorentzian curves, and laser energy dependence of the Lorentzian peak positions are plotted in Fig.3(a-d). In order to analyze the experimental dispersion of the G′ peaks shown in Fig.3(a-d), we need to consider the dispersion of both electrons and phonons near the K point. The electronic dispersion will be analyzed here using the tight-binding approximation, which was first introduced by Wallace wallace47 , using the Slonczewski-Weiss-McClure (SWM) McClure1957 ; SW1958 model for graphite, and the phonon dispersion is obtained from the fit of the experimental data.
In the previous resonance Raman study in bilayer graphene performed in the visible range lmalard07 , a linear phonon dispersion was considered to fit the G′ peak positions versus Elaser data. Fig. 3(a) shows that the fitting of the data of the present study considering the linear phonon dispersion and the SWM parameters used in reference lmalard07 fails for the experimental points in the near-IR region and, in particular, for the data associated with the P22 process involving phonons closer to the K point.
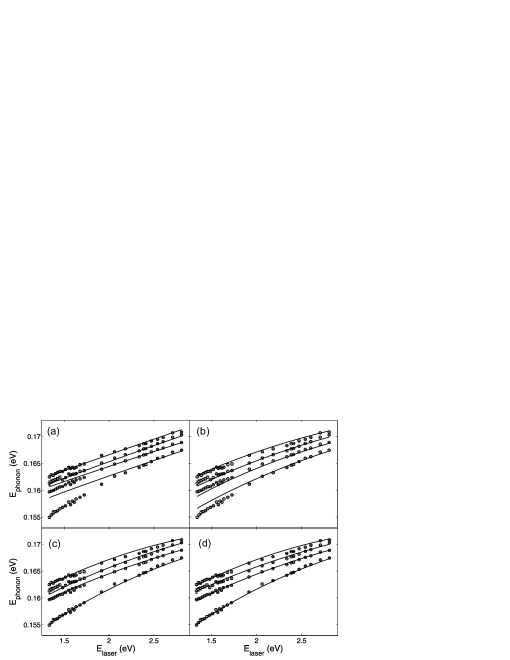
In order to fit the low energy experimental data in Fig. 3, we have considered a non-linear relation for the iTO phonon dispersion, given by a second-order polynomial . Fig.3(b) shows the fit considering the same non-linear phonon dispersion for the S and AS phonon branches, and the , , , parameters. Fig.3(c) shows the fit using the same SWM parameters as in Fig.3(b) but considering two distinct non-linear phonon dispersions for the S and AS branches. As we can see in Fig.3(b) and (c), the fitting in the low energy range is improved considering the non-linear dispersion, but different dispersions for the S and AS branches are needed to obtain a good fit of the experimental data. All fitting parameters are shown in Table 1.
In the fittings shown in Figs. 3(a)-(c), we have considered only the first-neighbor parameters , , , . In principle, we could also introduce higher-order terms and, in particular, the in-plane second-neighbor parameter , which is expected to be of the same order of magnitude as the out-of-plane first-neighbor parameters. Figure 3(d) shows the fit of the experimental data considering also and , which represents the difference in energy of the sublattices A and B. As we observe in Figure 3(d), the resultant fit is slightly improved, mainly due to the use of larger number of fitting parameters.
It is important to emphasize that slightly different values of the parameters are found when we include and . A good fit can always be obtained for values ranging between 2.9 and 3.1 eV. Concerning the parameter, reasonable fits could only be obtained for 0.35 eV, in disagreement with values of up to 0.4 eV proposed in the literature IR1 ; IR2 ; IR3 . Considering the parameter, the best fit is obtained when eV, and a reasonable fit cannot be obtained for values of eV. Once again, this value is smaller than others found in the graphite literature ( 0.30 eV dresselhaus88 ; gruneis2008 ; schneider09 ). Recent infrared studies in exfoliated bilayer graphene consider 0.30 eV partoens06 ; min07 , but this value is not extracted directly from the experiments IR1 ; IR3 . Notice that is related to the trigonal warping effect (TWE) at very low energies and gives rise to electron-hole pockets mccann2006a in the energy scale of 2 meV, which is not accessible in Raman experiments. However as the energy increases, there is also a TWE due to the symmetry of the lattice, which is probed by our experiment. These two effects can explain the different values found with distinct experimental techniques.
If we consider only nearest neighbor parameters to describe the electronic structure, the best fit is obtained for 0.15 eV, which is in close agreement with our previous experiment lmalard07 and with Refs. IR1 ; IR2 . However, smaller values of provide a good fit when the second-neighbor parameter is included. In fact, both and parameters are associated with the asymmetry between electrons and holes in bilayer graphene. Finally, reasonable fits can be obtained for different small positive and negative values of (eV).
| symmetric | anti-symmetric | |||||||||||
|---|---|---|---|---|---|---|---|---|---|---|---|---|
| A(meV) | B(meV) | C(meV) | A(meV) | B(meV) | C(meV) | |||||||
| (a) | 2.9 | 0.3 | 0.1 | 0.12 | - | - | 153.7 | 38.5 | - | 154.0 | 38.8 | - |
| (b) | 3.0 | 0.35 | 0.1 | 0.15 | - | - | 149.3 | 69.5 | -46.6 | 149.3 | 69.5 | -46.6 |
| (c) | 3.0 | 0.35 | 0.1 | 0.15 | - | - | 146.3 | 86.9 | -70.3 | 150.5 | 66.3 | -44.8 |
| (d) | 3.0 | 0.35 | 0.1 | 0.10 | 0.01 | 0.15 | 146.3 | 86.9 | -70.3 | 150.5 | 66.3 | -44.8 |
The analysis of the experimental data also gives us the phonon dispersion for the symmetric (S) and anti-symmetric (AS) iTO phonon branches near the K point. As shown in Figs. 3(c) and (d), two distinct phonon branches, associated with symmetric and anti-symmetric iTO phonons, are necessary to fit the experimental data. The values of the polynomial parameters , and for the S and AS branches are shown in Table 1. We observe that the quadratic coefficients assume negative values, showing that the slope of the phonon dispersion increases with decreasing values. This is direct evidence of the Kohn anomaly for the iTO phonon branches, which are expected to exhibit a kink at the K point.
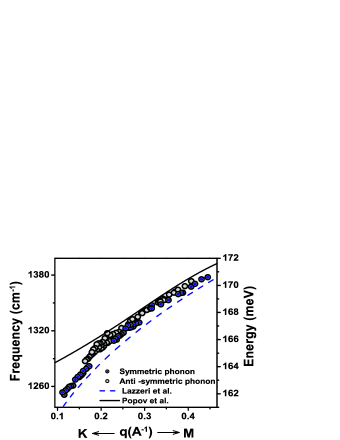
The experimental data shown in Fig. 3 can be directly plotted in a phonon energy dispersion relation ( versus ) by eliminating the laser energy () in the double resonance conditions lmalard07 . Fig. 4 shows the phonon dispersion of the S (full circles) and AS (open circles) branches obtained from the resonance Raman results, considering the same TB parameters as in Fig.3(c). Fig. 4 also shows the theoretical phonon dispersion near the Dirac point of the iTO phonon branch of monolayer graphene calculated using the tight-binding approximation by Popov et al. popov (solid curve) and using DFT by Lazzeri et al. lazzeri08 (dashed curve) within the approximation, where electron-electron interaction is taken into account. Notice that the phonon dispersion calculated by tight-binding fails to describe the data for lower phonon energies, which are in good agreement with the calculations within the approximation. This result shows the importance of considering electron-phonon and electron-electron interactions in order to correctly describe the phonon dispersion near the K point of graphene systems.
Another interesting observation is the fact that the phonon softening is stronger for the S phonon branch as shown in Fig. 4. This result is in agreement with the calculation performed by Ando et al. andoBi , which predicts a stronger phonon renormalization for the zone-center symmetric phonon, due to distinct selection rules for interaction of S and AS phonons with intra-valley and inter-valley electron-hole pairs. The same type of selection rule is expected to occur for phonons near the K point.
In summary, the dispersion of electrons and phonons of bilayer graphene was investigated by performing a resonance Raman study of the the G′ Raman band, using laser energies from the visible to the near-IR range. The measurements in the near-IR range are especially relevant since we can probe phonons that are much closer to the K point. The electronic structure was analyzed within the tight-binding approximation, considering first and second neighbor interactions. We have obtained accurate experimental data for the phonon dispersion of the iTO branches near the K point, and the phonon branch softening reveals the K point Kohn anomaly in bilayer graphene. We have shown that the phonon renormalization is stronger for the S phonon branch. Our results agree with the phonon dispersion calculation which takes into account electron-electron interaction in graphene systems, which plays an important role to correctly describe the Kohn anomaly near the K point.
This work was supported by Rede Nacional de Pesquisa em Nanotubos de Carbono - MCT, and the Brazilian Agencies CNPq and FAPEMIG. Resonance Raman studies in the near infrared range were conducted at the Center for Integrated Nanotechnologies, jointly operated by Los Alamos and Sandia National Laboratories
References
- (1) S. Piscanec et al., Phys. Rev. Lett. 93, 185503 (2004).
- (2) W. Kohn, Phys. Rev. Lett 2, 393 (1959).
- (3) S. Pisana et al., Nature Mater. 6, 198 (2007).
- (4) J. Yan et al., Phys. Rev. Lett. 98, 166802 (2007).
- (5) A. Das et al., Nature Nanotech. 3, 210 (2008).
- (6) A. Das et al., Phys. Rev. B 79, 155417 (2009).
- (7) J. Yan et al., Phys. Rev. Lett. 101, 136804 (2008).
- (8) L. M. Malard et al., Phys. Rev. Lett. 101, 257401 (2008).
- (9) A. H. Castro Neto et al., Rev. Mod. Phys. 81, 109 (2009).
- (10) L. M. Malard et al., Phys. Rep. 473, 51 (2009).
- (11) M. Lazzeri et al., Phys. Rev. B. 78, 081406(R) (2008).
- (12) A. Bostwick et al., Nat. Phys. 3, 36 (2007).
- (13) A. Grüneis et al., Phys. Rev. Lett. 100,
- (14) A. Grüneis et al., arXiv:0904.3205 (2009).
- (15) L. M. Malard et al., Phys. Rev. B 76, 201401 (2007).
- (16) J. W. McClure, Phys. Rev. 108, 612 (1957).
- (17) J. C. Slonczewski and P. R. Weiss, Phys. Rev. 109, 272 (1958).
- (18) P. R. Wallace, Phys. Rev. 71, 622 (1947).
- (19) C. Thomsen and S. Reich, Phys. Rev. Lett. 85, 5214 (2000).
- (20) R. Saito et al., Phys. Rev. Lett. 88, 027401 (2002).
- (21) J. Maultzsch et al., Phys. Rev. B 70, 155403 (2004).
- (22) D. L. Mafra et al., Phys. Rev. B 76, 233407 (2007).
- (23) L. M. Malard et al., Phys. Rev. B 79, 125426 (2009).
- (24) A. C. Ferrari et al., Phys. Rev. Lett. 97, 187401 (2006).
- (25) L. M. Zhang et al., Phys. Rev. B 78, 235408 (2008).
- (26) Z. Q. Li et al., Phys. Rev. Lett. 102, 037403 (2009).
- (27) A. B. Kuzmenko et al., Phys. Rev. B 79, 115441 (2009).
- (28) M.S. Dresselhaus, G. Dresselhaus, K. Sugihara, I. L. Spain and H. A. Goldberg, Carbon Fibers and Filaments, Chapter 7, Springer Verlag (Berlin Heidelberg) 1988.
- (29) A. Grüneis et al., Phys. Rev. B 78, 205425 (2008).
- (30) J. M. Schneider et al., Phys. Rev. Lett 102, 166403 (2009).
- (31) B. Partoens and F. M. Peeters, Phys. Rev. B 74, 075404 (2006).
- (32) H. Min et al., Phys. Rev. B 75, 155115 (2007).
- (33) E. McCann and V. I. Fal`ko, Phys. Rev. Lett. 96, 086805 (2006).
- (34) V. N. Popov and P. Lambin, Phys. Rev. B 73, 085407 (2006).
- (35) T. Ando, J. Phys. Soc. Jpn. 76, 104711 (2007).