Active Galactic Nuclei and the Truncation of Star Formation in K+A Galaxies
Abstract
We have searched for active galactic nuclei (AGNs) in K+A galaxies, using multiwavelength imaging and spectroscopy in the Boötes field of the NOAO Deep Wide-Field Survey. The K+A galaxies, which have had their star formation rapidly truncated, are selected via their strong Balmer absorption lines and weak emission. Our sample consists of 24 K+A galaxies selected from 6594 galaxies brighter than with optical spectroscopy from the AGN and Galaxy Evolution Survey. Two thirds of the K+A galaxies are likely ongoing galaxy mergers, with nearby companion galaxies or tidal tails. Galaxy mergers may be responsible for the truncation of star formation, or we are observing the aftermath of merger triggered starbursts. As expected, the optical colors of K+A galaxies largely fall between blue galaxies with ongoing star formation and red passive galaxies. However, only 1% of the galaxies with colors between the red and blue populations are K+A galaxies, and we conclude that the truncation of star formation in K+A galaxies must have been unusually abrupt (). We examined the AGN content of K+A galaxies with both optical emission-line ratios (BPT diagrams) and Chandra X-ray imaging. At least half of all K+A galaxies display the optical emission-line ratios of AGNs, and a third of K+A galaxies host AGNs with X-ray luminosities of . The faintest K+A galaxies do not show clear evidence for hosting AGNs, having emission-line ratios consistent with photoionization by massive stars and few X-ray detections. We speculate that two mechanisms may be responsible for the truncation of star formation in K+A galaxies, with AGN feedback only playing a role in galaxies.
1 INTRODUCTION
The stellar mass contained within the red galaxy population has doubled over the past 7 Gyr (e.g., Bell et al. 2004; Brown et al. 2007; Faber et al. 2007). Almost all red galaxies have low specific star formation rates (e.g., Fukugita et al. 2004; Helmboldt, Walterbos, & Goto 2008), so this rapid stellar mass growth cannot result from in-situ star formation alone. Mergers of red galaxies can redistribute, but not significantly increase, the stellar mass within the red galaxy population. For the stellar mass to rapidly increase within the red galaxy population, stellar mass must be transferred from the blue galaxy population to the red galaxy population (Bell et al. 2004). For this to happen, star formation must be truncated within blue galaxies.
Galaxies that have had their star formation abruptly truncated within the past several hundred million years can be identified spectroscopically (e.g., Dressler & Gunn 1983; Boroson & Oke 1984; Couch & Sharples 1987; Zabludoff et al. 1996). These galaxies, which lack massive OB stars but retain longer lived A stars, have weak nebular emission-lines (relative to star forming galaxies) and a prominent Balmer absorption series. These galaxies are commonly known as post-starbursts (e.g Couch & Sharples 1987), E+A galaxies (e.g Dressler & Gunn 1983), or K+A galaxies (e.g Franx 1993), as their stellar continuum can be approximated by combining K and A star spectra.
There are several plausible mechanisms for the rapid truncation of star formation in galaxies, including strangulation (Larson, Tinsley, & Caldwell 1980; Balogh & Morris 2000), supernova feedback (e.g., Efstathiou 2000), virial shock heating (Dekel & Birnboim 2006) and feedback from active galactic nuclei (AGNs; e.g., Silk & Rees 1998; Wyithe & Loeb 2003; Bower et al. 2006; Croton et al. 2006; Hopkins et al. 2006a). Models incorporating AGN feedback have achieved prominence within the past decade, as they can reproduce the observed properties of low redshift galaxies (e.g., Bower et al. 2006; Croton et al. 2006; Hopkins et al. 2006b) and there is strong observational evidence for AGN feedback in nearby galaxy clusters (e.g., Fabian et al. 2003a, 2003b). However, galaxy models with AGN feedback can have more free parameters than competing models and while AGN activity is relatively easy to detect, proving that it is (solely) responsible for truncating star formation is non-trivial.
AGN host galaxies have been studied for decades, and while the primary goal of these studies is understanding what triggers AGN activity, such studies can also explore the connections between AGN activity and star formation. Examples of quasars with K+A host galaxies are well known (Boroson & Oke 1984; Brotherton et al. 1999, 2004), although there are also powerful AGNs hosted by starbursts (e.g., Gallagher et al. 2002) and AGNs hosted by galaxies with old stellar populations (e.g., Nolan et al. 2001). While the presence of powerful AGNs in star forming galaxies could be evidence for AGN feedback playing a negligible role in galaxy evolution, there are scenarios where AGN feedback only plays a significant role after millions of years of AGN activity (e.g., Hopkins et al. 2006a).
Recently there have been a number of studies of the AGN content of K+A galaxies, with the principal goal of determining if AGNs could plausibly truncate star formation. These studies suggest a correlation between AGN activity and the rapid truncation of star formation, although a causal link has yet to be established. K+A galaxies selected from the Sloan Digital Sky Survey (SDSS; York et al. 2000) typically have emission-line ratios comparable to LINERs (Low Ionization Nuclear Emission-line Regions; Heckman 1980) and Seyferts, consistent with AGN activity in these galaxies (Yan et al. 2006). A quarter of K+A galaxies have blue cores, and these cores have spectra similar to LINERs (Yang et al. 2006). Tremonti, Moustakas, & Diamond-Stanic (2007) observed Mg II absorption lines with blueshifts of in 10 of 14 post-starburst galaxies, and hypothesized that these outflows were launched by AGNs that also truncated star formation within these galaxies. Stacking of Chandra images of post-starburst galaxies reveals a population X-ray sources with a mean luminosity of (Georgakakis et al. 2008). These studies suggest a link between AGN activity and K+A galaxies.
In this paper, we examine the AGN content of K+A galaxies using the optical emission-line diagnostic diagrams of Baldwin, Phillips, & Terlevich (1981, BPT diagrams) and X-ray imaging with the Chandra X-ray Observatory. Our principal goal is to measure the fraction of K+A galaxies that host AGNs, and thus determine if AGN feedback is a plausible mechanism for rapidly truncating star formation. We caution that even if all of the K+A galaxies in our sample host an AGN, this finding would be consistent with, but not direct evidence for, a causal link between AGN activity and the truncation of star formation. We also note that if none of the K+A galaxies in our sample host an AGN, one could develop models where the AGN activity is so brief that it would be rarely observed, although one may consider such models contrived. Despite these limitations and caveats, the plausibility of AGN feedback models does depend on the observed fraction of K+A galaxies that currently host AGNs.
The structure of this paper is as follows. In §2 we describe the selection of our K+A galaxy sample from the AGN and Galaxy Evolution Survey of Boötes. We discuss the NOAO Deep Wide-Field Survey optical imaging, photometry and rest-frame properties of the K+A galaxies in §3. The AGN content of K+A galaxies, inferred from optical emission line ratios and Chandra X-ray imaging is discussed in §4 and §5 respectively. We summarize our principal conclusions in §6. Throughout this paper we use Vega-based magnitudes and adopt a flat cosmology with and , which is consistent with the cosmological parameters of Spergel et al. (2007).
2 K+A GALAXY SAMPLE SELECTION
We selected our sample of K+A galaxies from the AGN and Galaxy Evolution Survey (AGES; C. S. Kochanek et al. in prep.), a spectroscopic survey of of the Boötes field of the NOAO Deep Wide-Field Survey (NDWFS; Jannuzi & Dey 1999). AGES targeted all optically extended sources brighter than and of extended sources with magnitudes of . AGES also targeted other galaxies, using a variety of selection criteria (e.g., infrared colors), but we only include these objects in our sample if they were also part of the main -band selected galaxy sample.
The spectra were obtained with Hectospec, a 300-fiber robotic spectrograph with a field-of-view on the 6.5-m MMT telescope (Fabricant et al. 1998; Roll, Fabricant, & McLeod 1998). The wavelength range of the spectra is to , and the instrumental resolution is 6 Å. Spectra were extracted and classified using two independent reduction pipelines and then verified by visual inspection. One pipeline is based upon the SDSS spectroscopic data reduction software while the other is a set of customized IRAF scripts. The spectra were flux calibrated by assigning several Hectospec fibers to F stars (identified from the SDSS; York et al. 2000), and then comparing their observed spectra with Kurucz (1992) stellar atmosphere models. To reliably select K+A galaxies using accurate measurements of galaxy emission and absorption lines, we require a median continuum signal-to-noise of 4 per pixel. We excluded spectra if they were badly contaminated by a red light leak from an LED in the fiber positioner or suffered from poor flux calibration due to problems with the operation of the atmospheric dispersion corrector (even when reliable redshifts were possible).
To select K+A galaxies, we use the equivalent width of the emission-line and the Worthey & Ottaviani (1997) indices for the and absorption lines. Our approach is similar to that used in much of the literature. K+A galaxies are identified by searching for spectra with strong Balmer absorption and weak nebular emission (e.g., , , ) relative to star forming galaxies (e.g., Zabludoff et al. 1996; Quintero et al. 2004; Yan et al. 2008). While the selection criteria used in the literature are based on the same underlying principle, they vary in detail and select different samples of objects, and we return to this point later. The strength of the emission-line is a very strong function of the number UV photons produced by massive OB stars. If star formation is completely truncated in a galaxy after a period of star formation, the emission-line will disappear from the integrated galaxy spectrum within . The and absorption lines are particularly strong in A star spectra, so these absorption lines remain prominent in galaxy spectra for after the truncation of star formation.
Our principal selection criteria for K+A galaxies are
| (1) | |||||
where and are the spectral indices of Worthey & Ottaviani (1997) and is the equivalent width of the emission-line (in units of ). Using the stellar population synthesis models of Bruzual & Charlot (2003) with Solar metallicity, we find that a galaxy that has had its star formation completely truncated after of continuous star formation will meet our selection criteria for .
We caution that emission can also be produced by AGNs as well as star formation, and some K+A galaxies that host AGNs will be absent from our sample. For example, IRAS 14344+3451 (J2000 R.A.=14:36:31.99 Decl.=+34:38:29.5) is a obscured quasar, hosted by a post-starburst galaxy undergoing a merger, that is excluded from our sample as it has strong emission. While one could attempt to add such objects to the sample by hand, this greatly complicates the selection function so we have stuck with a simple selection criterion that can be easily modeled. Our estimates of the fraction of K+A galaxies that host an AGN are thus lower limits.
In addition to our principal selection criteria, we employ a number of other criteria and techniques to reduce contamination and improve the sample definition. We limit our redshift range to , so we have wavelength coverage of both the Balmer series and the emission-lines used in BPT diagrams. The lower redshift limit also reduces (but does not eliminate) aperture bias, where a small and unrepresentative fraction of the galaxy flux enters the Hectospec fiber. Measurements of and can be corrupted by residuals from the 5577 Å sky line, so we measure the strength of the Balmer absorption using only one of these indices when 5577 Å (potentially) contaminates the other index. Measurement errors broaden the observed locus of star forming galaxies, so for spectra with a signal-to-noise per pixel between 4 and 8, we adopt the conservative selection criteria
| (2) | |||||
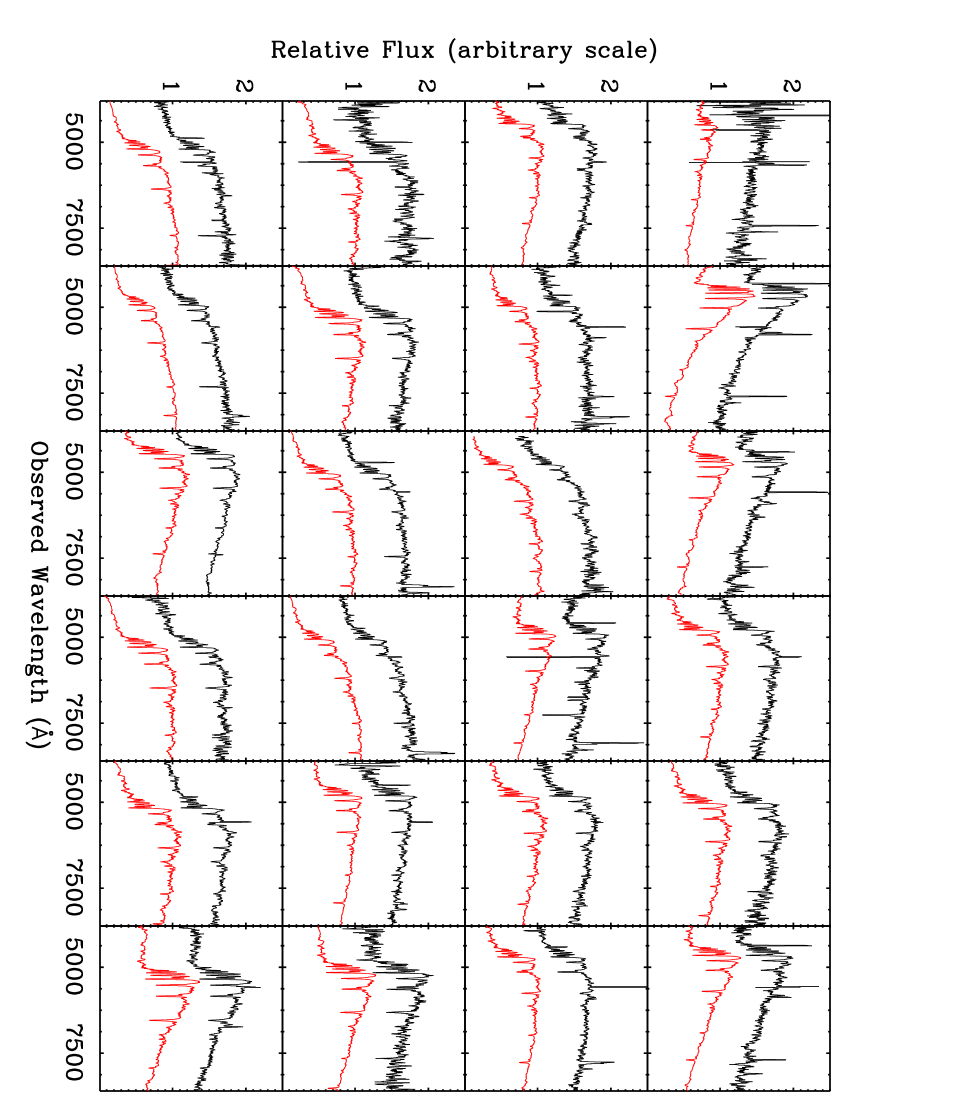
Contamination can be significant when selecting a very small subset of objects from a large population, so we visually inspected all of our K+A candidates and manually excluded 17 contaminants. Manually rejected objects included spectra with night sky line residuals and spectra where a red light leak had not been automatically flagged. Our selection criteria, K+A galaxies and other galaxies are plotted in Figure 1. Of the 6954 -band selected galaxies with , and good AGES spectra, 24 were selected as K+A galaxies. The low percentage (0.3%) of K+A galaxies in AGES is comparable to what has been observed in previous studies (e.g., Zabludoff et al. 1996; Quintero et al. 2004), even though the selection criteria differ. The coordinates and redshifts of the K+A galaxies are provided in Table 1 and we plot their spectra in Figure 2.
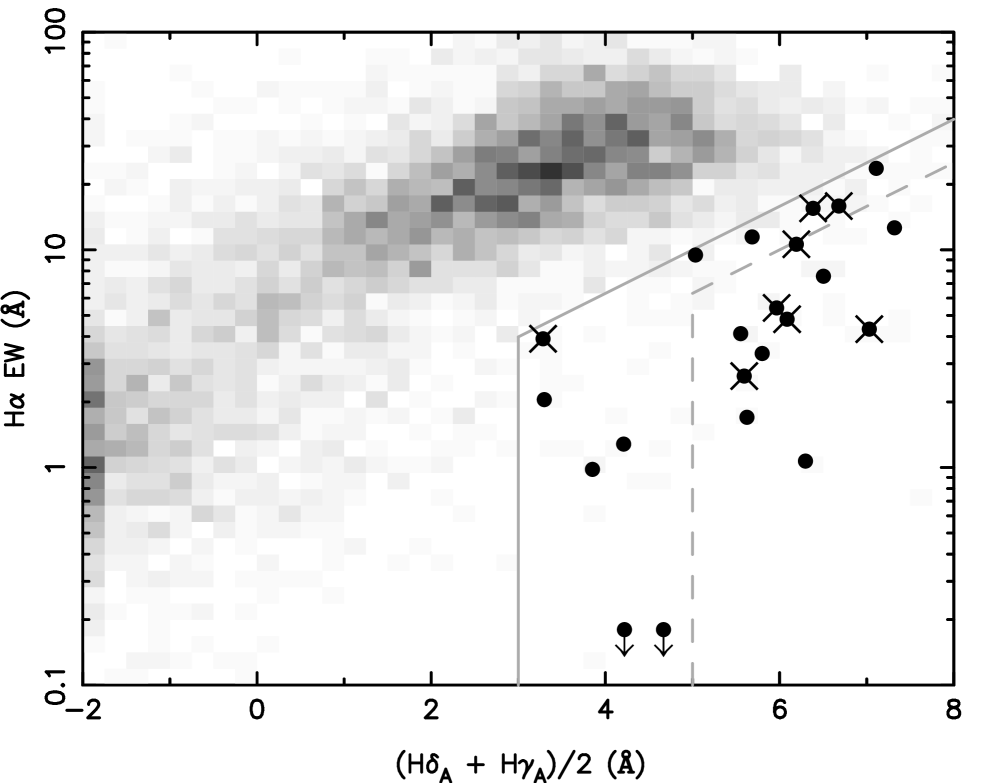
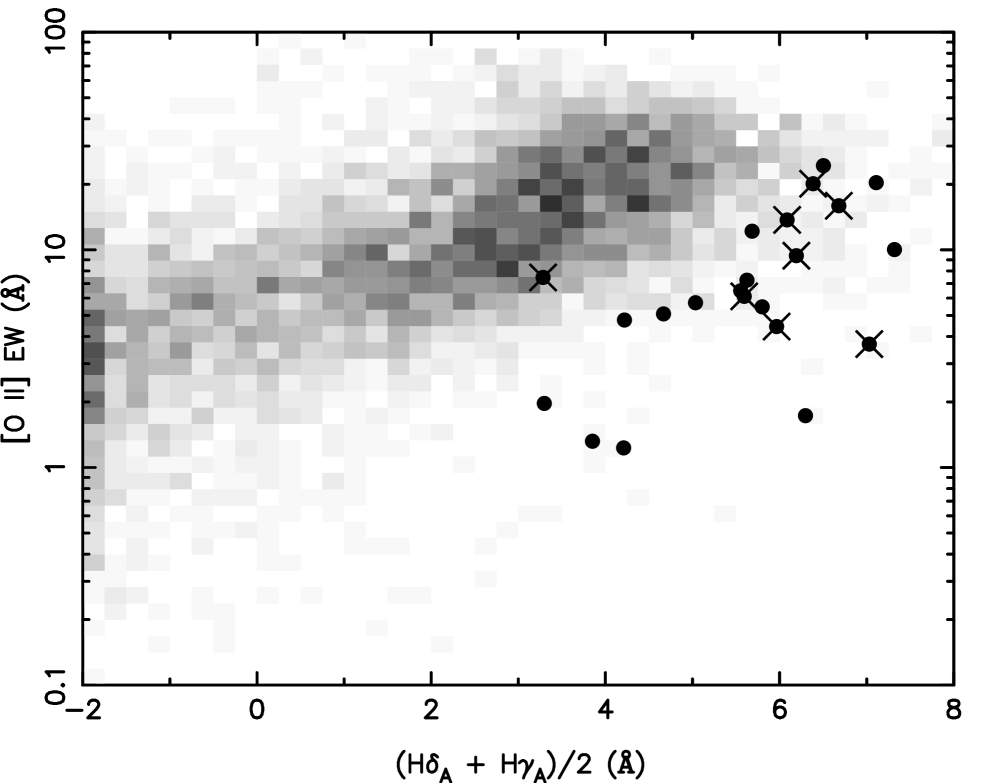
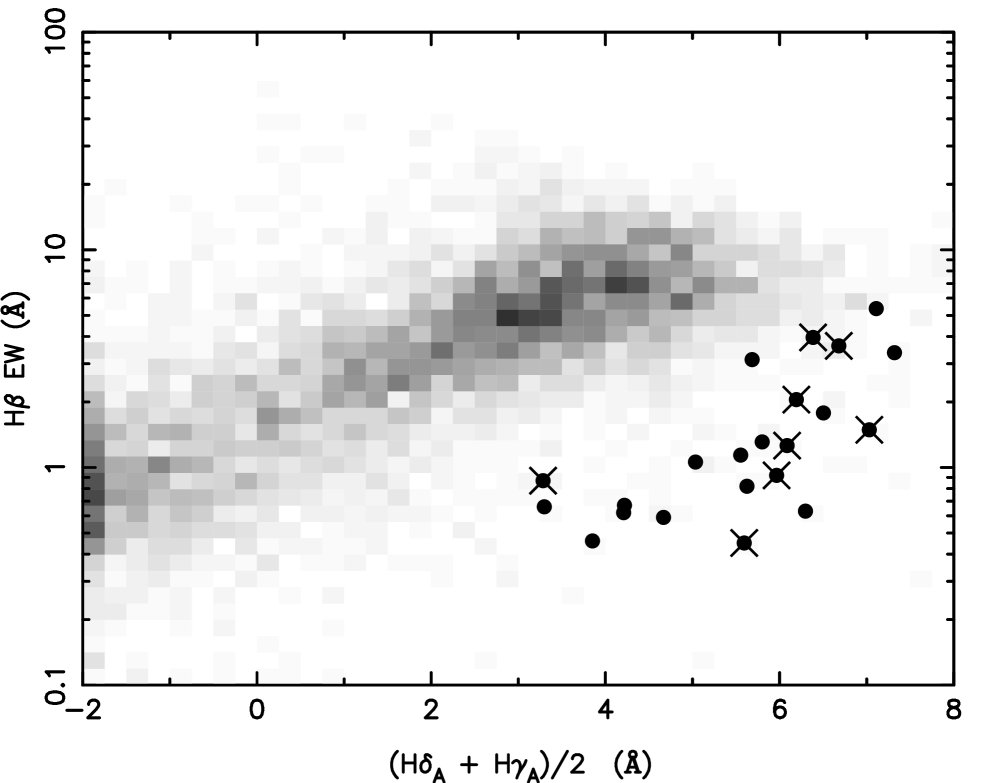
A variety of K+A and post-starburst selection criteria are used in the literature. Consequently, there is a genuine concern that conclusions derived from one sample will not be applicable to other samples. To address (but not resolve) this concern, in Figure 3 we plot the equivalent width of the and emission-lines as a function of the and spectral indices. Our K+A galaxy sample has weak relative to the star-forming locus, and at least of our objects would satisfy the selection criterion of Quintero et al. (2004). Although our K+A galaxies have weaker than galaxies in the star-forming locus, the difference is relatively small and of our K+A galaxies would be excluded from samples using the 2.5 Å and 5 Å emission-line equivalent width criteria of Zabludoff et al. (1996) and Tran et al. (2004) respectively. As noted by Yan et al. (2006), can result from AGN emission, and almost all of our K+A galaxies with X-ray counterparts (§5) would be excluded from samples using an selection criterion. Historically, was used not because it was preferred for physical reasons, but because detectors were more sensitive at those wavelengths. While our use of makes some comparisons with previous work more difficult, it is a good choice if one is more concerned about detecting recent star formation.
3 OPTICAL IMAGING AND PHOTOMETRY
To determine if galaxy mergers are associated with K+A galaxies, we searched for evidence of ongoing mergers using NDWFS optical imaging. As mergers are transitory, some galaxies that have undergone a merger within the past may seem undisturbed in the NDWFS imaging. As merger of two galaxies (initially separated by ) can take up to a billion years (e.g., Taylor & Babul 2001; Boylan-Kolchin, Ma, & Quataert 2008), merging K+A galaxies may be end products of merger triggered starbursts. While such caveats should be kept in mind, if a higher fraction of K+A galaxies are undergoing mergers than the overall galaxy population, this would be evidence for a link (albeit indirect) between K+A galaxies and galaxy mergers.
To determine if galaxy mergers play a role in the truncation of star formation, we searched the NDWFS optical imaging for companion galaxies within a projected distance of from each K+A galaxy. To reduce contamination of the companion sample, we used the photometric redshifts of Brown et al. (2008) to exclude companions whose photometric redshifts differed from the K+A galaxy spectroscopic redshifts by more than . We also excluded companion galaxies fainter than 10% of the K+A galaxy luminosity, as very faint galaxies can have large photometric redshift errors. An automated search of an object catalog will invariably miss some companion galaxies (e.g., due to blending) but is less likely to suffer from biases than visual searches. While only 17% of the overall AGES sample have companions within a projected distance of , we find that 8 (33%) of the 24 K+A galaxies have companion galaxies. The probability of randomly finding this enhanced number of companion galaxies is only 4%, so we conclude that K+A galaxies have more companions than the bulk of the galaxy population.
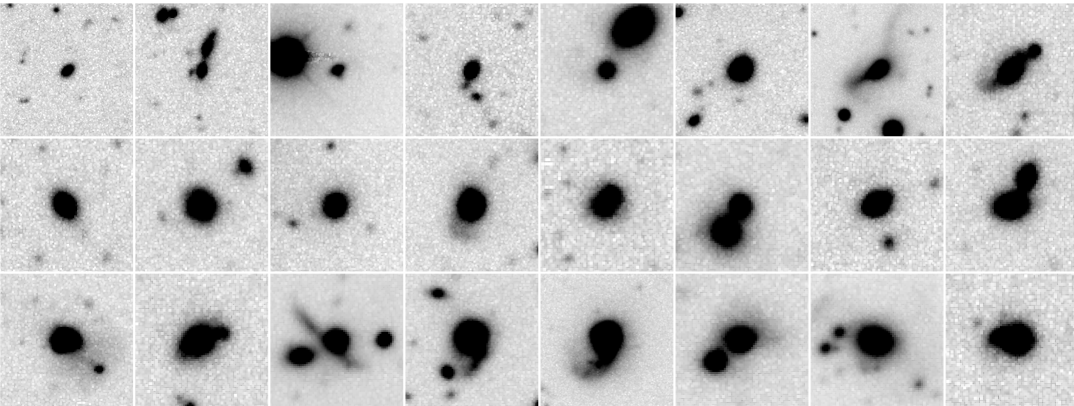
We also visually inspected NDWFS images of K+A galaxies for additional evidence of galaxy mergers, including tidal tails, and in Figure 4 we provide -band postage stamp images of the K+A galaxies. Ten (42%) of the K+A galaxies display tidal tails, including 7 that do not have companions within a projected distance of . The majority of K+A galaxies in our sample have nearby companion galaxies or tidal tails.
The high fraction of K+A galaxies undergoing mergers is broadly consistent with several previous studies, although these studies use a diverse range of galaxy selection criteria. Zabludoff et al. (1996) and Yang et al. (2008) find that a quarter and a half (respectively) of K+A galaxies show morphological evidence for ongoing mergers while Liu & Kennicutt (1995) found that a fifth of merging galaxies have K+A spectra. In contrast, Hogg et al. (2006) find that the environments of K+A galaxies do not differ from those of star-forming galaxies, although the SDSS sample used by Hogg et al. (2006) is too shallow to detect many of the companion galaxies we find using the deeper NDWFS imaging. While we find a higher fraction of merging K+A galaxies than prior studies, this is not unexpected as many K+A samples are small, the depth of their imaging varies, and the selection criteria for both K+A galaxies and mergers differ.
The fraction of merging K+A galaxies appears to increase with luminosity, with all but one of the eight K+A galaxies having a tidal tail or a cataloged companion galaxy. However, the evidence is intriguing rather than conclusive. If the fraction of K+A galaxies undergoing mergers is 62% and does not vary with luminosity, then the probability that 7 of the 8 most luminous K+A galaxies in a sample would be undergoing mergers is 12%. Furthermore, some of the faintest K+A galaxies in our sample are undergoing mergers. It thus remains plausible that the K+A galaxy merger rate does not vary with optical luminosity.
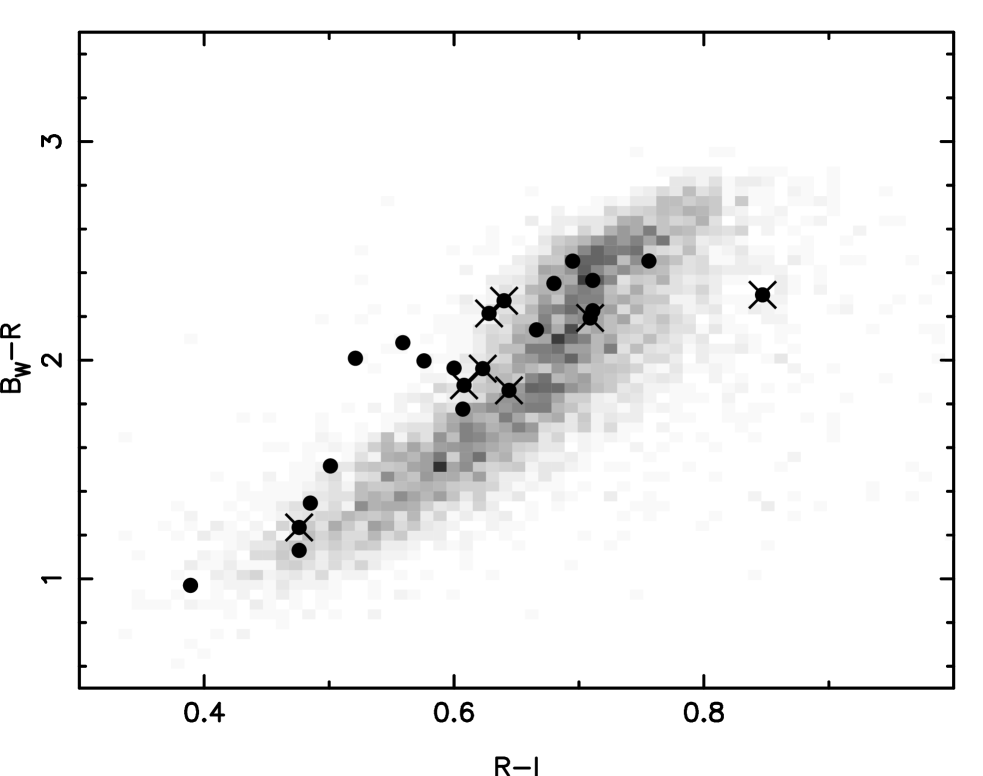
We determined the apparent optical colors of our galaxies using copies of the NDWFS optical images smoothed to a common point spread function with a FWHM of and aperture photometry (Brown et al. 2007). In Figure 5 we plot the apparent colors of our K+A galaxies and all AGES galaxies for comparison. We note that K+A galaxies have a broader spread of apparent colors than other AGES galaxies, which may be due to K+A galaxies having a prominent Balmer break rather than a strong 4000 Å break. Others have noted that the colors of post-starbursts can differ from those of normal galaxies, and the K+A galaxies of Tremonti et al. (2007) were initially targeted (as quasar candidates) by the Sloan Digital Sky Survey for this reason. One may be able to isolate a large (albeit incomplete) sample of K+A galaxy candidates on the basis of their apparent colors and extended morphologies, although spectroscopy will still be required to obtain a clean K+A sample.
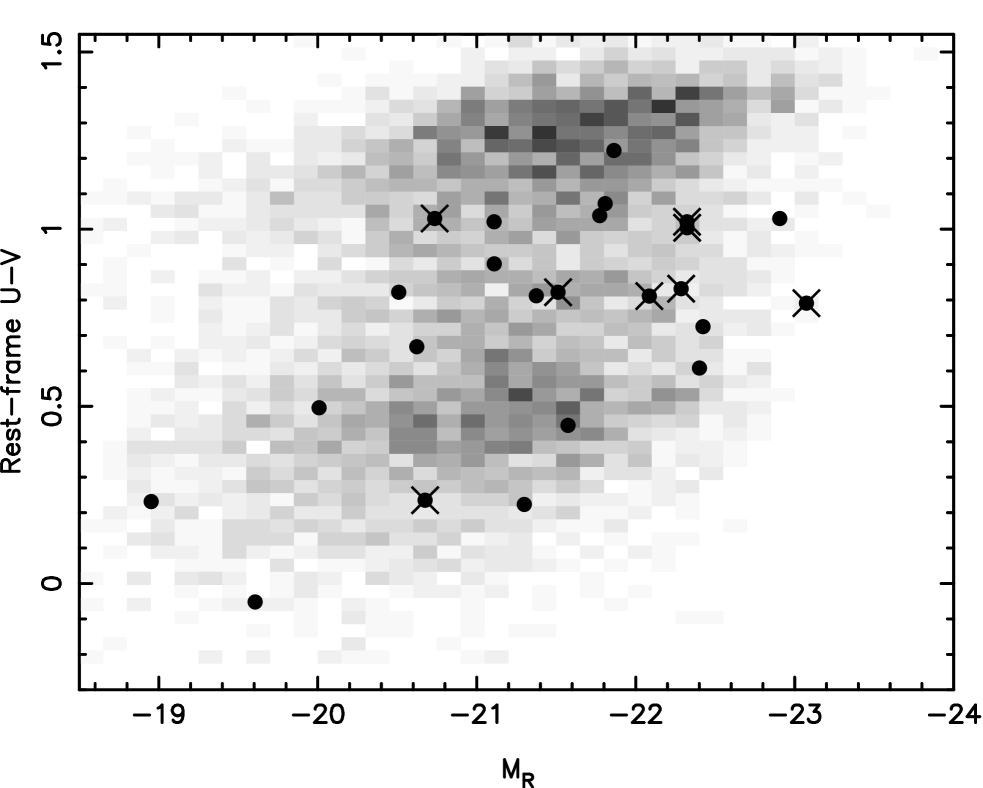
To determine the rest-frame photometry of our galaxies, we fitted Coleman, Wu, & Weedman (1980) template spectra to the optical photometry. To span the locus of galaxy colors, we interpolated between the Coleman et al. (1980) templates and extrapolated the templates to bluer and redder colors. We caution that the apparent colors of K+A galaxies do differ from those of most galaxies, so it is plausible that our rest-frame photometry for K+A galaxies has small systematic errors. For example, the Balmer break in K+A galaxies may have been incorrectly modeled with a 4000 Å break during the SED fitting. In Figure 6 we plot rest-frame as a function of -band absolute magnitude, which is strongly correlated with stellar mass. As seen in previous studies (e.g., Quintero et al. 2004; Yan et al. 2008), most K+A galaxies have colors which fall between the “blue cloud” of star forming galaxies and the color-magnitude relation of red passive galaxies. This is not unexpected, as we have selected galaxies with negligible rates of star formation with stellar populations that are younger than those of red passive galaxies.
The stellar mass contained within the red galaxy population doubles between and , due to steady transfer of stellar mass from the blue galaxy population to the red galaxy population (Bell et al. 2004; Brown et al. 2007; Faber et al. 2007). Consequently, many of the galaxies with intermediate colors must be in transition between the blue and red populations. We find that K+A galaxies represent just 1% of the 1984 AGES galaxies with high signal-to-noise spectra and restframe colors in the range . If all galaxies moving between the blue and red populations had their star formation abruptly truncated (), so they satisfied K+A selection criteria, and it takes for the colors of galaxies to evolve from blue to red (e.g., Bell et al. 2004), we should have identified hundreds of K+A galaxies. Since we have only selected 24 K+A galaxies, we conclude that most of the galaxies falling between the red and blue populations at have had their star formation decline gradually (so they do not meet K+A selection criteria). This interpretation is consistent with the recent work of Yan et al. (2008), who find that the slowly evolving environments of post-starbursts differ from those of most red galaxies. In contrast to our findings, Wild et al. (2009) find that K+A galaxies do play a significant role in transferring stellar mass from the blue population to the red population at , although this would require the space density of K+A galaxies to evolve by two orders of magnitude since . We conclude that while K+A galaxies are in transition from the blue galaxy population to the red galaxy population, this transition seems to be atypical and unusually rapid for low redshift galaxies.
4 OPTICAL EMISSION-LINE FLUX RATIOS
The relative strength of emission-lines in a spectrum will vary depending upon the spectral energy distribution of the photo-ionizing radiation. As a consequence, emission line ratios can be used to distinguish AGNs from other galaxies (e.g., Baldwin et al. 1981; Kewley et al. 2001; Kauffmann et al. 2003), although there are caveats. The classifications derived from emission-line ratios can vary with the size of the aperture used when obtaining the spectrum (aperture bias; e.g., Zaritsky, Zabludoff, & Willick 1995), with weak AGNs being swamped by starlight in large aperture spectra. For most of the galaxies in our sample, the Hectospec fiber is capturing 10% to 30% of the total galaxy light, so the variation in aperture bias from galaxy-to-galaxy within our sample is small. Emission-line ratios also depend on metallicity and the distributions of gas, dust and photoionizing sources. Despite these limitations, emission-line ratios remain a useful diagnostic of AGN content.
In this work we use the BPT diagram (Baldwin et al. 1981), which uses the emission-line flux ratios of divided by and divided by . Emission-line fluxes were determined by subtracting the stellar continuum and simultaneously fitting a Gaussian to each of the emission-line profiles (Moustakas & Kennicutt 2006, J. Moustakas, in prep.). This technique results in emission-line measurements reliably corrected for stellar absorption. The stellar continuum was modeled using a non-negative linear combination of high resolution Bruzual & Charlot (2003) stellar population synthesis models (which span a wide range of stellar population ages), with dust attenuation being modeled using the prescription outlined by Moustakas & Kennicutt (2006). With the AGES spectra, we are able to determine accurate emission-line fluxes when the line strength is greater than . We note that the strength of the and nebular emission-lines are sensitive to errors in the estimated strength of the Balmer absorption lines produced by the underlying stellar continuum model (§2). We also caution that an AGN can be missed if starlight and nebular emission dominates the light within the aperture of the Hectospec fiber.
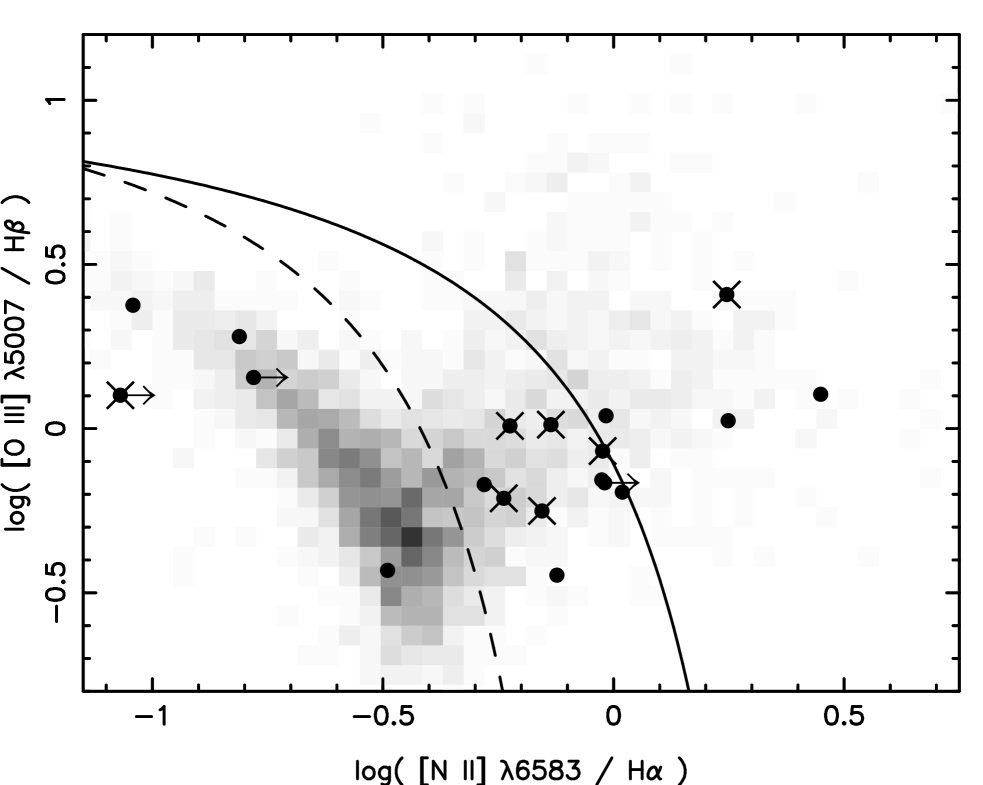
In Figure 7 we plot the BPT diagram of K+A galaxies and other AGES galaxies. For comparison, we plot the upper limit for the emission-line ratios produced by gas photoionized by massive stars from Kewley et al. (2001) and the empirical AGN criterion of Kauffmann et al. (2003). Clearly the K+A galaxy population differs significantly from the bulk of the galaxy population. Half of the K+A galaxies lie beyond the stellar population limit of Kewley et al. (2001), and the vast majority lie in the AGN portion of the BPT diagram defined with the Kauffmann et al. (2003) criterion. Our BPT diagram is broadly similar to that of Yan et al. (2006), except we have slightly fewer sources with strong emission relative to . While we are limited by small number statistics, it does appear that emission-line ratios may vary with optical luminosity. All three of the K+A galaxies in our sample have , which is consistent with the nebular emission-line ratios produced by a stellar population. While it is possible that the K+A galaxies are harboring weak AGNs that are swamped by starlight and associated nebular emission, or hosted powerful AGNs in the past, it is unlikely that these galaxies are currently hosting powerful AGNs. If the emission-line ratios measured by AGES are a reliable diagnostic of AGN activity, the fraction of K+A galaxies currently hosting an AGN increases with optical luminosity, with most K+A galaxies hosting an AGN.
5 CHANDRA X-RAY IMAGING
AGNs which are not evident at optical wavelengths may be detected with X-ray imaging (e.g., Barger et al. 2001). The Chandra X-ray Observatory has imaged the entire Boötes field, with the lion’s share of the imaging coming from the XBoötes wide-field and XBoötes deep surveys. We refer the reader to the XBoötes survey papers (Kenter et al. 2005; Murray et al. 2005; Brand et al. 2006; Murray & XBootes Team 2006) for a thorough discussion of the observing strategy and data processing. The exposure time per pointing is at least , with some regions of Boötes having exposure times as high as (Wang et al. 2004). None of the K+A galaxies are associated with known extended X-ray sources in the Boötes field (Kenter et al. 2005). Eight (33%) of the K+A galaxies have one or more X-ray photons within of the optical position, including five (17%) K+A galaxies with two or more X-ray photons. For comparison, 995 of the 6592 (15%) AGES galaxies have one or more X-ray photons within of the optical position, with 316 (5%) having two or more X-ray photons. K+A galaxies are thus more likely to harbor X-ray sources than the overall galaxy population.
We determined fraction of K+A galaxies with spurious X-ray counterparts by searching for X-ray photons within of positions offset by from the K+A galaxies. Approximately 8% of the offset positions had spurious X-ray counterparts (usually single photon detections) and we thus conclude that of the 24 K+A galaxies also have spurious X-ray counterparts. We note that the only X-ray source that does not lie in the AGN portion of the BPT diagram defined with the Kauffmann et al. (2003) criterion (see Figure 7) is a one photon source, and is thus likely to be spurious. This is also the only X-ray source that does not show evidence for an ongoing galaxy merger in the optical imaging.
To determine the nature of the X-ray sources, we estimated their X-ray fluxes and luminosities (or upper limits). To constrain the photon index, we determined the hardness ratio,
| (3) |
where and are the photon counts in the 0.5-2.0 keV and 2.0-7.0 keV bands respectively. Using the 19 photons from the 8 K+A galaxies, we measure a hardness ratio of , corresponding to a photon index of . We used PIMMS version 3.9 (Mukai 1993) to determine the conversion from (Chandra Cycle 4) photon counts to unabsorbed X-ray flux, using a source photon index of and a Galactic foreground HI column density of (Stark et al. 1992). X-ray luminosities were determined using
| (4) |
where is the luminosity distance and is the X-ray flux. Although our estimate of the photon index is highly uncertain, this has a modest impact on our luminosities as we are studying low redshift objects and our photon shot noise is large. The X-ray luminosities of our sources are plotted in Figure 8 and listed in Table 1.
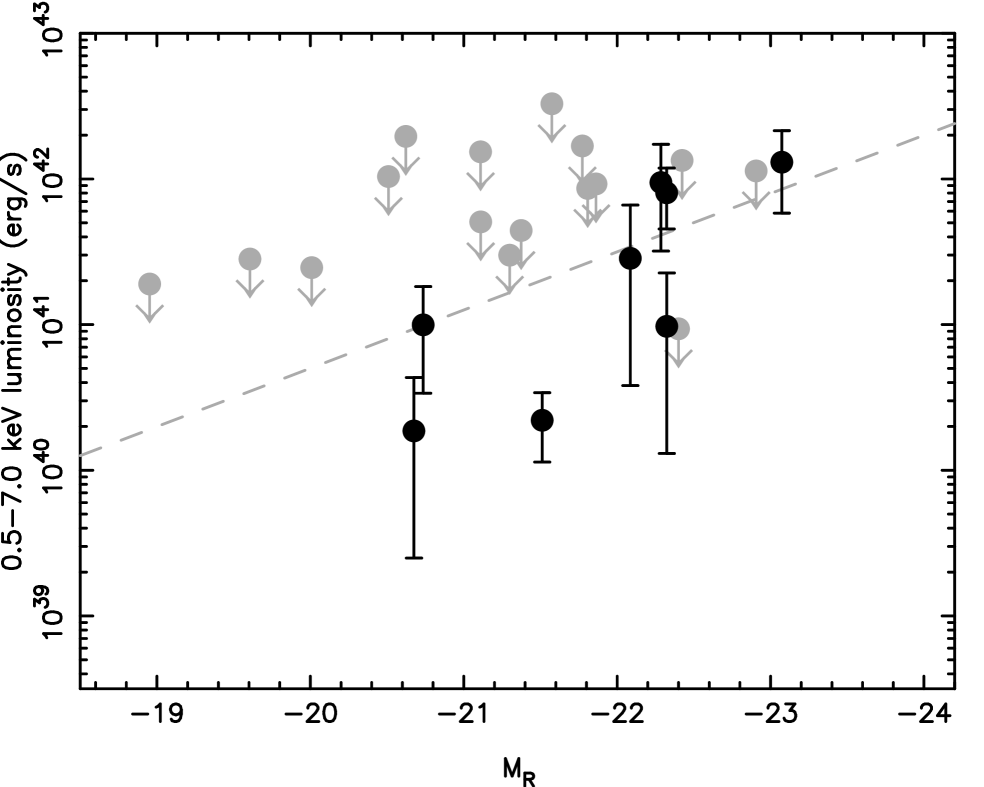
We find that the X-ray luminosities of K+A galaxies are, on average, higher than those of other galaxies. The mean X-ray luminosity of K+A galaxies (determined using galaxies with and without XBoötes detections) is while the mean X-ray luminosity of other AGES galaxies is . (We caution that individual galaxies can have luminosities far higher and lower than these mean values.) The mean X-ray luminosity of K+A galaxies brighter than is , while other AGES galaxies with comparable absolute magnitudes have a mean X-ray luminosity of . This is broadly consistent with the recent stacking analysis of Georgakakis et al. (2008), who find that the mean X-ray luminosity of post-starbursts is .
Many of the K+A galaxies with X-ray counterparts are almost certainly hosting AGNs. Several K+A galaxies have X-ray luminosities of , which is a factor of higher than local ultraluminous infrared galaxies that are predominantly powered by ongoing star formation (Ptak et al. 2003). Most of the K+A galaxies with X-ray counterparts would also be classified as AGNs using the BPT diagram and the empirical criterion of Kauffmann et al. (2003). As noted in §2, additional K+A galaxies hosting powerful AGNs are missing from our sample, due to our selection criterion (e.g., IRAS 14344+3451).
The X-ray luminosities of K+A galaxies are correlated with their optical luminosities. Five of the eight K+A galaxies brighter than have counterparts in the Chandra imaging, with three having X-ray luminosities on the order of . K+A galaxies that are fainter than have X-ray luminosities between and , or have upper limits consistent with this luminosity range. The X-ray luminosities of K+A galaxies could be proportional to their optical luminosities, although steeper relationships are also consistent with our observations.
The most luminous K+A galaxies are frequently undergoing mergers and show strong evidence for hosting AGNs, including powerful X-ray emission. Many of the faintest K+A galaxies do not show evidence for ongoing mergers nor AGN activity. Perhaps AGN activity is weak or brief in the faintest K+A galaxies, so it is difficult to observe. Alternatively, we can conclude that the fraction of K+A galaxies that have hosted powerful AGNs and undergone mergers does increase with optical luminosity. If this is the case, perhaps two mechanisms are responsible for the truncation of star formation, with one being correlated with galaxy mergers and AGN activity. Yan et al. (2008) also conclude that there may be two mechanisms for producing K+A galaxies, after noting a bimodality in the distribution of K+A environments. Multiple mechanisms for the truncation of star formation are also found in recent semi-analytic models (e.g., Bower et al. 2006; Croton et al. 2006), with AGN feedback only playing a major role in central galaxies while other mechanisms regulate star formation in satellite and low luminosity galaxies, although how accurately these models mimic galaxy evolution remains a matter of vigorous debate.
6 SUMMARY
We have examined the AGN content of K+A galaxies, using 24 K+A galaxies selected from AGES spectroscopy of of the Boötes field. Using deep optical imaging from the NDWFS, we find that two thirds of K+A galaxies are likely ongoing mergers or are recent merger remnants. As the merger of two galaxies (initially separated by ) can take as long as a billion years, it is plausible that the mechanism that truncates star formation is triggered by galaxy mergers or that we are observing the aftermath of merger triggered bursts of star formation.
Between and the stellar mass contained within the red galaxy population doubles, due to the transfer of stellar mass from the blue star forming galaxy population to the red passive galaxy population. As the star formation rates of galaxies decline and they move towards the red galaxy population, their rest-frame optical colors will fall between the red and blue populations. While the optical colors of K+A galaxies fall between the red and blue populations, they represent just 1% of the galaxies with these optical colors. We thus conclude that, compared to most galaxies moving from the blue population to the red population, the truncation of star formation in K+A galaxies may be unusually abrupt.
We find that K+A galaxies frequently host AGNs. Half of the K+A galaxies in our sample have emission-line ratios comparable to those of Seyferts and LINERs, while a quarter have counterparts in the Chandra XBoötes survey. While not direct evidence for AGN feedback, it is consistent with AGN feedback being responsible for the truncation or regulation of star formation in some galaxies.
The fraction of K+A galaxies that show clear evidence of hosting an AGN increases with optical luminosity. While most K+A galaxies have optical emission-line ratios consistent with AGNs, the faintest K+A galaxies have emission-line ratios consistent with those produced by a stellar population. A third of K+A galaxies have X-ray counterparts with luminosities of , while it is rare for optically faint K+A galaxies to have X-ray counterparts. It is possible that the faintest K+A galaxies host short lived or very faint AGNs, which are not detected by XBoötes and are swamped by starlight and nebular emission in optical spectra. Alternatively, we speculate that two mechanisms may be responsible for truncating star formation in K+A galaxies, with AGNs truncating star formation in the most luminous galaxies while another mechanism truncates star formation in lower luminosity galaxies.
| J2000 Coordinates | Redshift | Companion | Tidal | BPTbbAGN denotes objects above the criterion of Kewley et al. (2001). SF/AGN denoted objects between the criteria of (Kewley et al. 2001) and (Kauffmann et al. 2003). SF denotes objects below the criterion of Kauffmann et al. (2003). “?” denotes objects without significant detections in the relevant emission-lines for the BPT diagram. | X-ray | X-ray Exp. | |||
|---|---|---|---|---|---|---|---|---|---|
| () | Tail | Class | Photons | ||||||
| 14:26:37.266 +34:46:25.63 | 0.1314 | 19.45 | -18.95 | N | N | SF | 0 | 8943 | |
| 14:26:18.398 +35:02:48.55 | 0.1567 | 19.31 | -19.61 | Y | N | SF | 0 | 8658 | |
| 14:30:14.018 +33:51:38.84 | 0.1817 | 19.01aaA nearby bright star may be biasing the photometry of this galaxy. | -20.01 | Y | N | SF | 0 | 13481 | |
| 14:35:51.378 +33:33:53.72 | 0.2037 | 18.93 | -20.51 | N | N | ? | 0 | 4055 | |
| 14:38:11.278 +34:07:47.69 | 0.2641 | 19.52 | -20.62 | N | N | ? | 0 | 3694 | |
| 14:33:29.167 +33:28:21.37 | 0.1725 | 18.36 | -20.68 | N | N | SF | 1 | 42306 | |
| 14:29:47.738 +34:16:18.81 | 0.1220 | 17.41 | -20.74 | N | Y | SF/AGN | 2 | 7722 | |
| 14:38:19.445 +35:36:01.98 | 0.2483 | 18.88 | -21.11 | N | Y | SF/AGN | 0 | 4141 | |
| 14:30:55.228 +33:26:01.11 | 0.2017 | 18.35 | -21.11 | N | Y | ? | 0 | 8126 | |
| 14:31:01.102 +34:08:44.34 | 0.2307 | 18.47 | -21.30 | N | N | SF | 0 | 18232 | |
| 14:25:52.846 +32:55:56.05 | 0.2139 | 18.20 | -21.37 | N | N | ? | 0 | 10536 | |
| 14:25:48.378 +35:40:55.65 | 0.1840 | 17.66 | -21.51 | N | Y | SF/AGN | 4 | 163416 | |
| 14:34:39.522 +34:30:21.67 | 0.3411 | 19.19 | -21.57 | N | N | SF/AGN | 0 | 3773 | |
| 14:31:20.690 +35:29:26.20 | 0.3347 | 19.00 | -21.77 | Y | N | SF/AGN | 0 | 7068 | |
| 14:29:59.370 +34:22:41.67 | 0.2655 | 18.41 | -21.81 | N | N | AGN | 0 | 8511 | |
| 14:35:00.640 +33:29:23.18 | 0.2736 | 18.33 | -21.86 | Y | N | SF/AGN | 0 | 8430 | |
| 14:25:42.236 +32:44:08.47 | 0.2079 | 17.47 | -22.09 | N | Y | SF/AGN | 1 | 4078 | |
| 14:34:54.275 +33:00:59.97 | 0.2986 | 18.22 | -22.29 | N | N | ? | 2 | 5239 | |
| 14:25:39.281 +33:56:44.48 | 0.3085 | 18.20 | -22.32 | Y | Y | SF/AGN | 5 | 16506 | |
| 14:29:26.729 +33:48:30.14 | 0.2417 | 17.56 | -22.32 | Y | Y | SF/AGN | 1 | 16328 | |
| 14:31:46.450 +34:17:18.49 | 0.1234 | 15.80 | -22.40 | N | Y | AGN | 0 | 15953 | |
| 14:34:31.800 +33:47:59.17 | 0.3318 | 18.31 | -22.42 | Y | N | SF/AGN | 0 | 8725 | |
| 14:25:44.882 +33:34:31.20 | 0.3011 | 17.59 | -22.91 | Y | Y | AGN | 0 | 8391 | |
| 14:26:21.757 +35:11:47.37 | 0.3461 | 17.85 | -23.07 | N | Y | AGN | 3 | 7772 |