Why Did My Query Slow Down?
Nedyalko Borisov† Shivnath Babu† Sandeep Uttamchandani‡ Ramani Routray‡ Aameek Singh‡
†Duke University ‡IBM Almaden Research Center
{nedyalko,shivnath}@cs.duke.edu {sandeepu, routrayr, aameek.singh}@us.ibm.com
Abstract
Many enterprise environments have databases running on network-attached server-storage infrastructure (referred to as Storage Area Networks or SANs). Both the database and the SAN are complex systems that need their own separate administrative teams. This paper puts forth the vision of an innovative management framework to simplify administrative tasks that require an in-depth understanding of both the database and the SAN. As a concrete instance, we consider the task of diagnosing the slowdown in performance of a database query that is executed multiple times (e.g., in a periodic report-generation setting). This task is very challenging because the space of possible causes includes problems specific to the database, problems specific to the SAN, and problems that arise due to interactions between the two systems. In addition, the monitoring data available from these systems can be noisy.
We describe the design of Diads which is an integrated diagnosis tool for database and SAN administrators. Diads generates and uses a powerful abstraction called Annotated Plan Graphs (APGs) that ties together the execution path of queries in the database and the SAN. Using an innovative workflow that combines domain-specific knowledge with machine-learning techniques, Diads was applied successfully to diagnose query slowdowns caused by complex combinations of events across a PostgreSQL database and a production SAN.
1 Introduction
Database deployments in enterprise environments are typically business critical and support high transaction rates. These deployments run on enterprise-class storage subsystems with terabyte-scale data mapped to the database either through a file system (referred to as System Managed Storage) or raw volumes (referred to as Database Managed Storage). Traditionally, storage was attached directly to high-end database servers to meet their capacity, throughput, and bandwidth requirements. However, economic realities of high administration costs for islands of disconnected resources, combined with under-utilization of statically-provisioned server and storage hardware, have transformed the direct-attached architectures into a network-attached setup with multiple application servers (including databases) connected to a consolidated and virtualized storage pool; an architecture known popularly as a Storage Area Network (SAN).
SANs are very complex systems. A typical SAN has a hierarchy of core and edge fibre-channel switches with zoning configuration that controls the connectivity of server ports with one or more heterogeneous storage controllers. The storage controllers manage a large number of raw disks by aggregating them into logical entities like pools and volumes. Given this complexity, database administrators are forced to treat the SAN as a black-box, entrusting SAN administrators to configure the required CPU, network, and storage resources for meeting their database’s performance requirements.
Such a silo-based approach for database and SAN management is the state-of-art today. In a typical real-world scenario, database administrators open problem tickets for the SAN administrator to analyze and fix issues related to query slowdowns: “Queries to the RepDB database used for report generation have a 30% slow down in response time, compared to performance two weeks back.” Unless there is an obvious failure or degradation in the storage hardware or the connectivity fabric, the SAN administrator’s response to this problem ticket could be: “The I/O rate for RepDB tablespace volumes has increased 40%, with increased sequential reads, but the response time is within normal bounds.” This “blame game” may continue for several weeks before the problem is actually fixed. In reality, the query slowdown problem could be due to any number of causes including suboptimal plan selection by the database due to incorrect cost models, lock contention for the database tables, CPU saturation of a database server, congestion in the controller ports, and others. The lack of consistent end-to-end information may lead to either throwing iron at the problem and creating islands of underutilized resources, or employing highly paid consultants who understand both databases and SANs to solve the original problem tickets.
Our vision in this paper is an integrated database and SAN management framework. This framework combines details of both database operations as well as SAN configuration and performance into a novel data structure referred to as an Annotated Plan Graph (APG). The framework uses a combination of machine learning algorithms and domain knowledge to help administrators with key day-to-day tasks such as optimized allocation of SAN resources for varying database workload characteristics, diagnosis of database performance slowdowns, and what-if analysis related to workload or configuration changes. As a concrete instance of our vision, this paper focuses on integrated diagnosis of query performance slowdown in databases running over SANs.
1.1 Challenges in Integrated Diagnosis
Enterprise environments are constantly evolving with changes in the SAN configuration, the mix of database queries, as well as the workload characteristics of other applications sharing the SAN. In such an environment, the key challenges for diagnosis are as follows:
-
Cascading of events: Analyzing the impact of an event across multiple layers of a system is a nontrivial problem. The cause and effect of a problem may not be contained within a single layer, but manifested across multiple layers (typically referred to as event flooding).
-
Inaccuracies in monitoring data: Monitoring in production environments is configured to minimize the impact on the foreground applications. Typically, the monitoring intervals are large (5 minutes or higher), which may lead to inaccuracies (referred to as noisy data) because the instantaneous effects of spikes and other bursty behavior can get averaged out.
-
High dimensional search space with complex correlations: An integrated analysis involves a large number of entities including database operators, physical SAN devices, logical volumes and pools in a SAN, and workload. Pure machine learning techniques that aim to find correlations or regression functions in the raw monitoring data, which otherwise may have been effective within a single layer, can be ineffective in the integrated scenario. Existing diagnosis tools for some commercial databases [10] use a rule-based approach where a root-cause taxonomy is created and then complemented with rules to map observed symptoms to possible root causes. While this approach has the merit of encoding valuable domain knowledge for diagnosis purposes, it may become complex to maintain and customize.
1.2 Contributions
Our vision is to leverage the existing monitoring tools for SANs and databases to develop an integrated database and SAN management platform. This platform will simplify the subset of administrative tasks that require an understanding of both databases and SANs, e.g., problem diagnosis, resource provisioning, what-if analysis, and disaster recovery planning. As a concrete instance of the integrated functionality, the paper describes our prototype of an integrated diagnosis tool (referred to as Diads) that spans the database and the underlying SAN that consists of end-to-end I/O paths with servers, interconnecting network switches and fabric, and storage controllers. Figure 1 shows an integrated database and SAN taxonomy with various logical (e.g., sort and scan operators) and physical components (e.g., server, switch, and storage subsystem).
To the best of our knowledge, Diads is the first diagnosis tool that analyzes both SAN and database events in an integrated fashion. The key contributions of this paper are:
-
A novel canonical representation of database query operations combined with physical and logical entities from the SAN environment (referred to as Annotated Plan Graphs). This representation captures the information required for end-to-end diagnosis, and is created using monitoring data from available database and SAN tools.
-
An innovative diagnosis workflow that drills down progressively from the level of the query to database plans and to operators, and then uses configuration dependency analysis and symptom signatures to further drill down to the level of performance metrics and events in components. It then rolls up using impact analysis to tie potential root causes back to their impact on the query slowdown. The diagnosis is accomplished using a combination of machine learning and domain knowledge
-
An empirical evaluation of Diads on a real-world testbed with a PostgreSQL database running on an enterprise-class storage controller. We describe (and demonstrate) problem injection scenarios including combinations of events at the database and SAN layers, along with a drill-down into intermediate internal results generated by Diads.
2 Related Work
There has been much prior research for performance diagnosis in databases [10, 14] as well as enterprise storage systems [16, 19]. However, most of these techniques perform diagnosis in an isolated manner attempting to identify root cause(s) of a performance problem in individual database or storage silos. Since the performance problem may lie in any one or a combination of database (DB) and SAN layers, an integrated system like Diads would be a useful and more efficient approach.
Recent studies that have looked at the interdependence between database and storage systems highlight the importance of such an integrated analysis. Reference [18] described how an inaccurate storage cost model in the database query optimizer can significantly impact the choice of query execution plans. Reference [17] proposed an end-to-end database and storage planning technique by characterizing the storage I/O workload of a given database workload using an independent combination of database and storage analysis. While sharing the same spirit, our work brings a much tighter coupling of database-level and storage-level information as well as capturing their interdependence using a novel Annotated Plan Graph abstraction described in Section 3.
Diads can be a good complement to fine-grained database diagnosis and tuning tools like Oracle’s Automatic Database Diagnostic Monitor (ADDM) [10]. ADDM is a database profiling and diagnosis tool that uses expert knowledge about the database to identify problems as well to recommend possible fixes to the problems. Reference [6] describes a server-side monitoring and analysis system for Microsoft SQL Server that is useful during manual diagnosis. Our work complements this research by providing a non-intrusive and low-overhead mode of analysis that uses historic performance data to diagnose changes in query performance. We discuss this synergy further in Section 7.
There has also been significant work in diagnosing performance problems within the systems research community [21, 13]. Broadly, these techniques can be split into two categories: (a) systems using machine learning techniques, and (b) systems using domain knowledge. Reference [21, 5] uses statistical techniques to develop models for a healthy machine, and uses the models to identify sick machines. On the other hand, systems like [22, 13, 15, 7] use domain knowledge to create a symptoms database that associates performance symptoms with underlying root causes. Such databases are often created manually and require a high level of expertise and resources to maintain.
We believe that for a diagnosis tool to be practically useful, a mix of machine learning and domain knowledge will be required. Pure machine learning techniques can be misled due to spurious correlations in data resulting from noisy data collection or event flooding (where a problem in one component causes another component to be impacted). In Diads, we counterbalance this effect using suitable domain knowledge like component dependencies, symptoms databases, and knowledge of query plan and operator relationships.
Next, we describe Annotated Plan Graphs that capture database and storage component behavior in a single integrated abstraction.
3 Annotated Plan Graphs
Suppose a query that a report-generation application issues periodically to the database system shows a slowdown in performance. The root cause of this slowdown may lie in the database layer (execution plan becoming suboptimal due to changes in data properties) or the SAN layer (increased congestion in the storage pool) or often a combination of the two. Diagnosing such a problem requires the ability to understand the behavior of not only the database and storage layers during the execution of the query, but also the interaction between the two layers.

The Annotated Plan Graph (APG) abstraction provides this precise ability. At a high level, an APG captures a comprehensive end-to-end mapping of the logical database operators of the query plan to the physical disk details where the actual data resides, and everything in between. Figure 1 shows an example of an APG instance for Query 2 from TPC-H. In the database layer, APG includes the query plan consisting of 25 operators, denoted -, with 9 leaf operators. Below the database layer, APG also includes the SAN configuration and correlations including servers, storage network fabric, storage pools (, ) and storage volumes (, ) containing the database tables.
We describe the complete process of APG construction in Section 3.1. As a quick summary, an APG contains the following kinds of information. At the database level, an APG includes:
-
Query-level data: For each execution of plan , Diads collects some low-overhead monitoring data per operator . The relevant data includes: ’s start time, stop time, and record-counts (estimated and actual number of records in ’s output in the plan).
-
Database-level data includes common metrics like the number of buffer cache hits, full-table scans, random I/Os, and locks held.
The data collected at the SAN level includes: (i) configuration of components (both physical and logical), (ii) connectivity among components, (iii) changes in configuration and connectivity information over time, (iv) performance metrics from components, (v) events generated by the system (e.g., disk failure, RAID rebuild) and (vi) events generated by user-defined triggers (e.g., degradation in volume performance, high workload on storage subsystem).
It is important to note that the APG abstraction is first of a kind in this area. Several product offerings (e.g., [11, 12]) in the market today, while collecting monitoring data from IT systems, only contain silo-based database or SAN information. These product offerings cannot trace the flow of requests across multiple subsystems either because such tracing is impossible (e.g., the subsystems are from multiple vendors) or it is impractical (e.g., the load placed on the production system is high). Thus, no current tool provides a convenient abstraction that captures query behavior in a seamless way across the database and the SAN. Using low-overheard monitoring of historic performance data, an APG fulfills this need.
Some of the novel features of APGs are:
-
APGs are generated from light-weight monitoring data that is readily available in most production environments.
-
APGs are views on the monitoring data that combine what DBAs see—e.g., data on query plans—with what SAN administrators see—data from the numerous SAN components and their interconnections. More importantly, APGs show each administrator what she typically does not get to see. However, APGs are much more than a juxtaposition of these two pieces of data; as discussed next.
-
APGs capture the dependency paths of their constituent components. For example, the dependency path of an operator is the set of physical (e.g., CPU, database cache, disk) and logical (e.g., volume, workload) system components whose performance can impact ’s performance. There are inner and outer dependency paths. The performance of components in ’s inner dependency path can affect ’s performance directly. ’s outer dependency path consists of components that affect ’s performance indirectly by affecting the performance of components on the inner dependency path. As an example, the inner dependency path for the Index Scan operator in Figure 1 includes the server, HBA, FCSwitches, storage subsystem, Pool , Volume , and Disks -. The outer dependency path includes Volumes and (because of the shared disks) and other database queries. Section 4 discusses how these dependency paths can be pruned using correlation analysis.
-
Each component in an APG is annotated with appropriate monitoring data collected during the plan’s execution. For example, the annotation of an operator consists of the performance data collected by Diads for each component in ’s dependency path; this data is collected in the time interval where and are respectively ’s (absolute) start and stop times for that execution.
3.1 Construction of APGs
Constructing an APG involves a number of steps including gathering configuration and performance of SAN and the database components. In this section, we describe how Diads collects and correlates this data starting with the SAN component of the APG.
3.1.1 SAN Layer Data
Configuration Data: Enterprise SANs are based on a shared storage model with multiple servers (DB servers, file servers, etc.) accessing the same backend storage. The storage media (disks) are contained within storage subsystems, also referred to as storage controllers, which provide specialized functionality like RAID, copy services, and storage virtualization. The servers are connected to these storage subsystems through a hierarchy of switches usually as part of a Fibre Channel (FC) network fabric (Figure 1). Each server has one or more Host Bus Adapters (HBAs) with one or more FC ports each. These ports are connected to multiple layers of SAN switches which are then connected to ports on storage subsystems.
Within a subsystem, storage is abstracted through logical storage pools which are carved into storage volumes that are then made accessible to desired servers. Data contained within these volumes is physically placed onto the disks that comprise the logical pool, and may be striped across these disks depending upon the chosen RAID configuration. Additionally, two important configuration settings dictate the accessibility of data to servers: (i) Zoning dictates which storage subsystem ports can be accessed by any given server, and (ii) Logical Unit Number (LUN) mapping/masking configuration defines the storage volumes on the storage subsystem that can be accessed by a particular host. Referring to the example in Figure 1, the database instance is installed on a Redhat Linux Server connected to a Fibre Channel Switch, and uses storage from an IBM DS6000 Storage controller. operates on data residing in Volume which is part of the storage pool (illustrated by a dotted line in the figure).
To manage these complex interconnected and interdependent components,
administrators often use storage management tools like IBM
TPC [12] or EMC Control Center [1]. These tools
collect the entire configuration information from the SAN and store
them in a centralized database. In recent years, both the
communication with SAN devices as well as the schema for the
configuration database are available as open standards, e.g., SNIA
SMI-S [20] for device configuration collection and
Aperi [3] for the configuration database. For our
implementation of Diads we use the IBM TPC database to extract SAN
configuration information which is then correlated with the database
layer information to construct the APG as shown in
Figure 1.
Performance Data: Standards like SMI-S also include performance data for various logical and physical components (e.g., servers, HBAs, storage pools, and storage volumes). This performance data is critical for Diads analysis. For instance, performance attributes monitored from a server and its HBA include Percentage CPU Usage, Free Memory, Cache Hit Rate, Process Start Time, Process End Time CPU, Percentage Utilization by process, Memory Consumed by Process, IO Count, IO per second, HBA FC Port Statistics. For storage components, Diads uses attributes like Bytes Read, Bytes Written, Sequential Read Hits, Sequential Read Requests, Sequential Write Requests, Total IOs. An anomalous value for any of these attributes during a query slowdown is a candidate for additional evaluation in Diads. This performance data is used as annotations in the APG for each respective component.
3.1.2 Database Layer Data and Correlation with SAN Data
In the database layer, an APG includes the query plan information, including data from all the operators in the plan. This data is easily available in most DBMSs. (We used PostgreSQL in our implementation of the Diads prototype.) Each operator is annotated with the performance data of components in its dependency paths.
The dependencies between operators and SAN components are obtained in the following manner. It begins with the parsing of the database configuration file that defines the mapping of the database tablespaces to the storage volumes in the SAN. There are two predominant configurations for associating physical storage to a tablespace defined by the database: (a) System Managed Storage (SMS), where the tablespace is mapped to a file system created on a SAN volume; (b) Database Managed Storage (DMS), where the tablespace is created on a raw physical SAN volume with space allocation and associated book-keeping managed directly by the database. Operators to in Figure 1 are related either directly or indirectly to operations on tables, which belong to tablespaces. Thus, given an operator , it is possible to map to the SAN volumes that depends on. Combining this mapping with the SAN configuration data, we can obtain the inner and outer dependency paths for all plan operators.
4 Design of Diads
When the administrator identifies a query as having experienced a slowdown, Diads invokes the diagnosis workflow shown in Figure 2. This workflow “drills down” progressively from the level of the query to plans and to operators, and then further down to the level of performance metrics and events in components. Finally, an impact analysis is done that “rolls up” to tie potential root causes back to their impact on ’s slowdown. As we will show in this section, the workflow applies a combination of statistical machine learning and domain knowledge to the APGs collected for . This novel combination provides built-in checks and balances to deal with the challenges listed in Section 1.
4.1 Modules in the Diagnosis Workflow
The administrator first specifies declaratively or marks directly the runs of the query that were satisfactory and those that were unsatisfactory. For example, runs with running time below 100 seconds may be satisfactory, or all runs from 8 AM to 2 PM were satisfactory, and those from 2 PM to 3 PM were unsatisfactory.
Module Plan Diffing (PD): The first module in the workflow looks for significant changes between the plans used in satisfactory and unsatisfactory runs. If such changes exist—e.g., if Diads finds that plan was used in satisfactory runs and a different plan was used in unsatisfactory runs—then Diads tries to pinpoint the cause of the plan changes (which includes, e.g., index addition or dropping, changes in data properties, or changes in configuration parameters used during plan selection). Our current implementation considers each schema or configuration change that occurred between the runs of and , and checks whether this change could have caused the plan change. The remaining modules in the workflow are invoked if Diads finds a plan that is involved in both satisfactory and unsatisfactory runs of the query.
Module Correlated Operators (CO): The objective of this module is to find the subset of operators, called the correlated operator set (COS), whose change in performance best explains plan ’s slowdown. COS is identified by analyzing data from satisfactory and unsatisfactory runs of which can be seen as records with attributes for each run of . (Recall the annotations maintained for APGs in Section 3.) Here, attribute is the total time for one complete run of , and attribute is the running time of operator for that run. Attribute is a label representing whether the corresponding run of was satisfactory or not.
Diads feeds this data to Kernel Density Estimation (KDE) which is a statistical method to estimate the probability density function of a random variable. KDE applies an estimator to the data to learn the probability density function of the random variable representing the running time of operator when ’s performance is satisfactory. Let be an observation of ’s running time when ’s performance was unsatisfactory. Consider the probability estimate . Intuitively, as becomes higher than the typical range of values of , becomes closer to 1. Thus, a high value of represents a significant increase in ’s running time when plan performance was unsatisfactory; if so, belongs to COS. is called the anomaly score of operator .
Module Dependency Analysis (DA): This module identifies the subset of system components, called the correlated component set (CCS), such that each component in CCS: (i) is in the dependency path of at least one operator COS, and (ii) has at least one performance metric that is significantly correlated with ’s running time. The fact that a component is in the dependency path of an operator COS (Property (i) above) does not necessarily mean that ’s performance has been affected by ’s performance. Hence, Diads checks additionally for Property (ii) which is implemented as correlation analysis using KDE.
Module Correlated Record-counts (CR): In this module, Diads checks whether the change in performance of operators in COS correlates with their record-counts. Significant correlations mean that data properties have changed between satisfactory and unsatisfactory runs of . Once again, correlation analysis is implemented using KDE to find the correlated record-count set CRS COS.
Module Symptoms Database (SD): COS, CCS, and CRS along with other observed SAN and database events may only be symptoms of the true root cause of ’s slowdown. Module SD seeks to map the observed symptoms to the actual root cause. Diads generates this mapping using a symptoms database whose main purpose is to streamline the use of domain knowledge to (i) create more accurate results by dealing with event propagation, and (ii) generate semantically meaningful results (e.g., reporting lock contention as a cause instead of reporting some performance metrics only). Diads’s implementation of the symptoms database is motivated by an intuitive and commercially-used format called the Codebook. The original format assumes a finite set of symptoms such that each distinct root cause has a unique signature in this set. However, Diads needs to consider complex symptoms such as symptoms with temporal properties (e.g., contention occurred before failure).
Diads’s symptoms database is a collection of root cause entries each of which has the format Cond1 Cond2 Condz, for some which can differ across entries. Each Condi is a condition of the form (denoting presence of ) or (denoting absence of ). Symptom is represented in a high-level language used to express complex symptoms over a base set of symptoms [2]. Each Condi is associated with a weight such the sum of the weights for each individual root cause entry is 100%. From the symptoms observed currently, Diads calculates a confidence score for each root cause as the sum of the weights of ’s conditions that evaluate to true. We further divide the confidence score into three categories: (i) high (score ), (ii) medium ( score ), and (iii) low (score ).
Module Impact Analysis (IA): For each high-confidence root cause identified by Module SD, an impact score is calculated as the percentage of the query slowdown (time) that can be contributed to individually. When multiple problems coexist in the system, impact scores can separate out high-impact causes from the less significant ones. Also, they serve as a safeguard against misdiagnoses resulting from spurious correlations due to noise.
Diads has multiple implementations of this module. One implementation is an “inverse dependency analysis”. First, IA starts from a root cause () and identifies all system components affected by , denoted . The next step is to find the subset of operators () whose performance is affected by . The impact score is calculated as the percentage of extra running time of with respect to the extra plan running time; where extra time is the difference between the average running times across unsatisfactory and satisfactory runs. Another implementation of IA leverages the plan cost models used by database query optimizers.
| Problem Description | Critical Role of Diads Modules in Diagnosis |
|---|---|
| 1. SAN misconfiguration leading to contention in volume | Identified symptoms pinpoint the correct volume; SD maps symptoms to the correct root cause |
| 2. Contention caused by external workloads on volumes and ; with only the former affecting query performance | DA prunes out the unrelated symptoms and events for volume V2 |
| 3. SQL DML causes a subtle change in data properties; problem propagates to SAN causing volume contention | CR identifies the important symptoms; IA rules out volume contention as a root cause |
| 4. Concurrent DB (change in data properties) and SAN (misconfiguration) problems | Both problems identified; IA correctly ranks them |
| 5. DB problem (locking-based) and spurious symptoms of volume contention due to noise | IA identifies volume contention as low impact |
5 Experimental Evaluation
For the evaluation of Diads, we considered query slowdowns caused by problems within the database and SAN layers as well as combinations of problems across both layers (a capability which is unique to Diads). Our experimental testbed is part of a production SAN environment, with the interconnecting fabric and storage controllers being shared by other applications. The testbed runs TPC-H queries on a PostgreSQL database server configured to access tables using two Ext3 file system volumes and created on an enterprise-class storage controller. Figure 1 shows the table layout and the query plan that we will focus on.
Table 1 gives a high-level summary of our experimental scenarios. Diads successfully diagnosed the root cause in all these cases. In this paper we will focus only on the first scenario; additional analysis for all scenarios are covered in [4]. In the first scenario, a contention is created in volume (from Figure 1) causing a slowdown in query performance. The root cause of the contention is another application workload that is configured in the SAN to use a volume V’ that gets mapped to the same physical disks as . For an accurate diagnosis result, Diads needs to pinpoint the combination of SAN configuration events generated on: (i) creation of the new volume V’, and (ii) creation of a new zoning and mapping relationship of the server running the workload that accesses V’.
Modules PD and CR: These two modules correctly identify (respectively) that the plan and the data properties have not changed.
Module CO: Based on KDE, this module identifies the set of correlated operators as , , , , , , , , , and (each operator has an anomaly score greater than the threshold of 0.8). This set correctly contains both the leaf operators ( and ) connected to volume . The eight intermediate operators present in this set are ranked highly because of event propagation: the running times of these operators are affected by the running times of the “upstream” operators (in this case and ). Finally, operator is a false positive because it operates on volume , and is not affected by the contention in . (As we will see shortly, this false positive caused by noise gets filtered out.)
Module DA: This module computes anomaly scores for performance metrics in both volumes and since these volumes fall in the dependency paths of the correlated operators. Table 2’s second column shows the anomaly scores for two representative metrics each from and . (Table 2’s third column is described later in this section.) As expected, none of ’s metrics are identified as correlated because has no contention; while those of are.
| Volume, | Anomaly Score | Anomaly Score |
| Perf. Metric | (no contention in V2) | (contention in V2) |
| V1, writeIO | 0.894 | 0.894 |
| V1, writeTime | 0.823 | 0.823 |
| V2, writeIO | 0.063 | 0.512 |
| V2, writeTime | 0.479 | 0.879 |
Module SD: The symptoms identified so far are: (a) high anomaly scores for operators using , (b) high anomaly scores for ’s performance metrics, and (c) high anomaly score for (only one out of 7 leaf operators using ). These symptoms are strong evidence that ’s performance is a cause of the query slowdown, and ’s performance is not. Thus, even when a symptoms database is not available, Diads correctly narrows down the search space an administrator has to consider during diagnosis. An impact analysis will further point out that the false positive symptom due to has little impact on the query slowdown.
Module SD uses a symptoms database that was developed in-house to diagnose query slowdowns. ’s contention due to the SAN misconfiguration problem was given a high confidence score because all required symptoms are found. (The symptoms database had an entry for this root cause because this problem is very common in production settings.) ’s contention due to a change in database workload got a medium confidence score because of a weak correlation between the performance of some correlated operators and the rest of the database workload. All other root cause entries in the symptoms database got low confidence scores.
Module IA: Impact analysis done using the inverse dependency analysis technique gave an impact score of 99.8% for the high-confidence root cause found. This score is high because the slowdown is caused entirely by the contention in .
Next, we complicated the problem scenario to test Diads’s robustness. Everything was kept the same except that we created extra I/O load on Volume in a bursty manner such that this extra load had little impact on the query beyond the original impact of ’s contention. Without intrusive tracing, it would not be possible to rule out the extra load on as a potential cause of the slowdown.
Interestingly, Diads’s integrated approach is still able to give the right answer. Compared to the previous scenario, there will now be some extra symptoms due to higher anomaly scores for ’s performance metrics (as shown in the third column in Table 2). However, root causes with contention-related symptoms for will still have low confidence because most of the leaf operators depending on will have low anomaly scores as before. Also, impact scores will be low for these causes.
Unlike Diads, a SAN-only diagnosis tool may spot higher I/O loads in both and , and attribute both of these as potential root causes. Even worse, the tool may give more importance to because most of the data is on . A database-only tool can pinpoint the slowdown in the operators, but it would likely give several false positives like a suboptimal buffer pool setting or a suboptimal choice of execution plan.
Some observations from evaluating Diads on the broad range of scenarios in Table 1 are:
-
Compared to correlation analysis using advanced models (e.g., Bayesian networks [8]), KDE can produce accurate results with few tens of samples, and is more robust to noise in the data.
-
Diads can deal with (i) database-level problems whose symptoms propagate to the SAN, and vice versa; (ii) independent and concurrent database-level and SAN-level problems; and (iii) spurious and missing symptoms caused by noise.
-
Diads produces good results even when the symptoms database is incomplete. While we expect that entries in the symptoms database are reviewed carefully by administrators, Diads’s own modules like correlation, dependency, and impact analysis can be used to identify important symptoms automatically.
6 System Operation/Usage
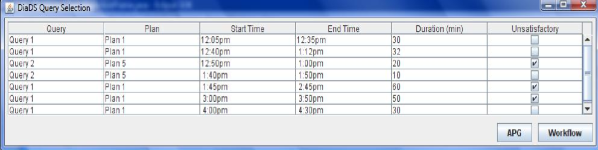
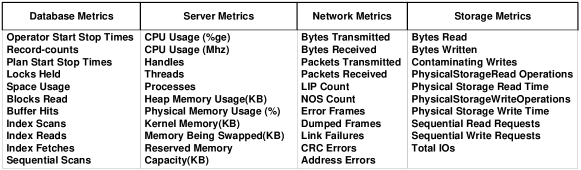
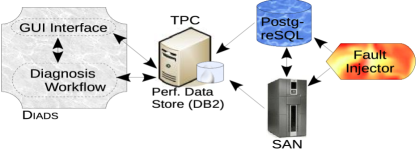
Figure 5 illustrates an example Diads deployment as well as the data flow from the other systems that Diads communicates with. This deployment, which we will use in our demonstration, consists of:
-
Data-warehousing queries from the TPC-H benchmark running on a PostgreSQL database server configured to access data on an enterprise-class IBM storage controller.
-
The IBM TotalStorage Productivity Center (TPC) [12] running on a separate machine recording configuration details, statistics, and events from the SAN as well as from PostgreSQL (which was instrumented to report the data to the management tool). Figure 4 shows the key performance metrics collected from the database and SAN. The monitoring data is stored as time-series data in a DB2 database.
-
Diads running on a separate server: Its graphical user interface (GUI) supports APG-oriented display and browsing of data collected in the DB2 database. Recall that APGs are views on the monitoring data that combine what DBAs see – e.g., data on query plans – with what SAN administrators see – data from the numerous SAN components and their interconnections. APG-oriented visualization was implemented due to comments from administrators that to diagnose a reasonable fraction of problems all they need to see is the APG diagram.
-
Diads’s diagnosis workflow which is invoked on demand: Each module in the workflow is implemented using a combination of Matlab scripts (for KDE) and Java. Diads uses a symptoms database that was developed in-house to handle query slowdowns.
-
A fault injector111The fault injector module is used for test purposes and verification of the correctness of the Diads results. This module is not required for production deployments. that can inject a variety of faults at the database and SAN levels, including SAN misconfiguration, server, disk, or volume contention, RAID rebuilds, changes in data properties, and table-locking problems.
Diads diagnosis starts with the administrator identifying a query that has experienced a slowdown. The diagnosis workflow is then invoked. By default, the workflow is run in a batch mode where all modules are executed one after the other, and only the final results are displayed to the administrator. However, Diads supports an interactive mode where results are displayed after the completion of each module, and the administrator can edit these results before they are fed to the next module. In this mode, the administrator can also re-execute or bypass modules, as well as stop the execution if the desired result is obtained quickly. In the rest of the section, we describe the interactive mode and provide explanations on the presented screenshots.
Diads first screen (illustrated in Figure 3) provides a view of the executed queries in the database. For each query execution, a corresponding row with the information regarding the execution is presented in the table. Following information is displayed:
-
Query: The actual query string, available as a tool-tip or as a pop-up box when the cell is clicked.
-
Plan: Executed plan for the query. A visual representation is showed as a tool-tip or pop-up box on cell click.
-
Start time: The time when the query began execution.
-
End time: The time when the query completed execution.
-
Duration: The number of minutes that the query needed to complete execution.
-
Unsatisfactory check-box: This check-box is used by the administrator to mark the query executions that have unsatisfactory performance. Diads also supports declarative rules for specifying which query executions are unsatisfactory, e.g., every query execution that has a running time greater than 30 minutes is unsatisfactory.
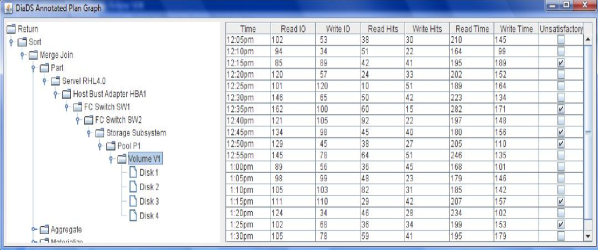
The APG button below the table, navigates the administrator to the APG visualization screen (Figure 6), where the APG for the highlighted query execution is displayed. On the left side of this screen, the APG structure is presented as a tree. Figure 6 shows the path from Figure 1, that starts from the Return operator, goes through the Index Scan on Part table and then all the way to the disks. The right side of the APG screen contains a table of time series performance metrics for any component selected from the APG. As each component of the APG has a different set of performance attributes, the displayed attributes in the table vary. However, there are two attributes that are displayed for all components: (i) Time: presenting the time in which the measurement in the corresponding row was taken, and (ii) Unsatisfactory check-box: presenting the performance categorization of the component. This check-box is populated based on the unsatisfactory check-box selection of the query executions in the previous screen. For example, during an unsatisfactory query execution, all the measurements taken during the execution are marked as unsatisfactory. However, the administrator can modify this labeling by selecting this check-box or not. As an example, Figure 6 shows the metrics that capture volume V1’s performance from 12:05pm till 1.30pm.
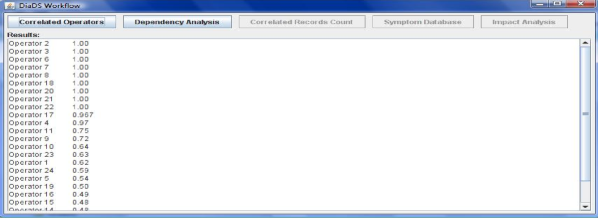
The Workflow button on the query selection screen invokes the Diads workflow execution screen (Figure 7). This screen guides the administrator step by step through the tool workflow. Each module in Diads can be executed by clicking on the corresponding button on the top of the screen. Only the first execution of the modules should be in order, after that each module can be re-executed as many times as needed and in any order.
The result panel on the screen shows the result of the last executed module. Figure 7 shows the state of the screen after invocation of the module Correlated Operators. As this screenshot presents the first invocation of the module, all modules after dependency analysis are disabled (i.e., they cannot be executed next). When the last module is executed (Impact Analysis), the root causes identified by Diads for the corresponding query slowdown are listed in the result panel.
7 The Potential of Integrated Database and SAN Tools
While integrated diagnosis using Diads solves an important practical problem, the proposed system and techniques have the potential to enable even broader functionality. In this section, we present few instances of these capabilities.
-
What-if analysis: Often database and storage administrators have to apply changes within their respective configurations. In typical enterprises, this either proceeds without regard to impact on the other layer or requires extensive collaboration between the two teams. In contrast, using techniques developed in our work, it is easy to conceive an integrated database and SAN tool that allows administrators to proactively assess the impact of their planned changes on the other layer. In fact, the impact analysis component of Diads seems to be a promising approach for developing such a feature. While it may not completely identify all possible problems, it will serve as a valuable check which can then lead to quicker and more focused discussions between the teams.
-
Proactive diagnosis and self-healing: Another useful extension for Diads is to provide proactive diagnosis and importantly, self-healing capability. The current symptoms database design can be extended to include, along with symptoms, possible fixes for the root cause of the problem. Once the tool identifies a root cause, it can then apply the fix to self-heal the environment. It is important to note that as in real life, the fix may be required within the database or storage or a combination of both layers. An integrated approach like ours will be crucial in identifying the right fix and then applying it in any one layer.
-
Integrated Database and SAN Planning: Along with diagnosis, we believe that annotated plan graphs, by capturing information from the database and SAN layers into a single construct, can lead to smarter planning and optimization for database deployments over a SAN. For example, decisions like the choice of storage required for given database workloads or choice of DB query plan given the storage infrastructure can be intelligently made using these techniques. An early work by Salem et al [17] presented a similar approach for such integrated planning, though it uses a concatenation of independent database and storage analysis components. In contrast, annotated plan graphs provide a much tighter integration with information flow between the two layers aiding in analysis.
-
Machine Learning and Domain Knowledge Interplay: One of the important aspects of our work is the coupling of machine learning and domain knowledge techniques towards diagnosis. Use of domain knowledge through a symptoms database serves as a guiding tool to the machine learning algorithms preventing spurious correlations due to noisy data or event propagation. An interesting course of future work is to enhance this relationship with machine learning techniques contributing towards identifying potential symptoms which can be checked by an expert and added to the symptoms database. Considering that a symptoms database may never be complete, this provides a self-evolving mechanism towards bettering the quality of the symptoms databases.
-
Synergy between Diads and ADDM [10]: A possible deployment of Diads is along with a more fine-grained diagnosis tool like Oracle ADDM [10, 9] which uses instrumented code to get operator level timing information. Both use a similar mechanism of finding symptoms and then mapping them to a root cause. However, our use of historic performance data helps in answering questions like why did my query slow down? while ADDM helps answering questions like why is my query slow?. A combination of the tools provides a stronger analysis engine.
8 Conclusions
In this paper, we presented our vision for an integrated database and SAN management framework. This framework is aimed at assisting administrators in management tasks that require an understanding of both database and SAN environments. As an example of this vision, we described a diagnostic tool, called Diads, that supports root cause analysis for problems that span databases and SANs. This integrated diagnosis is based on a novel information abstraction called Annotated Plan Graph (APG) that captures the end-to-end mapping of database operators and their dependencies on various SAN components, including performance and configuration information. Using a novel interplay of machine learning and domain knowledge (e.g., symptoms databases), Diads progressively drills down from the SQL query to execution plans, operators, and eventually to performance and configuration characteristics of the SAN components. It can then associate impact of potential problems to the actual symptoms to identify the root cause of the problem. We also described some experimental scenarios of Diads diagnosis for root cause problems occurring in database and SAN layers.
We contend that the integrated management framework and the APG abstraction presented in this paper enables a key capability in enterprise data center management. By providing visibility into the SAN to database administrators and vice versa, it allows for smarter resource planning and improved efficiencies in the data center.
References
- [1] Emc control center family. http://www.emc.com/products/storage_management/controlcenter.jsp.
- [2] Ana Biazetti and Kim Gajda. Achieving complex event processing with Active Correlation Technology. www-128.ibm.com/developerworks/autonomic/library/ac-acac.
- [3] Aperi Storage Management Project. http://www.eclipse.org/aperi.
- [4] S. Babu, N. Borisov, S. Uttamchandani, R. Routray, and A. Singh. Diads: Addressing the ”my-problem-or-yours” syndrome with integrated san and database diagnosis. In To Appear in Proceedings of Usenix File and Storage Technologies (FAST’09).
- [5] S. Basu, J. Dunagan, and G. Smith. Why did my pc suddenly slow down? In Proceedings of the 2nd USENIX workshop on Tackling computer systems problems with machine learning techniques (SYSML), pages 1–6, 2007.
- [6] S. Chaudhuri, A. C. König, and V. R. Narasayya. Sqlcm: A continuous monitoring framework for relational database engines. In Proceedings of the International Conference on Data Engineering (ICDE), pages 473–485, 2004.
- [7] S. K. Chilukuri and K. Doraisamy. Symptom Database Builder for Autonomic Computing. In International Conference on Autonomic and Autonomous Systems (ICAS), July 2006.
- [8] I. Cohen, J. S. Chase, M. Goldszmidt, T. Kelly, and J. Symons. Correlating Instrumentation Data to System States: A Building Block for Automated Diagnosis and Control. In Proc. of the USENIX Operating Systems Design and Implementation (OSDI), Dec. 2004.
- [9] B. Dageville, D. Das, K. Dias, K. Yagoub, M. Zait, and M. Ziauddin. Automatic sql tuning in oracle 10g. In Proceedings of the International Conference on Very Large Data Bases (VLDB), pages 1098–1109, 2004.
- [10] K. Dias, M. Ramacher, U. Shaft, V. Venkataramani, and G. Wood. Automatic performance diagnosis and tuning in oracle. In Proceedings of Conference on Innovative Data Systems Research (CIDR), pages 84–94, 2005.
- [11] Hewlett Packard Systems Insight Manager. http://h18002.www1.hp.com/products/servers/management/hpsim/index.html.
- [12] IBM TotalStorage Productivity Center. http://www-306.ibm.com/software/tivoli/products/totalstorage-data/.
- [13] A. Manji. Creating symptom databases to service j2ee applications in websphere studio, 2004. IBM Library.
- [14] A. Mehta, C. Gupta, S. Wang, and U. Dayal. Automatic workload management for enterprise data warehouses. IEEE Data Eng. Bull., 31(1):11–19, 2008.
- [15] M. Perazolo. The autonomic computing symptoms format, 2005. IBM Library.
- [16] K. T. Pollack and S. Uttamchandani. Genesis: A scalable self-evolving performance management framework for storage systems. In IEEE International Conference on Distributed Computing Systems (ICDCS), page 33, 2006.
- [17] Y. Qin, K. Salem, and A. K. Goel. Towards adaptive costing of database access methods. In Proc. of Workshop on Self-Managing Database Systems (SMDB), 2007.
- [18] F. Reiss and T. Kanungo. A characterization of the sensitivity of query optimization to storage access cost parameters. In SIGMOD Conference, pages 385–396, 2003.
- [19] K. Shen, M. Zhong, and C. Li. I/o system performance debugging using model-driven anomaly characterization. In Proceedings of the 4th conference on USENIX Conference on File and Storage Technologies (FAST), pages 23–23, 2005.
- [20] Storage Networking Industry Association. SMI Specification, 2003. http://www.snia.org.
- [21] H. J. Wang, J. C. Platt, Y. Chen, R. Zhang, and Y.-M. Wang. Automatic misconfiguration troubleshooting with peerpressure. In Proceedings of USENIX OSDI Conference, pages 245–258, 2004.
- [22] S. A. Yemini, S. Kliger, E. Mozes, Y. Yemini, and D. Ohsie. High speed and robust event correlation. IEEE Communications Magazine, 34, 1996.