11email: maurogr@if.ufrgs.br; mgp@if.ufrgs.br and charles@if.ufrgs.br
The lenticular galaxy NGC 3607: stellar population, metallicity and ionised gas
Abstract
Context. The investigation of the dominant formation mechanism of early-type galaxies.
Aims. In this work we derive clues to the formation scenario and ionisation source of the lenticular galaxy NGC 3607 by means of metallicity gradients, stellar population and emission lines properties.
Methods. We work with long-slit spectroscopy from which we (i) study the radial distribution of the equivalent widths of conspicuous metallic absorption features, (ii) infer on the star-formation history (with a stellar population synthesis algorithm), and (iii) investigate the ionisation source responsible for a few strong emission lines.
Results. Negative radial gradients are observed for most of the absorption features of NGC 3607. Compared to the external parts, the central region has a deficiency of alpha elements and higher metallicity, which implies different star-formation histories in both regions. At least three star formation episodes are detected, with ages within 1-13 Gyr. The dynamical mass and the gradient slope are consistent with mergers being important contributors to the formation mechanism of NGC 3607. Emission-line ratios indicate the presence of a LINER at the centre of NGC 3607. Contribution of hot, old stars to the gas ionisation outside the central region is detected.
Conclusions. Evidence drawn from this work suggest small mergers as important contributors to the formation of NGC 3607, a scenario consistent with the star-formation episodes.
Key Words.:
Galaxies: elliptical and lenticular, cD; Galaxies: individual: NGC 3607; Galaxies: fundamental parameters1 Introduction
Significant efforts have been undertaken in the last few years to understand the complex mechanisms associated with the formation and evolution of the early-type galaxies. Since the early 90’s it was established that ellipticals cannot be described as being part of a one-parameter family, and that many show unambiguous signatures of interaction with companions and the environment (van den Bergh 1990). Such facts suggest that these galaxies may have experienced different star formation histories, with the present-day stellar populations differing in metallicity and/or age. In this sense, most early-type galaxies (or their nuclei) are not characterised by a single-aged stellar population. Instead, they are better described by a composition of single stellar populations (e.g. Worthey, Faber & Gonzáles 1992; Arimoto & Yoshii 1987; Rickes et al. 2004; Rickes et al. 2008).
Observationally, clues to the star formation history of a galaxy can be found in the radial dependence of the stellar ratio, or more specifically the Mg/Fe abundance ratio (Pipino, Matteucci & Chiappini 2006). The line-strength distribution in early-type galaxies can vary considerably, with radial profiles ranging from essentially featureless to rather structured. In the latter case, changes of slope, possibly associated with kinematically decoupled cores, or anomalies in the stellar population, have been observed in some ellipticals (e.g. Carollo et al. 1993).
In this context, the investigation of the spatial distribution of the stellar population and metallicity in samples of early-type galaxies may shed some light on the formation and evolution issues. With the above goals in mind, we have been conducting a systematic study of objects rich in interstellar medium, such as NGC 5044 (Rickes et al. 2004) and NGC 6868 (Rickes et al. 2008).
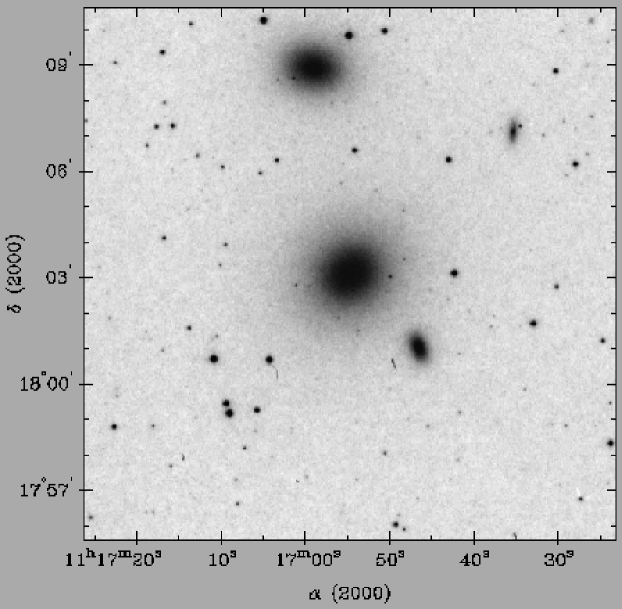
This work focus on the lenticular galaxy NGC 3607, which is the central and brightest member of a group that contains the galaxies NGC 3605 and NGC 3608 as well. Fig. 1 shows a V band image of NGC 3607 and companions, extracted from the Canadian Astronomy Data Centre (CADC)111http://cadcwww.dao.nrc.ca/.
The radial velocity of NGC 3607 is km s-1 (Ferguson & Sandage 1990), which puts it at a distance of Mpc (with ). At such a distance, 1″ corresponds to about 0.062 kpc. NGC 3607 is a LINER with X-ray emission (Terashima et al. 2002), and discrete sources in the host galaxy are the probable origin of the extended hard X-ray emission. The hot gas in this elliptical galaxy has been analysed by Matsushita et al. (2000). NGC 3607 is another case where the dust and ionised gas distribute as a small asymmetric disk. The dust absorption is stronger in the northeast direction, while the ionised gas emission is more important towards the southwest (Ferrari et al. 1999).
The goal of this paper is to investigate the stellar population, metallicity distribution and the presence of ionised gas in NGC 3607, which are important parameters to understand the formation and evolution of this galaxy.
This paper is organised as follows: Sect. 2 presents the observations and data reduction; Sect. 3 deals with the equivalent width analysis of the absorption lines and their radial dependence; Sect. 4 describes the stellar population synthesis, whose results are discussed in Sect. 5; Sect. 6 presents an analysis of the emission lines and the nature of the ionisation source. Finally, in Sect. 7 a general discussion of the results and conclusions will be drawn.
2 Observations and spectra extraction
In the present paper we study the star formation history, metallicity distribution, and emission-gas properties of NGC 3607. Basically, we work with long-slit spectroscopy and a star formation synthesis algorithm, following similar methods as those applied to NGC 6868 and NGC 5903 (Rickes et al. 2008). General parameters of the bright S0 galaxy NGC 3607 are given in Table 1.
| Parameter | Value |
|---|---|
| Heliocentric radial velocity | |
| Distance | Mpc |
| Redshift | |
| Diameters | |
| Effective radius† |
-
Data obtained at the NASA/IPAC Extragalactic Database (NED) which is operated by the Jet Propulsion Laboratory, California Institute of Technology, under contract with the National Aeronautics and Space Administration. () from Annibali et al. (2007).
The observations were obtained with the ESO 3.6m telescope at La Silla, Chile, equipped with EFOSC1. The spectra cover the range Å with a 3.6Å/pixel resolution. The spatial scale of the observational configuration is ; the slit length was while its width was fixed at , corresponding approximately to the average seeing; two 2-dimensional spectra were obtained with the same exposition time (approximately 45 minutes) and position angle . In all cases, the extraction area was fixed at , which corresponds to .
The standard star was observed for flux and velocity calibrations. We point out that the average FWHM of the absorption features in the spectrum of is between 8 and 10 Å, similar to that of the Lick/IDS system.
The spectra were corrected for the radial velocity and the foreground Galactic extinction (Table 1). The corrected spectra, normalised at Å, are shown in Fig. 2, separately for the northeast and southwest directions on the galaxy.

3 Radial properties of absorption features
Important information on the chemical abundance and stellar population of a galaxy can be obtained from the analysis of the equivalent widths of a set of selected absorption lines and continuum fluxes (e.g. Rickes et al. 2008; Rickes et al. 2004, and references therein). Here we work with the continuum tracing and spectral windows for the absorption features defined by the Lick system (Faber et al. 1985).
Because of the somewhat restricted coverage of our NGC 3607 spectra (Sect. 2), the available absorption features are Mg 2, Fe iλ5270, Fe iλ5335, Fe iλ5406, Fe iλ5709, Fe iλ5782, Na iλ5895, and TiO iiλ6237. Continuum points within the same spectral region are , , , , , , , and .
Some early-type galaxies have been shown to present systematic spatial variations on the line strength of the indices Mg 2 and Fe i, either from the centre to the external regions or limited to the central region (e.g. Gonzáles 1993; Carollo & Danziger 1994; Carollo et al. 1993; Davis et al. 1993; Fisher & Illingworth 1995; Fisher & Illingworth 1996).
The above arguments suggest the occurrence of changes in some fundamental properties of the underlying stellar population. In order to investigate the stellar population and metallicity gradient in NGC 3607, we first analyse the spatial distribution of metal-line strengths, and then apply a stellar population analysis.
Strong absorption lines of neutral iron and sodium, as well as Mg2 and TiO bands, are present in the spectra of NGC 3607 (Fig. 2). Particularly conspicuous features are the Mg 2λ5176, Fe iλ5270, Fe iλ5335, Fe iλ5406, Fe iλ5709, Fe iλ5782, Na iλ5895, and TiO iiλ6237. These absorption features present a strong dependence with the age and metallicity of the underlying stellar population (e.g Bica & Alloin 1986; Rickes et al. 2004; Rickes et al. 2008).
Each equivalent width (EW) has been measured three times, allowing for the uncertainties in the continuum level definition due to noise in the spectra. This procedure allowed us to estimate the average value and corresponding standard deviation from the average for each measurement.
Subsequently, the observed values of EW were corrected for line broadening due to the stellar velocity dispersion. We followed the same procedure as described in Rickes et al. (2008). The spectrum of the G giant star , assumed to have zero intrinsic velocity, was broadened with a series of Gaussian filters with velocity dispersion varying from to in steps of . For each absorption feature considered we calculate an empirical correction index , so that , where EW(0) and EW() are the observed and broadened equivalent widths, respectively. We calculate the correction index for each extracted spectrum using the values defined by Caon et al. (2000).
The EWs measured in the spectra of NGC 3607, corrected for the velocity dispersion, are given in Table 2. Except for the Mg2 index, which is measured in magnitude, the remaining EWs are given in Å.
| index | ||||||||||
|---|---|---|---|---|---|---|---|---|---|---|
| (″) | (mag) | (Å) | (Å) | (Å) | (Å) | (Å) | (Å) | (Å) | (Å) | |
| 0.00 | 0.00 | |||||||||
| 3.05S | 0.07 | |||||||||
| 6.10S | 0.14 | |||||||||
| 9.15S | 0.21 | |||||||||
| 12.20S | 0.28 | |||||||||
| 15.25S | 0.35 | |||||||||
| 18.30S | 0.42 | |||||||||
| 24.40S | 0.56 | |||||||||
| 30.50S | 0.70 | |||||||||
| 3.05N | 0.07 | |||||||||
| 6.10N | 0.14 | |||||||||
| 9.15N | 0.21 | |||||||||
| 12.20N | 0.28 | |||||||||
| 15.25N | 0.35 | |||||||||
| 18.30N | 0.42 | |||||||||
| 24.40N | 0.56 | |||||||||
| 30.50N | 0.70 |
-
Note that EW of Mg2 index is given in mag. Extraction area of all spectra of NGC 3607 is . The EWs are corrected for velocity dispersion and the errors are the standard deviation of the average of the three different EW measurements for each line.
The corrected EWs of NGC 3607 (Table 2) are shown as a function of the distance to the galaxy centre in Fig. 3. Except for Fe iλ5782, the remaining absorption features present significant variations with distance to the centre. In particular, the Mg 2 band clearly shows a negative gradient, i.e. increasing towards the centre of the galaxy. Evidence of similar negative gradients are seen in the other features.

Similar gradient slopes in the Mg 2 index and the Fe i features suggest the same chemical enhancement process for these elements. Furthermore, as shown in Fig. 4, the EW of Mg 2 correlates both with and , which is consistent with the same enrichment process acting on Mg and Fe in NGC 3607.

When the gravitational potential is strong enough to retain the gas ejected by supernovae events and massive stars winds, it eventually migrates to the galaxy’s central regions. Thus, it should be expected that subsequent generations of stars will be more metal rich at the centre than in the external parts. Consequently, a negative radial metallicity gradient should be established as a mass-dependent parameter. In this scenario, a galaxy formed essentially through a monolithic collapse, i.e. with a small contribution of mergers, is expected to present a well-defined correlation between the metallicity gradient(Larson 1974; Ogando et al. 2005) and total mass (Carollo et al. 1993).
The above issue was investigated by Carollo et al. (1993), who studied the dependence of the gradient with galaxy mass in a sample of 42 elliptical galaxies. They detected a conspicuous correlation for masses lower than , followed by a saturation for higher masses. Different formation mechanisms, such as a less dissipative collapse and/or merger of smaller galaxies, are invoked to explain the lack of gradient slope to galaxy mass correlation for the high-galaxy mass range (e.g. Carollo et al. 1993). In addition, the correlation between with velocity dispersion () - confined to the low-mass galaxies found by Ogando et al. (2005) - suggest that only galaxies below some limiting have been formed by collapse, whereas the massive ones were formed predominantly by mergers.
In order to check how NGC 3607 fits in the metallicity gradient vs. galaxy mass picture of Carollo et al. (1993), we first estimate the galaxy’s dynamical mass with the approximation of Poveda & Allen (1975), , where is the gravitational constant, is the effective radius and is the central stellar velocity dispersion. The dynamical mass computed for NGC 3607 is which, together with the Mg 2 index gradient slope , puts this galaxy in the merger-dominated region (see Fig. 11 of Carollo et al. 1993).
4 Stellar population synthesis
In this section we investigate the star formation history and derive properties of the stellar population of NGC 3607 by means of the stellar population synthesis method of Bica (1988). As population templates we use the synthetic star cluster spectra of Bruzual & Charlot (2003)222Built with a Salpeter (1955) Initial Mass Function.
As a first approach we tested large bases with templates with ages between 1 Myr and 13 Gyr, but we found that the flux contribution of the components younger than a few Myr is statistically meaningless. Thus, for simplicity we built a spectral base containing 7 templates. After several tests we verified that the base that best reproduces the observed spectra, without redundancy, is the one with the ages 1, 5 and 13 Gyr, together with the metallicities . Such values are taken as representative of the sub-solar, solar and above-solar metallicity ranges (e.g. Rickes et al. 2008). The distribution of templates in the age-metallicity plane is shown in Table 3. We note that the working base is rather restricted in components to minimise potential age/metallicity degeneracies (e.g. Rickes et al. 2008) due to the relatively small number of absorption features available in our spectra of NGC 3607 (Fig. 2).
We now compare the present stellar population synthesis results with previous works. Recentelly, Annibali et al. (2007) have studied the underlying stellar population of a large sample of early-type galaxies, among them NGC 3607, by means of the , Iron and Mgb age and metallicity indicators. They report for this galaxy an average stellar population age of 3.1 Gyr, while we found an average age of 8.8 Gyr, based on the the central and external region values, a value that is more consistent for an SO galaxy. This discrepancy could be due to the different methodologies used to obtain the age of NGC 3607. Interestingly, we note that this does not occur with other galaxies of Annibali et al. (2007) that have been studied by us following the same techniques as in the present paper. For NGC 5044 and NGC 6868 (Rickes et al. 2004, 2008) we obtained the average ages of 13 and 9.8 Gyr, respectively, which are very close to the 14.2 and 9.2 Gyr found by Annibali et al. (2007).
| 13 Gyr | A1 | A2 | A3 |
|---|---|---|---|
| 5 Gyr | B1 | B2 | B3 |
| 1 Gyr | C2 |
The stellar population synthesis algorithm provides directly the flux fractions (relative to the flux at ) that each age and metallicity template contributes to the observed spectrum. The sum of the template spectra, according to the individual flux fractions, should be representative of the stellar population contribution to the observed spectrum. A detailed description of the algorithm is provided in Rickes et al. 2004.
Results of the stellar population synthesis are summarised in Fig. 5, which shows the 1, 5, and 13 Gyr component contributions to the flux at , along most of the galaxy’s radial extent. The 5 and 13 Gyr curves in Fig. 5 correspond to the sum over the three metallicity components. In all cases the solar metallicity is the dominant component with a contribution higher than 70%, while the component contributes with , and the with the remaining . Within uncertainties, the 5 and 13 Gyr components dominate the spectra, from the centre to the external parts. The error bars in Fig. 5 are the standard deviation from the average of all possible solutions for each stellar population template.
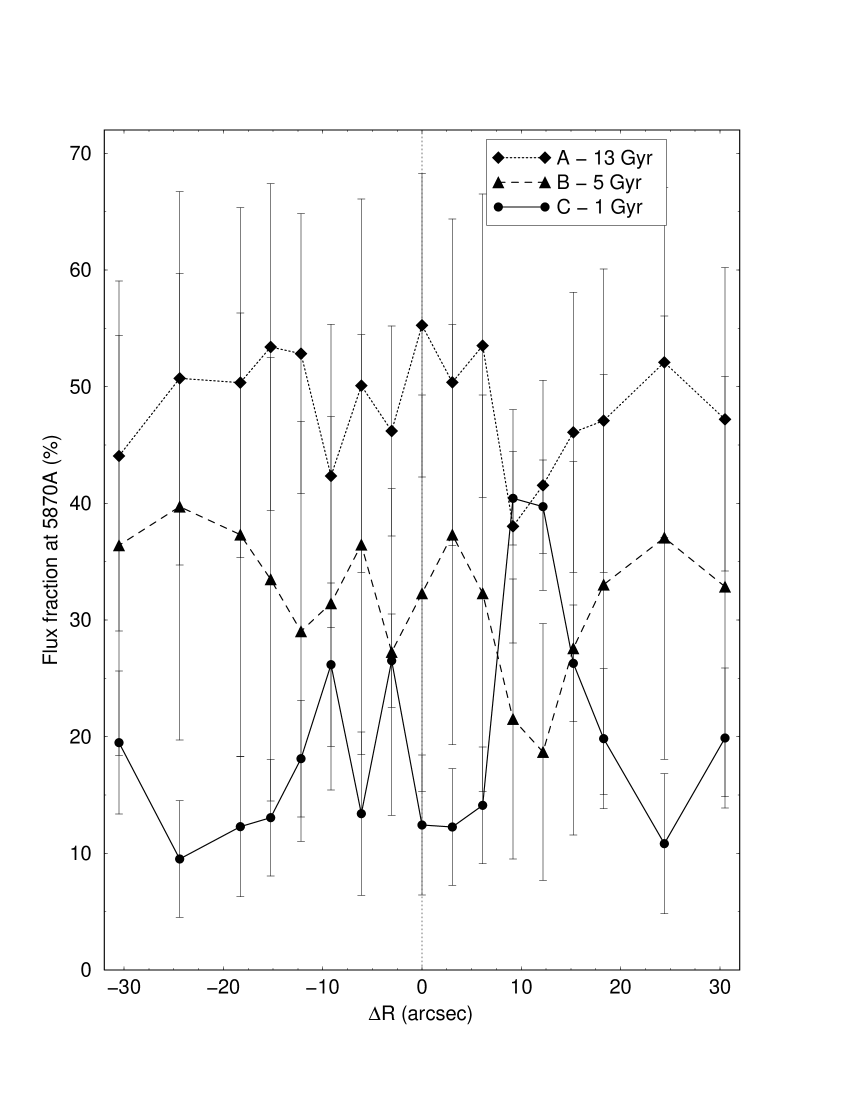
As a caveat we note that our observed spectra of NGC 3607 cover a relatively short spectral range. Thus, they contain a restricted number of indices sensitive to age and metallicity that, in principle, could provide a small number of constraints for the synthesis, especially in terms of metallicity. Nevertheless, Fig 5 indicates that the 13 Gyr population dominates in NGC 3607, contributing with approximately % of the flux at . The 5 Gyr population contributes with approximately %.
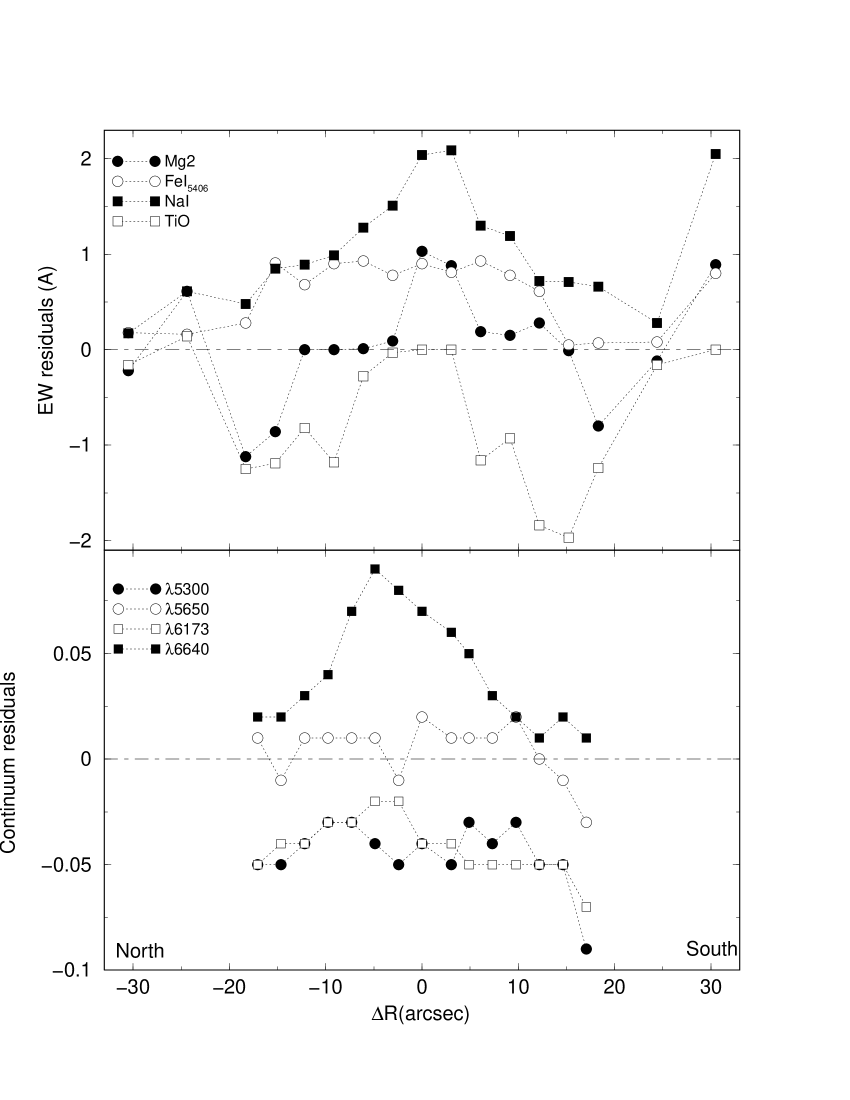
Another way to assess the efficiency of the stellar population synthesis algorithm is by means of the residuals (difference between the observed and synthesised values), both in EWs and continuum points. With a few exceptions, the synthesised EWs are within Å of the observed values, while for the synthesised continuum points (normalised to Å) the offset lies within . We illustrate this in Fig. 6 for representative features and continuum points. The residuals are almost equally distributed between positive and negative values, which indicates that metallicity variations in NGC 3607 are essentially contemplated by the adopted templates (Table 3).
5 Metallicity
We also investigate metallicity properties of NGC 3607 by comparing the measured Lick indices of Mg 2, Fe iλ5270, and Fe iλ5335 (Table 2), with the equivalent ones derived from single-aged stellar population (SSP) models (Thomas et al. 2003, Buzzoni et al. 1992) that assume a Salpeter (1955) initial mass function and different ages. After testing a range of SSP ages, we found that the indices measured in NGC 3607 are best described by the 10 Gyr models.
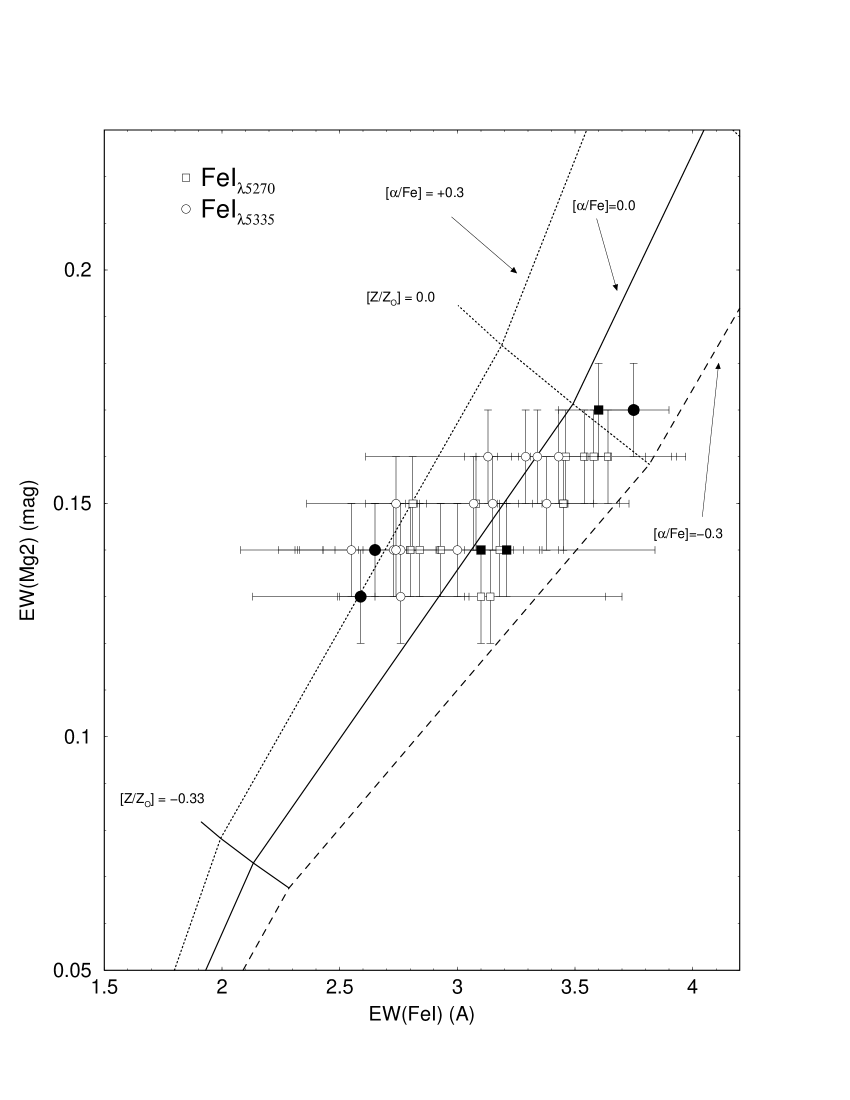
In Fig. 7 we compare our Lick indices measured in NGC 3607 with the equivalent ones computed from SSP models built for different metallicities and ratios. The central parts of NGC 3607 present a small deficiency of alpha elements with respect to iron (), whereas the opposite trend appears to characterise the external parts. We found the average value of = 0.13 , which is comparable to the value 0.24 reported by Annibali et al. (2007).
NGC 3607 presents sub-solar metallicity, with the external parts being more metal-poor than the nucleus. The differences observed in imply different mechanism of chemical enrichment for the central and external regions of NGC 3607.
6 Ionised gas
Emission gas has been detected in a large number of elliptical and lenticular galaxies (Phillips et al., 1986; Macchetto et al., 1996; Rickes et al., 2004, 2008). However, the origin of this gas and the ionisation source are not yet conclusively established. It is clear from Fig. 2 that NGC 3607 presents conspicuous emission lines throughout its body. In this section we investigate the physical conditions and ionisation source of the gas.
The properties of the emission gas are derived from line fluxes measured in the stellar population subtracted spectra (Sec 4). The emission line fluxes of H , [N ii]λ6548, [N ii]λ6584, [S ii]λ6717 and [S ii]λ6731 were measured with Gaussian functions fitted to the profiles. They are listed in Tab. 4
| R (″) | |||||||
|---|---|---|---|---|---|---|---|
| (1) | (2) | (3) | (4) | (5) | (6) | (7) | (8) |
| 0.00 | |||||||
| 3.05S | |||||||
| 6.10S | |||||||
| 9.15S | |||||||
| 12.20S | |||||||
| 15.25S | |||||||
| 18.30S | |||||||
| 24.40S | |||||||
| 30.50S | |||||||
| 3.05N | |||||||
| 6.10N | |||||||
| 9.15N | |||||||
| 12.20N | |||||||
| 15.25N | |||||||
| 18.30N | |||||||
| 24.40N |
-
flux in col. 2 is given in . Col. 7: ; col. 8: .
The spatial distributions of the measured ratios and are shown in Fig. 8. While the former presents significant changes with distance to the centre, the latter is more uniformly distributed.

Assuming that the emission lines are formed essentially by recombination, the number of ionising photons (Q(H)) can be calculated as (Osterbrock, 1989), where is the total recombination coefficient, and is the recombination coefficient for . The values of and are given in Tab. 5, and their spatial distributions are shown in panels (a) and (b) of Fig. 9.
| R | |||
|---|---|---|---|
| (″) | |||
| 0.00S | |||
| 3.05S | |||
| 6.10S | |||
| 9.15S | |||
| 12.20S | |||
| 15.25S | |||
| 18.30S | |||
| 24.40S | |||
| 30.50S | |||
| 3.05N | |||
| 6.10N | |||
| 9.15N | |||
| 12.20N | |||
| 15.25N | |||
| 18.30N | |||
| 24.40N |
-
luminosity and number of ionising photons computed for the extractions given in col. 1.

The central region of NGC 3607 presents and . We note that the ratio is higher than 1.0 for all sampled regions (panel (a)).
Three hypotheses for the nature of the ionising source in the external regions of NGC 3607 are tested: the gas is ionised by (i) an H ii region, (ii) hot, post-AGB stars, or (iii) an AGN. They are discussed individually below.
6.1 H ii region
We build an H ii region with a mass distribution that follows the initial mass function of Salpeter (1955), for stellar masses in the range . The model which best reproduces the number of ionising photons measured in the region at is described in Tab. 6. This table provides the distribution of stars for a representative set of spectral type and mass; in the last column we give the number of ionising photons () produced by each star (Dottori 1981). The total number of ionising photons can be computed from . The relation between the number of ionising photons with stellar mass can be approximated as (Rickes et al. 2008). Given the above, the adopted model H ii region produces , which is comparable to the observed value. However, with more than 20 O stars, such an H ii region would be very young, massive, and luminous enough to have already been detected in previous works. Besides, the stellar population synthesis (Sect. 4) does not indicate significant, recent star formation in the sampled regions of NGC 3607.
| Spectral type | M | Number | |
|---|---|---|---|
| () | (stars) | () | |
-
Col. 2: representative stellar mass; Col. 3: number of stars; Col. 3: number of ionising photons.
6.2 Post-AGB stars
The number of ionising photons emitted by a typical Post-AGB star is (Binette, 1994). Thus, about such stars would be necessary to produce the amount of photons measured in each extracted region. Consequently, for an extraction area of (Sect. 2), the projected surface-density of post-AGB stars would be about , a number prohibitively high (e.g. Binette 1994). Besides, the spatial profiles of and H extracted along the slit (Fig. 8), show a ratio for most regions, especially towards the central parts. However, the relatively high emission-line ratios measured in NGC 3607, especially in the central region, are not consistent with ionisation models based on hot old stars in elliptical galaxies (e.g. Binette 1994). The models of Binette (1994) do not reproduce as well the observed large ratios and . Instead, high values for these emission-line ratios are typical of AGNs.
6.3 Active nucleus
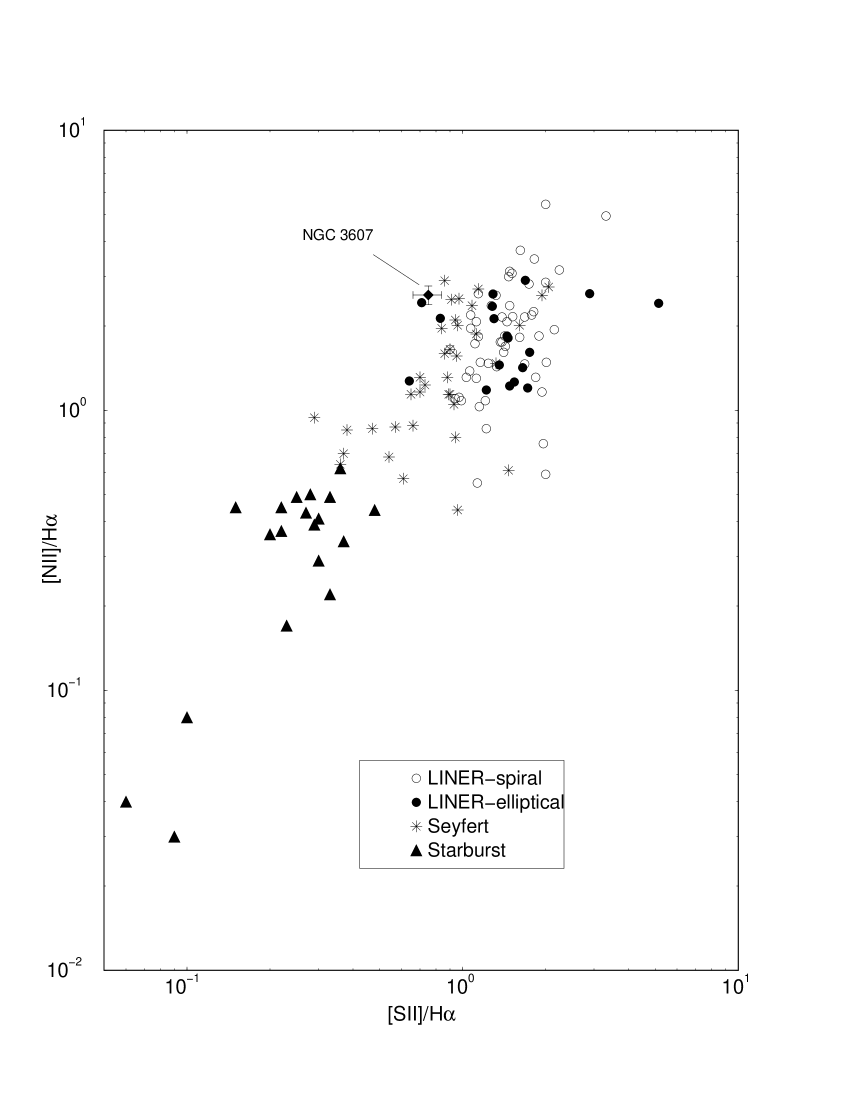
The arguments that follow from the above discussion suggest that NGC 3607 hosts an AGN. We test this hypothesis with the emission-line diagnostic-diagram involving the ratios and . For comparison we take the equivalent values measured in a sample of nearby galaxies that host a low-luminosity () active nucleus (Ho et al. 1997). To minimise the possibility of uncertain classification, we restrict the analysis to the galaxies in Ho et al. (1997) sample with unambiguous classification as LINER in spiral, LINER in elliptical, Seyfert or Starburst. The restricted sample contains 128 galaxies (see Rickes et al. 2008).
The results are shown in Fig. 10, where it can be seen that the values measured in NGC 3607 occur in the locus occupied predominantly by LINERs and Seyferts. However, the lack of a broad component in (Fig. 2) strongly favours the LINER interpretation. Together with the stellar population synthesis, this result suggests that the main source of gas ionisation in NGC 3607 is non-thermal, produced by a low-luminosity active nucleus. The lower ratios of and towards the external parts can be accounted for by both a LINER and hot stars.
Finally, in Fig. 11 we test whether the gradients in emission and absorption-line features are somehow related. We work with the EW of Mg (Table 2) and the flux (Table 4) distributions, taking the average values of the North and South extractions (the 2 outermost points have been averaged out to minimise error bars). Within the uncertainties, both distributions appear to correlate for , which can be accounted for the steep and monotonic flux increase towards the central region (Fig. 9) together with the overall negative Mg2 gradient (Fig. 3). While the EW of Mg2 keeps dropping for , the flux oscillates abruptly, probably because of the relative contribution of the hot, old stars to the gas ionisation, superimposed on the severely diluted LINER flux at such large radii. This combination of effects is reflected on the mild anti-correlation of both properties (lower portion of Fig. 11). It is also consistent with the low ratios of and (Fig. 8), and the low Q(H) (Fig. 9), measured for large radii, all accounted for by hot, old stars.

Similar results would be obtained with other absorption features, since they also present similar gradients (Fig. 3).
7 Discussion and concluding remarks
Individual galaxies can provide important pieces of evidence that may ultimately lead to a better understanding of the formation and evolution processes of the early-type galaxies as a class. Following the methods previously employed in the analysis of other early-type galaxies (e.g. Rickes et al. 2004; Rickes et al. 2004), in the present paper we focus on the lenticular galaxy NGC 3607.
We investigate the stellar population, metallicity distribution and ionised gas of NGC 3607 by means of long-slit spectroscopy (covering the wavelength range Å) and a previously tested stellar population synthesis algorithm. The stellar population synthesis shows different star formation episodes with ages distributed within 1-13 Gyr.
The radial distribution of the equivalent widths measured for the available metallic absorption features in this galaxy consistently present a negative gradient, which indicates an overabundance of Fe, Mg, Na and TiO in the central parts with respect to the external regions. Also, the central region of NGC 3607 presents a deficiency of alpha elements and higher metallicity than the external parts, which suggests different star-formation histories in both regions. With respect to the emission gas, the line ratios and consistently indicate the presence of a LINER at the centre of NGC 3607.
We found that the index correlates both with and , which suggests that Mg and Fe probably underwent the same enrichment process in NGC 3607. Also, the flux distribution correlates with the radial profile of metallic features, in the sense that they both decrease from the galaxy centre to . The correlation breaks for larger radii, especially because, while the metallic feature profiles keep dropping, gas ionisation due to hot, old stars adds to the diluted LINER flux. Considering the relation between galaxy dynamical mass and the gradient slope (Figure 11 of Carollo et al. 1993), the parameters computed for NGC 3607 in the present work suggest that this galaxy may have underwent important merger events in the past.
Acknowledgements
We acknowledge important suggestions presented by the referee. We thank the Brazilian agency CNPq for partial support of this work. This research has made use of the NASA/IPAC Extragalactic Database (NED) which is operated by the Jet Propulsion Laboratory, California Institute of Technology, under contract with the National Aeronautics and Space Administration.
References
- Annibali et al. (2007) Annibali, F., Bressan, A., Rampazzo, R., Zeilinger, W.W. & Danese, L. 2007, A&A, 463, 455
- Arimoto & Yoshii (1987) Arimoto, N. & Yoshii, Y. 1987, A&A, 23, 38
- van den Bergh (1990) van den Bergh, S. 1990, MNRAS, 31, 153
- Bica & Alloin (1986) Bica, E. & Alloin, D., 1986, A&AS, 66, 171
- Bica (1988) Bica, E. 1988, A&A, 195, 79
- Binette (1994) Binette, L. Magris, C. G. Stasinska, G. & Bruzual, A.G., 1994, A&A, 292, 13
- Bruzual & Charlot (2003) Bruzual, G. & Charlot, S. 2003, MNRAS, 344, 1000
- Buzzoni et al. (1992) Buzzoni, A., Mantegazza, L. & Gariboldi, G. 1994, AJ., 107, 513
- Caon et al. (2000) Caon, N., Macchetto, D. & Pastoriza, M. 2000, ApJS, 127, 39
- Carollo et al. (1993) Carollo, C.M., Danziger, I.J. & Buson, L. 1993, MNRAS, 265, 553
- Carollo & Danziger (1994) Carollo, C.M. & Danziger, I.J. 1994, MNRAS, 270, 523
- Davis et al. (1993) Davies, R.L., Sadler, E.M. & Peletier, R.F. 1993, MNRAS, 262, 650
- Dottori (1981) Dottori, H.A. 1981, ApSS, 80, 267
- Faber et al. (1985) Faber, S.M., Friel, E.D., Burstein, D. & Gaskell, C.M. 1985, ApJS, 57, 711
- Ferguson & Sandage (1990) Ferguson, H. & Sandage, A. 1990, AJ, 100, 1
- Ferrari et al. (1999) Ferrari, F., Pastoriza, M.G., Macchetto, F. & Caon, N. 1999, A&A, 136, 269
- Fisher & Illingworth (1995) Fisher, D., Franx, M. & Illingworth, G. 1995, ApJ, 448, 119
- Fisher & Illingworth (1996) Fisher, D., Franx, M. & Illingworth, G. 1996, ApJ, 459, 110
- Gonzáles (1993) Gonzáles J.J. 1993, Ph.D. thesis, Univ. California, Santa Cruz
- Idiart et al. (2003) Idiart, T.P., Michard, R. & de Freitas Pacheco, J.A., 2003, A&A, 398, 949
- Ho et al. (1997) Ho, L.C., Filippenko, A.V. & Sargent, W.L.W., 1997, ApJS, 112, 315
- Larson (1974) Larson, Richard B., 1974, MNRAS, 166, 585
- Maia et al. (1989) Maia, M.A.G., Da Costa, L.N. & Latham, D.W., 1989, AJSS, 69, 809
- Macchetto et al. (1996) Macchetto, F., Pastoriza, M.G., Caon, N., Sparks, W.B., Giavalisco, M., Bender, R. & Capaccioli, M. 1996, ApJS, 120, 463
- Matsushita et al. (2000) Matsushita, K., Ohashi, T. & Makishima, K., 2000, PASJ, 52, 685
- Ogando et al. (2005) Ogando, R.L.C., Maia, M.A.G., Chiappini, C., Pellegrini, P.S., Schiavon, R.P., da Costa, L.N. 2005, ApJ, 61, 64
- Osterbrock (1989) Osterbrock, D.E. 1989, in Astrophysics of Gaseous Nebulae and Active Galactic Nuclei, University Science Books
- Phillips et al. (1986) Phillips, M.M., Jenkins, C.R., Dopita, M.A., Sadler, E.M. & Binette, L., 1986, AJ, 91, 1062
- Pipino, Matteucci & Chiappini (2006) Pipino, A., Matteucci, F. & Chiappini, C., 2006, ApJ, 638, 739
- Poveda & Allen (1975) Poveda, A. & Allen, C. 1975, ApJ, 200, 42
- Rickes et al. (2004) Rickes, M.G,, Pastoriza, M.G. & Bonatto, C., 2004 A&A, 419, 449
- Rickes et al. (2008) Rickes, M.G,, Pastoriza, M.G. & Bonatto, C., 2008, MNRAS, 384, 1427
- Salpeter (1955) Salpeter, E.F. 1979, ApJ, 121, 161
- Terashima et al. (2002) Terashima, Y., Iyomoto, N., Ho, L.C. & Ptak, A.F., 2002, ApJS, 139, 1
- Thomas et al. (2003) Thomas, D., Maraston, C. & Bender, R., 2003, MNRAS, 339, 897
- Worthey, Faber & Gonzáles (1992) Worthey, G., Faber, S.M. & Gonzáles, J.J . 1992, ApJS, 398, 69