11email: veronique.buat@oamp.fr,denis.burgarella@oamp.fr,elodie.giovannoli@oamp.fr 22institutetext: Institute for Advanced Research, Nagoya University
22email: takeuchi@iar.nagoya-u.ac.jp 33institutetext: Division of Particle and Astrophysical Sciences, Nagoya University
33email: murata.katsuhiro@g.mbox.nagoya-u.ac.jp
The infrared emission of ultraviolet selected galaxies from to
Abstract
Aims. We want to study the IR (m) emission of samples of galaxies selected in their rest-frame UV in a very homogeneous way (wavelength and luminosity) from to : comparing their UV and IR rest-frame emissions will allow us to study the evolution of dust attenuation with as well as to check if a UV selection is able to track all the star formation. This UV selection will also be compared to a sample of Lyman Break Galaxies selected at .
Methods. We select galaxies in UV (1500–1800 Å) rest-frame at , and together with a sample of Lyman Break Galaxies at , the samples are built in order to sample the same range of luminosity at any redshift. The UV rest-frame data come from GALEX for and the -band of the EIS survey (at ). The UV data are combined to the IRAS 60 m observations at and the SPITZER data at m for sources. The evolution of the IR and UV luminosities with is analysed for individual galaxies as well as in terms of luminosity functions.
Results. The ratio is used to measure dust attenuation. This ratio does not exhibit a strong evolution with for the bulk of our sample galaxies but some trends are found for galaxies with a strong dust attenuation and for UV luminous sources: galaxies with are more frequent at than at and the largest values of are found for UV faint objects; conversely the most luminous galaxies of our samples (), detected at , exhibit a lower dust attenuation than the fainter ones. increases with the rest-frame luminosity of the galaxies at all the redshifts considered and shows a residual anti-correlation with . The most massive and UV luminous galaxies exhibit quite large specific star formation rates. Lyman Break Galaxies exhibit systematically lower dust attenuation than UV selected galaxies of same luminosity but similar specific star formation rates.
The analysis of the UV+IR luminosity functions leads to the conclusion that up to most of the star formation activity of UV selected galaxies is emitted in IR. Whereas we are able to retrieve all the star formation from our UV selection at , at we miss a large fraction of galaxies more luminous than . The effect is found larger for Lyman Break Galaxies.
Key Words.:
galaxies: evolution-galaxies: stellar content-infrared: galaxies-ultraviolet: galaxies1 Introduction
The measure of the star formation rate at various redshifts is one of the most spread out diagnostic to quantify the evolution of the galaxies, individually or for the population as a whole. The best way to perform such an analysis is to rely on galaxy samples selected in the same way at different redshift. As long as star forming galaxies have to be selected a UV selection is theoretically very efficient. Nevertheless, the situation is made difficult because of dust attenuation. Indeed dust attenuation affects the measure of the star formation rate derived from the observed UV emission and a correction (sometimes quite large) must be applied to the observed UV emission before translating it into SFR. However the effects of dust obscuration may be even more dramatic if they lead to a loss of galaxies which might not be detected at all in UV surveys: in such a case a correction for dust attenuation of the total light observed in UV would not be sufficient to retrieve the whole star formation at a given redshift.
The UV (1500–1800 Å) to IR (8–1000 m) luminosity ratio is now commonly used as a robust proxy for dust attenuation. The GALEX all sky survey associated with the IRAS catalogues has produced large samples of nearby galaxies observed at both wavelengths and used to study the variation of with the total luminosity (i.e. the total SFR of galaxies).
has been found to increase with (Martin et al., 2005; Buat et al., 2007). The same relation holds for galaxies selected either in UV or in IR (Buat et al., 2007).
This confirms the general increase of dust attenuation with the luminosity of the galaxies already reported (e.g. Hopkins et al., 2001; Moustakas et al., 2006).
Such a relation between total luminosity and dust attenuation in galaxies is useful to correct for systematic effects of dust attenuation in galaxy surveys. It is important to check if this relation still holds at higher . Several studies have been devoted to this issue. Contrary to what is found in the nearby universe, it appears that the result depends on the way galaxies are selected. IR selected galaxies at intermediate redshift () seem to follow the mean trends found at between and (Choi et al., 2006; Xu et al., 2007; Zheng et al., 2006). Buat et al. (2007) reported only a slight decrease of dust attenuation ( mag) for luminous IR galaxies (LIRGs) at as compared to a similar sample of galaxies at .
When galaxies are selected in UV/optical the situation is quite different: it has been reported a strong decrease of
for a given total as compared to what is
found at (Burgarella et al., 2006, 2007; Reddy et al., 2008).
The origin of this discrepancy is not clear. Are the properties of galaxies changing with and/or do we sample
very different galaxy populations when selecting in UV or in IR?
In the nearby universe Buat et al. (2007) have shown that a UV or an IR selection leads to similar results except for
intrinsically very luminous galaxies which are under-represented in the UV samples. Such objects are
rare at but because of the evolution of the luminosity functions with we might expect a different
situation at higher .
In order to answer to these questions, we gather here several samples of UV selected galaxies from
to selected in a very homogeneous way.
We also consider a sample of Lyman Break Galaxies (LBGs) selected at
to be compared to our pure UV selections.
We add IR fluxes (when available) for all the galaxies of these samples. With these data we want to study the evolution with of the IR emission mainly through the study of the ratio and to measure the total star formation activity by combining IR and UV emissions. The reliability of UV selected galaxies to trace all the star formation will be discussed through the analysis of bolometric () luminosity functions.
Throughout the paper we will assume , and . All the magnitudes are given in the AB system except for the R magnitude from the COMBO-17 survey (section 2.1). The luminosities are defined as and expressed in solar units assuming
2 The galaxy samples
2.1 The UV selected samples
The samples must be purely UV selected. As a consequence we mostly rely on the GALEX survey for
redshift lower than 1.
At , we take the IRAS/GALEX sample built by Buat et al. (2007).
This sample consists of galaxies selected in the GALEX FUV band (1530 Å) and with .
It is a flux limited sample and the luminosity function has been built down to .
The FUV wavelength will be taken as the reference wavelength for the samples at higher ,
and quoted as UV throughout the paper.
At higher , our samples are extracted from the GALEX deep observations of the CDFS. GALEX (Morrissey et al., 2005) observed this field in both the FUV (1530 Å) and the NUV (2310 Å) as part of its deep imaging survey. In order to add IR data to the galaxy sample we restrict our study to the sub-field covered by SPITZER/MIPS observations as part of the GOODS key program (e.g. Elbaz et al., 2007).
The sample at was already used by Buat et al. (2008), at this redshift the NUV band of GALEX at 2310 Å corresponds to the FUV rest frame of the galaxies. This sample is thus made of galaxies selected in NUV and with a redshift comprised between 0.6 and 0.8. Redshifts come from the COMBO-17 survey of the field (Wolf et al., 2004). The reduction of the data and the cross-identification with the COMBO-17 sources is also described in Burgarella et al. (2006). For the brightest isolated sources of the field we perform a comparison between the fluxes given by the GALEX pipeline, aperture photometry measurements and fluxes obtained by PSF fitting with DAOPHOT. From this comparison we conclude that the fluxes given by DAOPHOT and previously used might be slightly over-estimated by 0.2 mag. Although it is not clear if this shift is reliable for crowded objects we decided to apply the correction to all the UV data in the CDFS field: mag. This systematic correction remains very small (of the order of the error) and does not imply any modification of our previous results. Whereas the completeness of the NUV data at a level of 80 % is obtained for mag, we truncate the sample at mag in order that more than 80 % of the GALEX sources are identified in COMBO-17 with mag. This limit ensures a redshift accuracy better than 10 (Wolf et al., 2004). We also restrict the final sample to objects with a single counterpart in COMBO-17 within 2 arcsec (i.e. 90 % of the UV sources). 300 galaxies are thus selected. The limit of mag corresponds to at . 44 % (131/300) of these sources are detected at 24 m. For the undetected ones, we adopt an upper limit at 0.025 mJy (Buat et al., 2008).
At we must build a new sample. The NUV band of GALEX corresponds to 1155 Å in the rest frame of the galaxies. Downward 1200 Å the spectral energy distribution of galaxies is poorly known and the few available observations have shown that the shape of the spectral energy distribution (SED) may vary a lot from galaxy to galaxy (Buat et al., 2002; Leitherer et al., 2002): the power-law model valid for Å cannot be safely used at shorter wavelengths. To avoid this difficulty we perform a selection. We again work in the CDFS/GOODS field and -band observations have been performed as part of the EIS survey (Arnouts et al., 2001). We have cross-correlated the selected catalogue with the COMBO-17 sample with a tolerance radius of 1 arcsec. Redshifts are from COMBO-17+4 (Tapken, private communication) that provide safe redshifts, especially at in the GOODS-South field by combining COMBO-17 filters with three near infrared bands in ISAAC JHK bands. 69 % of the sources are identified uniquely down to mag. We cut the sample at mag which corresponds to 80 % of the sources identified in COMBO-17 with a single counterpart. The photometric redshifts from COMBO-17 are secure only for galaxies with mag (in the Johnson system). 96 % of our galaxies fill this condition. We then select galaxies in the redshift bin 0.8–1.2 which results in a sample of 316 galaxies, at this redshift the -band corresponds to Å in the galaxy rest-frame () when our reference wavelength is 1530 Å. Because of the uncertainties about the shape of the UV SEDs we prefer to avoid any interpolation between the NUV and observed fluxes and keep the uncorrected data. We can estimate the uncertainty due to the shift of the rest-frame wavelengths from 1800 to 1530 Å by assuming a power-law for the continuum between these two wavelength, for reasonable values of the power-law valid for a UV selection ( with ) the error is at most 20 %. The limiting magnitude mag corresponds to at . As for the sample at , the 24 m data from SPITZER/MIPS were cross-correlated to the sources identified in COMBO-17 within a tolerance radius of 2 arcsec (Buat et al., 2008). 207 out of the 316 galaxies are detected at 24 m. For the undetected ones, we again adopt an upper limit at 0.025 mJy (Buat et al., 2008).
The aim of this paper is to determine if a UV selection is able to track all the star formation. The comparison of the IR and UV emissions will allow us to study star formation and dust attenuation affecting newly formed stars. In this context quasars and active galaxies are excluded from all our samples. We exclude objects classified as QSO/Seyfert1 in the Combo-17 classification (2 objects at and 4 at ). We have also cross-correlated our galaxy sample with the X ray sources observed by CHANDRA in the field (Bauer et al., 2004) and we discard 22 sources at and 19 at as X-ray emitters. As a final check we can compare mid-IR IRAC colours as suggested by Stern et al. (2005) to determine if our samples were still contaminated by AGNs. 1 and 4 of the samples at z=0.7 and 1 respectively were found in the AGN area close to the boundary where the contamination by star forming sources is significant. We choose not to exclude these remaining sources.
2.2 Lyman Break Galaxies at
This paper presents a sample of galaxies in the CDFS-GOODS field selected as being LBGs with a similar UV selection as that used in previous works (Burgarella et al. (2006), Burgarella et al. (2007) and Burgarella et al. (2009)). The primary selection was performed in GALEX NUV band down to mag, as discussed in Section 2.1 this limit ensures us that 80 % of the sources are identified with a reliable redshift in COMBO-17. Then we look up into the GALEX FUV band for counterparts down to mag (80 % completeness on the GALEX detections) . To be selected as a Lyman Break Galaxy, an object must comply with the two criteria: 1) its redshift must be in the range and 2) its UV colour mag. Indeed, some NUV faint objects that would be classified as LBGs if the FUV limiting magnitudes objects had reached down to mag are not selected as LBGs in the present sample.
This selection provides 117 LBGs with a unique counterpart in the optical out of which 58 are detected at 24 m, for the other ones an upper limit of 0.025 mJy is adopted as for the other samples. In addition, we have 33 LBGs with two counterparts in the optical out of which 20 are detected at m.
As for the sample, the UV luminosity is based on the observed -band. At the selection of galaxies on their Lyman break focuses on galaxies with a high intrinsic UV continuum and a large intrinsic break since the role of the intergalactic medium on the amplitude of the break is known to be low at this redshift (e.g. Malkan et al., 2003). The situation is different for LBGs selected at higher z whose break is dominated by the effect of the intergalactic medium. Nevertheless Burgarella et al. (2007) found similar spectral energy disributions for LBGs at and .
2.3 Estimating the IR luminosities
The aim of the paper is to compare the IR and UV emissions of the galaxies from to . At , the IR (8–1000 m) emission is estimated using the calibration of Dale et al. (2001) based on the 60 and 100 m fluxes from IRAS (Buat et al., 2005). At higher , we must use the emission at m to estimate the total far infrared emission. At (resp 1) the observed m corresponds to rest-frame m (resp m). The extrapolation from the mid infrared (MIR) emission to the total IR one is known to be quite difficult but up to we still remain in a wavelength range observed in the nearby universe by either IRAS or ISO. As a consequence several calibrations and IR SED templates were proposed in the literature based on observations of nearby galaxies by IRAS and/or ISO (e.g. Chary & Elbaz, 2001; Dale & Helou, 2002; Takeuchi et al., 2005a). The recent observations of SPITZER have stressed the large variety of IR spectral energy distributions in nearby galaxies (Dale et al., 2005; Rieke et al., 2008), these observations imply large uncertainties in the extrapolation from a monochromatic flux to the total IR emission. To illustrate this uncertainty, we can compare several calibrations of the monochromatic luminosities at 12 and 15 m into bolometric IR luminosities. We consider the calibrations of Chary & Elbaz (2001) and Dale & Helou (2002) based on templates built by combining IRAS and ISO data on small samples of galaxies. The Dale & Helou (2002) templates are calibrated in total IR luminosities following the method of Marcillac et al. (2006)) and we obtain the following relations between total and monochromatic luminosities:
| (1) |
| (2) |
We also consider the calibrations of Takeuchi et al. (2005a) (hereafter TBI05) based on a statistical analysis of all the galaxies observed in the four bands of IRAS in the Point Source Catalog. The relation obtained by TBI05 at m for local galaxies (i.e. when we observe a galaxy at , its emitted wavelength corresponds to m at ) is slightly modified to take into account a slight non-linearity for the most luminous objects:
| (3) |
whereas at m, we used the original relation
| (4) |
at , since the non linearity is not significant.
We have checked that the estimated s do not differ by more
than 5% as compared to the old calibration presented in TBI05.
We also add to the comparison the recent calibration obtained by Rieke et al. (2008) at 12 m and based on a compilation of SPITZER data with a special emphasis on LIRGs and ULIRGs. The comparison between all these calibrations is shown in Fig. 1. In order to highlight the differences we have normalized the relations to those of DH02. The rms dispersion is overplotted for each relation.
At m (corresponding to the sample at in the present work) the calibrations
of Chary & Elbaz (2001) (hereafter CE01) and Dale & Helou (2002) (hereafter DH02) are found very similar:
the calibration of TBI05 leads to a slightly lower by about 0.1 dex than those
obtained with the CE01 relation.
This difference is much smaller than the intrinsic dispersion of the correlations and Buat et al. (2007) have
found that both calibrations led to very similar results about dust attenuation for a sample of LIRGs.
However, at m () the discrepancy is found larger between the calibrations of
CE01 and DH02 on the one hand (again very similar) and that of TBI05 on the other hand:
it reaches 0.2 dex for galaxies with the TBI05 relation giving
systematically lower IR luminosities.Nevertheless these relations calibrated at remain marginally consistent within one rms
and we expect at least the same amount of dispersion
at higher redshift.
The relation proposed by Rieke et al. (2008) for appears much steeper than the other ones leading to larger IR luminosities
especially for intrinsically luminous objects.
Rieke et al. (2008) have gathered SEDs of nearby LIRGs and ULIRGs together with the Dale & Helou (2002)
templates applied to the SINGS sample for galaxies of intermediate luminosity.
Therefore we can infer that the discrepancy found between the Dale & Helou (2002) and Rieke et al. (2008) calibrations
is due to the introduction of these LIRGs and ULIRGs.
Once again these differences illustrate the uncertainty inherent to these calibrations.
At , 26 of our galaxies detected at 24 m and 11 of the whole sample are LIRGs-ULIRGs; at these fractions reach 34 of the galaxies detected at 24 m and 22 of the whole sample. Although these fractions are significant, LIRGs-ULIRGs do not dominate our sample and we will not use the relation of
Rieke et al. (2008).
We perform all the analyses reported in this work for the two calibrations TBI05 and CE01.
The plots are qualitatively similar and they will be presented with the TBI05 calibration.
When quantitative evaluations are made (regressions or percentages) they will be given for both calibrations.


3 Variation of
As already underlined in the introduction is a robust indicator of dust attenuation as long as we are dealing with galaxies forming stars actively. Reddy et al. (2008) and Burgarella et al. (2009) have reported a clear decrease of this ratio for LBGs at and BM/BX galaxies at for a constant luminosity. Such a decrease of dust attenuation as redshift increases may have large consequences on the search of high redshift galaxies and the measure of their star formation rate. Here we re-investigate this question with our homogeneous samples selected in a similar way at , and .
3.1 versus
As detailed in the previous section the samples are all selected in UV rest-frame at wavelengths sufficiently
close to avoid -corrections.
Nevertheless, the range of luminosities observed in each sample is different.
Before any comparison we must cut the samples at the same luminosity. The most stringent limit is for the
-selected sample. With a cut at mag we are only able to observe galaxies with
at .
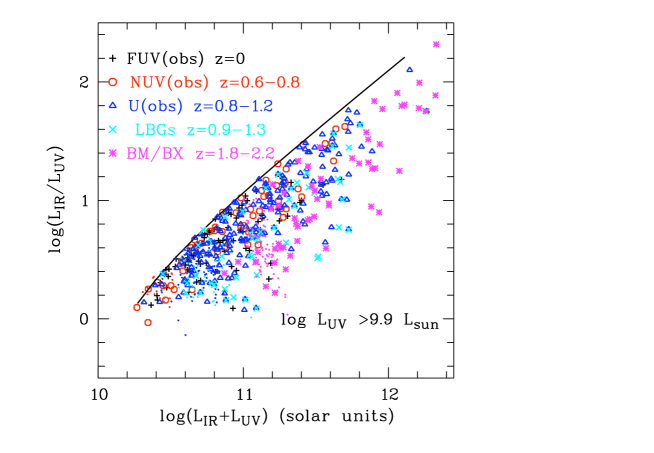
In Fig. 2 are reported all the galaxy samples considered in this work and truncated at
. A trend with redshift seems to be present with galaxies shifted toward
the right when increases. The mean values found for in the luminosity bin 10.8-11.3 are at and for the LBG sample respectively.
Although no clear trend is confirmed from z=0 to 1 given the large dispersion of the distribution, for a given , dust attenuation as traced by
is lower for LBGs at .
We have also over plotted the sample of BM/BX galaxies of Reddy et al. (2006) at z=2. The IR luminosities are estimated from the 24 m fluxes using the calibration of Caputi et al. (2007) as in Reddy et al. (2008) and the UV luminosity is calculated with the G band fluxes. Given the differences between these estimates and those performed for the samples studied in this work we do not make a quantitative comparison. Anyway the BM/BX galaxies continue the trend reported for LBGs at .
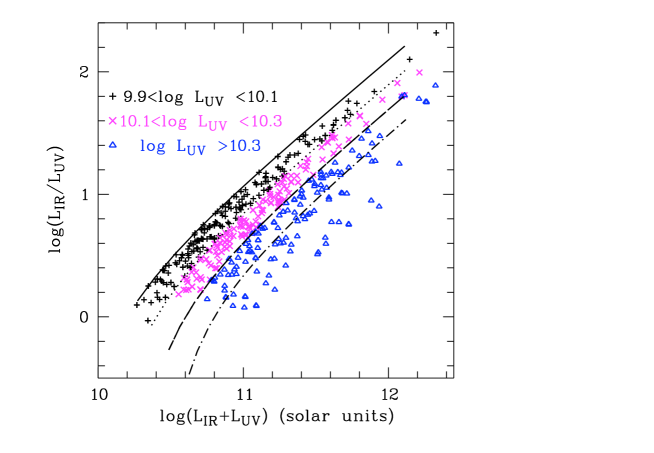
However the interpretation of this plot is made difficult by the fact that the quantities reported on the axes are both a combination of and . This is illustrated in Fig. 3 where the galaxies are considered according to their UV luminosity, whatever their redshift is. The lines represent the locus of galaxies with a given . The locus of the galaxies in this plot is strongly constrained by their UV luminosity: when varies, galaxies with a given move along lines like those over-plotted on the diagram. Therefore the shift seen in Fig. 2 is due to the presence of more luminous galaxies in UV when increases as expected from the evolution of the UV luminosity function (Arnouts et al., 2005; Takeuchi et al., 2005b). The variation of dust attenuation as traced by can only be quantified along these lines of constant .
3.2 versus
From the above analysis, it is clear that we must avoid to combine IR and UV luminosities on both
axes since the resulting plot is too strongly constrained.
We can analyse the variation of as a function of alone.
In such a plot we are not affected by volume effects since all the samples are selected in UV.
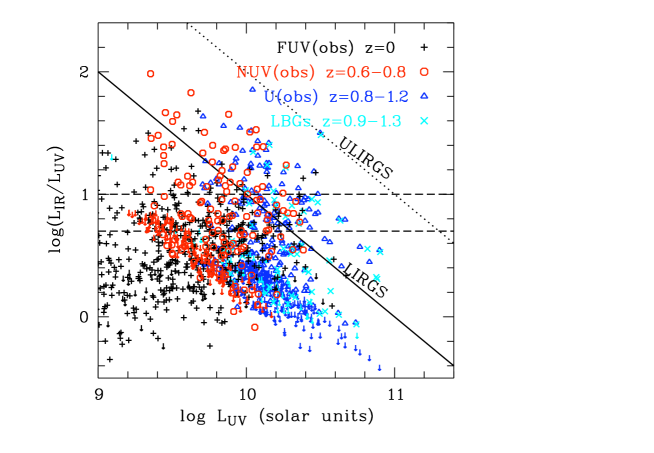
In Fig. 4 is reported the variation of as a function of .
The loci of LIRGs () and ULIRGs () are
also indicated.
This time the general shape of this diagram is strongly constrained by the upper limits at 24 m
which hamper any discussion about the low values of .
The upper envelope of the distribution shows a trend: as increases the maximum value of
decreases from to ( to for the CE01 calibration).
A quantitative interpretation of this varying upper limit is difficult because of the statistics:
since the total number of galaxies per luminosity bin decreases as the UV luminosity increases,
we expect less extreme cases even with a similar parent distribution for .
Anyway the most UV luminous galaxies exhibit a very moderate dust attenuation (
corresponds to mag with the calibration of Buat et al. (2005)) and the galaxies with
the largest dust attenuation are the faintest ones in UV.
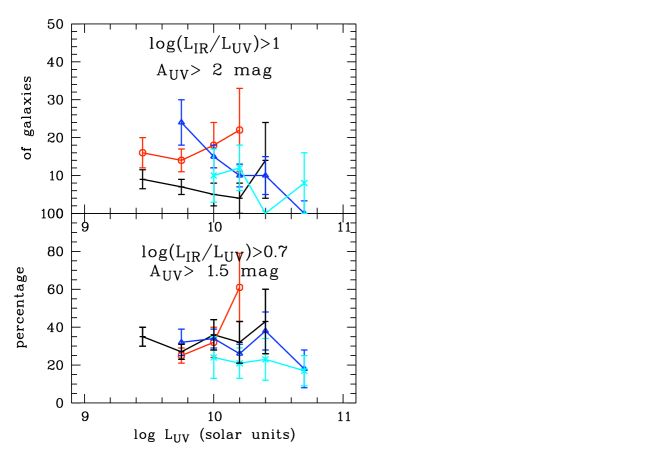
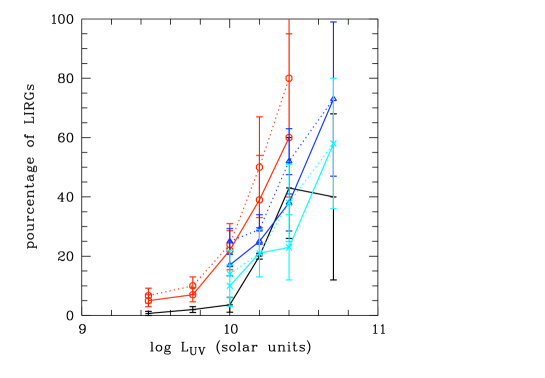
In order to go further in the interpretation of Fig. 4 we have calculated the fraction of galaxies with larger than 0.7 and 1 (corresponding to and 2 mag respectively (Buat et al., 2005)) as well as the fraction of LIRGs for each redshift, as a function of . The cuts adopted for (0.7 and 1) are chosen to be not affected by the non detections at 24 m in the high redshift samples (cf the upper limits reported in Fig. 4) . If the CE01 calibration is used instead of the TBI05 one the cuts in have to be increased of 0.1 dex (i.e., 0.8 and 1.1) .
The results are reported in Fig. 5 and 6. At all the galaxies are detected in IR and the distribution of is well described by a Gaussian with a mean value of 0.55 dex and a standard deviation of 0.3 dex. If we first consider the fraction of galaxies with , this fraction is not found to be very dependent on the redshift or the UV luminosity at least up to (there is only a ”discrepant” point at but with a very large error bar). For the highest observed UV luminosities (), only present in the samples at , the fraction of galaxies with decreases both for the selection and the LBGs. The LBG sample has a slightly lower fraction of galaxies with than that found in the selected sample over the whole range of luminosity.
The fraction of galaxies with highlights galaxies with the largest dust attenuation. This fraction does not exceed for all our samples. Galaxies with such a high extinction seem to be more frequent at than at : the distribution of is found to reach larger values at than at but we must remain cautious because on the uncertainties on the MIR-total IR calibration. As found above , at there is almost no UV luminous galaxy with a large attenuation and the fraction of galaxies with increases toward lower UV luminosities.
The evolution of the fraction of LIRGs is reported in Fig. 6. This fraction increases with the UV luminosity: it is expected even even without any evolution of the distribution. For the UV selected galaxies at , 0.7 and 1, the variations are found similar with a slightly larger fraction of LIRGs for a given UV luminosity at , it is indeed the same effect as noted for galaxies with . The fraction of LIRGs in the LBG sample is systematically lower than that found for the UV selected galaxies at , again leading to the conclusion of a lower dust attenuation for these galaxies.
Reddy et al. (2008) estimated the colour excess distribution of BX galaxies at and LBGs at . They found . Adopting the dust attenuation law of Calzetti et al. (2000) gives mag. As a consequence 50 of BX galaxies and LBGs have mag and if we assume that the distribution of E(B-V) is Gaussian, 30 have mag. Reddy et al. (2008) obtained similar results by an analysis of the distribution. They also found an average dust attenuation which does not vary with the UV rest-frame luminosity.
Therefore dust attenuation in UV selected galaxies at seems to be slightly larger than that found at , the difference being particularly significative for UV luminous galaxies for there is a hint for a lower dust attenuation at . Nevertheless we must remain cautious in our conclusions given the uncertainties in the estimates of dust attenuation and the different methods adopted: IR to UV flux ratio up to based on 12 and 15 m luminosities, UV colours and 8 m luminosities at higher z. These methods are known to give different results at least up to (Burgarella et al., 2007; Elbaz et al., 2007) and the calibration of the 8 m luminosity in total IR luminosity is highly uncertain (Caputi et al., 2007; Burgarella et al., 2009).
3.3 versus
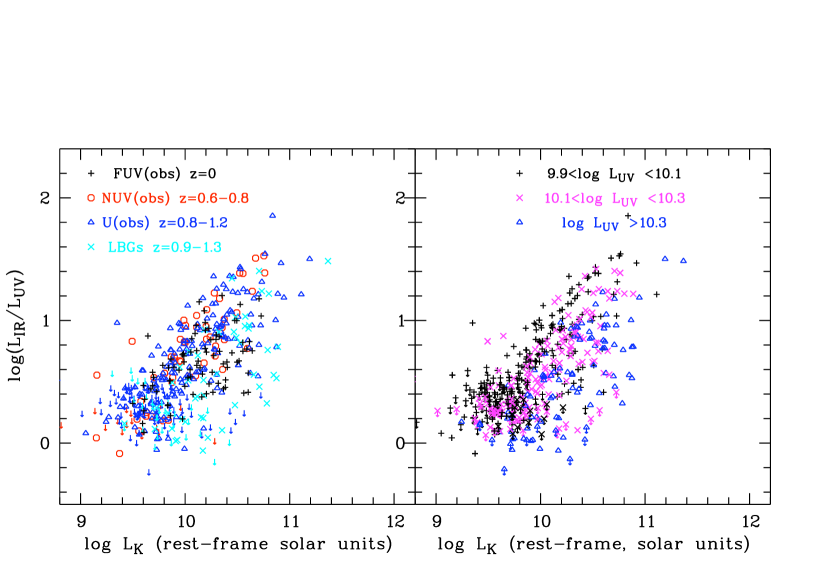
We have seen that it is difficult to interpret the variation of as a function of a quantity also depending on these two luminosities. We can also use a quantity independent of them to avoid such an issue. In this section we will consider the rest-frame luminosity of the galaxies which is a tracer of the stellar mass of galaxies. They are calculated with the IRAC band at 3.6 and 4.5 m which corresponds to rest-frame at and 1 and with 2MASS data at (Buat et al., 2007) In Fig. 7 is reported the variation of as a function of for the different samples and also split in luminosity bins. A net increase of with is found without a clear evolution with for the galaxies selected in UV rest-frame, only LBGs appear to have a lower dust attenuation for a given . When the samples are split according to the UV luminosity of the galaxies it appears in average that the more UV luminous objects exhibit a lower for a given luminosity than UV fainter sources. This is in agreement with what has been found in section 3.2. A linear regression on both and gives
| (5) |
Excluding LBGs from the analysis (since they are less extinguished than UV selected galaxies) leads to a slightly different regression
| (6) |
Using the calibration of Chary & Elbaz (2001) would give
| (7) |
for the whole sample and
| (8) |
when LBGs are excluded.
Martin et al. (2007) and Iglesias-Paramo et al. (2007) also studied the variation of as a function of the stellar mass from to 1 for UV selected galaxies, our results are globally consistent with theirs: the relation between and or exhibit the same steepness, the shift with redshift reported in these studies is of similar amplitude to the one we find as a function of . The main differences between these previous analyses and ours is that we select galaxies with the same limit in UV luminosity whereas the other studies were based on magnitude limited samples with a different limit in luminosity when varies. Our approach allows us to emphasise differences of behaviour as a function of the luminosity of the galaxies and this effect seems to be at the origin of the redshift evolution reported earlier.
4 Star formation activity
Dust attenuation has been found to be related to the observed UV and luminosity of our UV selected galaxies, LBGs exhibiting more extreme behaviour. Is the strength of the star formation activity also linked to the UV luminosity? Do LBGs exhibit different star formation activity than UV selected galaxies? The star formation activity can be quantified by the specific star formation rate defined as the current star formation rate divided by the stellar mass of the galaxies. We can estimate this quantity with our data sets. We calculate the total SFR by adding the SFR from the IR and the UV (observed) luminosities (Iglesias-Paramo et al., 2006; Buat et al., 2008). We adopt a Salpeter IMF and the formulae of Iglesias-Paramo et al. (2006):
| (9) | |||
| (10) |
The total SFR is expressed as except at where the contribution of the dust emission not related to the star formation is estimated to be 30 % (Iglesias-Paramo et al., 2006). The stellar masses of the galaxies are calculated with the IRAC band at 3.6 and m which corresponds to rest-frame -band at and 1 and with the calibration of Arnouts et al. (2007). At , the calibration of Bell et al. (2003) is used as discussed in Iglesias-Paramo et al. (2006) and Buat et al. (2008). We adopt a Salpeter IMF and check that the extrapolation of the calibration of Arnouts et al. (2007) is consistent with that we adopt at within 30 % (0.1 dex).
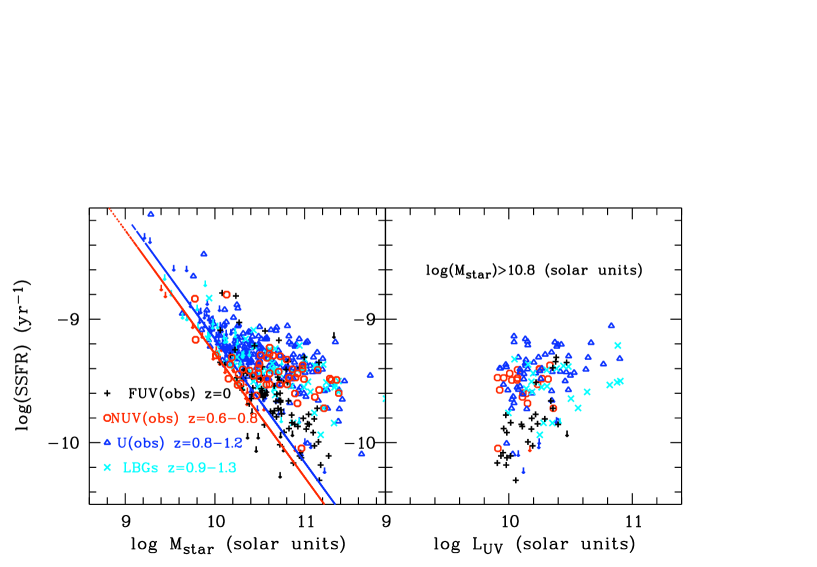
In Fig. 8 is reported the variation of the SSFR as a function of the stellar mass for each sample truncated at . Such a limit combined with the detection limit adopted for the fluxes at m (25 Jy) gives a limit in SFR for and 1 also indicated in Fig. 8. The SSFR at a given stellar mass increases with as reported in both observational and theoretical studies and predicted in scenarios of galaxy evolution. The SSFR also exhibits a flat distribution: it is expected when only star forming galaxies are selected (Elbaz et al., 2007; Buat et al., 2008). The consistency between models and the mean trends found in UV and IR selected samples has been shown to be good up to (Buat et al., 2008) but breaks at (Elbaz et al., 2007). The purpose of this paper is not to perform a comparison between models and observations since we are dealing with only a sub sample of the overall galaxy population: the objects with . We want to compare the properties of these galaxies at different and with LBGs. LBGs and UV selected galaxies seem to experience similar SSFRs at the same redshift. We now focus on the most massive galaxies with for which the detection limits reported in Fig. 8 do not induce a substantial bias. The galaxies of this sub-sample with a moderate UV luminosity () exhibit a large range of SSFRs, the most quiescent objects being found at z=0. Conversely all the most UV luminous objects () exhibit quite large SSFRs. These galaxies experiment high SFRs between 10 and 190 with an average value of : with such a rate they might have formed all their mass in few Gyr.
5 Total UV+IR luminosity functions
Do we miss star forming galaxies in a UV selection up to , and as a consequence are we able to retrieve all the star formation when applying a reliable dust attenuation to galaxies selected in UV rest-frame? To answer these questions, it would be the most direct to construct the luminosity functions (LFs) with total luminosity related to star formation activity, .
5.1 Method
The most important but difficult point of this analysis is how to handle the two variables and at the same time. We proceed a statistical analysis as follows:
- Step 1
-
Since our sample is primarily selected at UV (GALEX FUV at taken as reference (Å), GALEX NUV at and EIS -band at ), we construct univariate UV LFs.
- Step 2
- Step 3
-
We sum up the distribution functions of the total IR luminosity along all the UV luminosity bins.
For Step 1, we used improved versions of two representative LF estimators : -estimator (Schmidt, 1968) and -estimator (Lynden-Bell, 1971) in an optimal manner, explained and examined extensively by Takeuchi et al. (2000) and Takeuchi (2000). We estimated the LFs of NUV-selected sample at z, -band selected sample at , and LBG samples . Since we are interested in the star-forming galaxies, we have omitted known quasars/AGNs from our sample, as already explained in section 2.1. These univariate UV LFs are estimated simply at their primary selection bands for the NUV-selected sample and -band selected sample: we obtain LFs at and for and 1 respectively. As discussed in section 2.1, the NUV and selected samples correspond to rest-frame wavelengths close enough to avoid K-corrections. It is not the case for the LBG sample primarily selected in NUV which corresponds to Å rest-frame. We will go back to this issue in Section 5.2.
In Step 2, we should be careful for a significant number of upper limits at MIPS m. For this, we made use of the Kaplan-Meier estimator which enables us to make use of the information content carried by the upper limits, originally developed in the field of lifetime data analysis (Kaplan & Meier, 1958). Another desirable property of the Kaplan-Meier estimator is that we can obtain its variance in an analytic form. Formulations, derivations and some important properties will be discussed and explained elsewhere (Takeuchi et al. 2009, in preparation).
In Step 3, statistical errors are summed up in quadrature, i.e., the variance from the primary univariate UV LF and that from the IR luminosity distributions. However, we did not include the variance caused by the density inhomogeneity of galaxies (often referred to as the cosmic variance). We will discuss this issue in Section 5.2.
5.2 UV luminosity functions
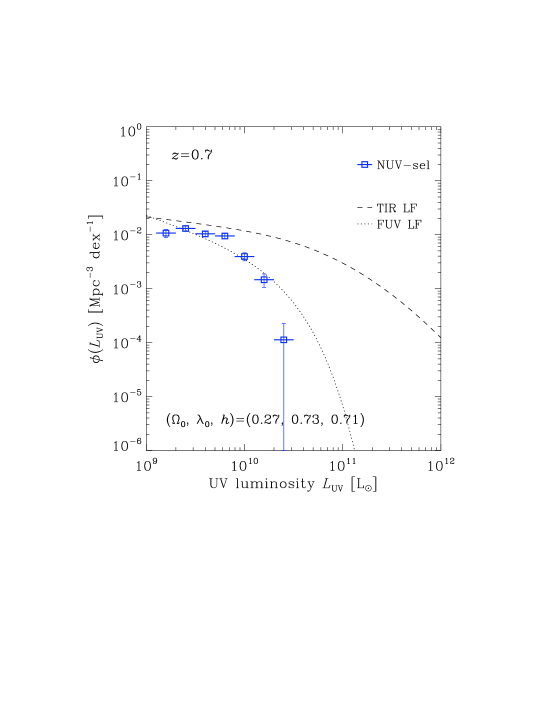
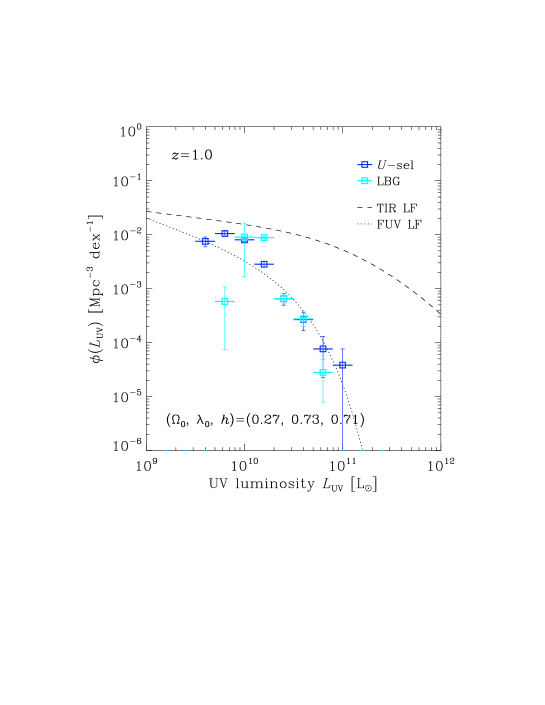
We show the UV LFs for the samples at and 1 in Figure 9. Since both and -estimates agree very well with each other, we only show the latter in this paper. We also estimated the UV LF of LBGs, but it is not obtained by the same method as the other two, since the primary selection is done at NUV (for the redshift range of , this corresponds to 1100 Å). Then, we must use a bivariate method exactly the same as described in above Step 2: first we construct a univariate UV LF at 1100 Å, and construct distributions of UV luminosities at each bin from the -band data ( Å at the rest-frame), and sum them up along the UV luminosity bin. The obtained UV LF of LBGs is presented in cyan symbols in Figure 9.
Roughly speaking, we observe that the UV LFs at redshift ranges of and agree with those of Arnouts et al. (2005). This shows that our selection is appropriate for the purpose of this study. We may see that there are some discrepancies between the shapes of our UV LFs and those of Arnouts et al. (2005). The difference may be attributed to the difference in selection of galaxies, e.g., Arnouts et al. (2005) performed a NUV selection and -corrected the flux, unlike our selection at -band at without -correction. The different way photometry has been performed can also be at the origin of a subtle difference: the GALEX deep fields are known to be crowded and down to mag, Sextractor does not separate accurately the sources leading to an under-density and a brightening of the sources. In the -band the PSF is smaller, so less or not affected by confusion.
We then focus on the difference in the UV LF from -band and the LBG LF. As mentioned above, the former was constructed with the -band selection with the univariate method, while the latter was constructed by the bivariate method: we first select galaxies at NUV and with a FUV-NUV colour criterion, then we estimate the -band luminosity distribution. Therefore LBG selection criteria at are not very different from the -selection at similar redshift () since both are based on a UV rest-frame selection. Nevertheless, in the LBG selection we miss UV-faint galaxies at when compared to the -selection probably because of the combined effects of a selection at a shorter rest-frame wavelength for the LBGs and of a FUV-NUV criterion which selects only blue objects, as explained in section 2.2. This suggests that the LBG selection criterion is more restricted to pick up UV-luminous galaxies. We will come back to this point when we discuss the difference of the LF.
5.3 The total UVIR luminosity functions
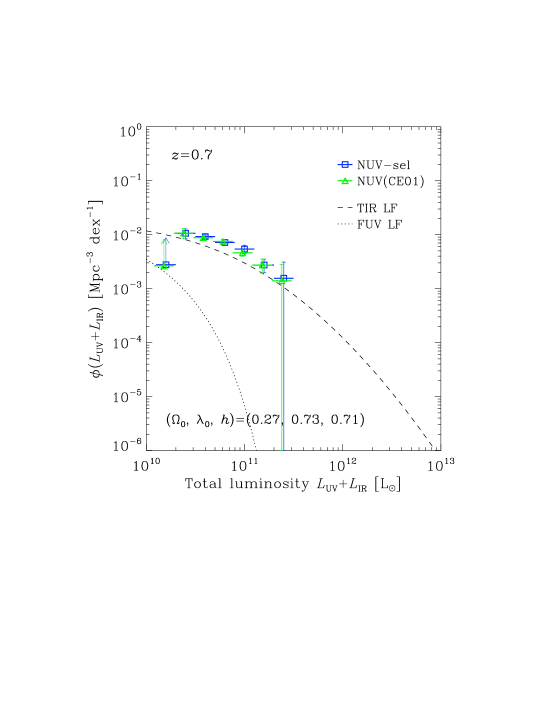
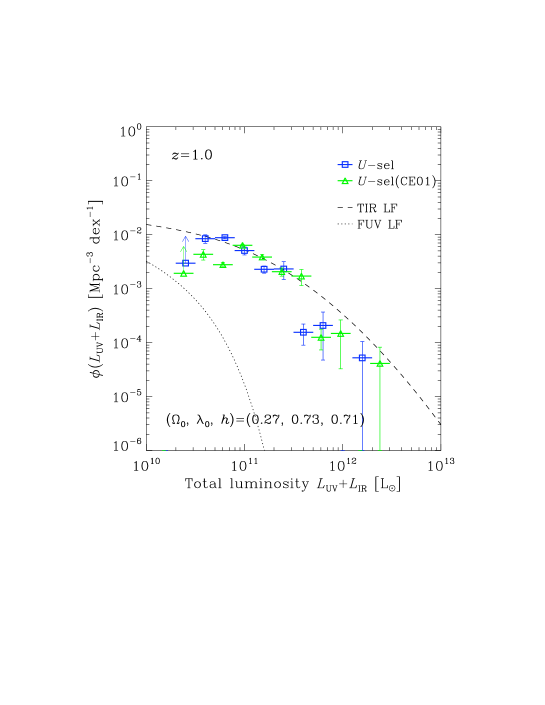
Here, we show the total UV+IR LFs from our UV-selected samples. Again we stress that we addressed the upper limits of the sample at MIPS m by Kaplan-Meier method, i.e., we have made a maximal use of the observed information from IR. We show the total LFs in Figure 10. Top panel shows the LF at , while bottom panel is the one at . In Figure 10, we also show univariate UV LFs constructed from purely UV-selected samples by Arnouts et al. (2005) (dotted lines), as well as univariate IR LFs made from purely IR-selected samples at m by Le Floc’h et al. (2005) (dashed lines). The symbols are the LFs derived from our sample. Errors are calculated analytically by the asymptotic variance formula of the Kaplan-Meier estimator, convolved with the statistical error of the univariate LFs at UV. The indicated errors are (68 % CL). Because of the known limitation of the Kaplan-Meier estimator, the lowest luminosity bins are underestimated (indicated by arrows on the symbols).
Clearly, the total LFs are much higher than the univariate UV LFs. This means that most of the luminosity of a galaxy at these redshifts is emitted in the IR. Since the luminosity related to their star formation activity tends to be emitted in the IR wavelengths (e.g., Takeuchi et al., 2005b), the resulting total LFs is consistent with this known fact.
At , the total LF is even higher than the IR LF of Le Floc’h et al. (2005), but within a range of the cosmic variance ( % for GOODS: Somerville et al., 2004). Apart from this, it is rather consistent with the IR LF. This is an expected higher- counterpart of the result discussed by Buat et al. (2007) at .
In contrast, the total LF is significantly lower than the IR LF at for galaxies more luminous than . It is worth mentioning that the primary UV LF has an excess in normalisation compared with the global univariate UV LF at the same redshift. Then, this deficiency of galaxies turns out to be quite significant. Though the most luminous bin is disturbed by the symbol with a very large error, we see a trend that the more luminous galaxies are, the larger the discrepancy becomes. This is a clear piece of evidence that our UV-selection misses intrinsically luminous galaxies which are active in star formation. Such galaxies must be studied from an IR selection. Buat et al. (2007) studied both IR and UV selections in the nearby universe and found that the more luminous galaxies (in terms of total luminosity) are present in the IR selection and suffer a very strong dust attenuation. The galaxies more luminous than exhibit a mean . The relation found between and at has been found to be globally valid at higher for IR selections (Choi et al., 2006; Xu et al., 2007; Zheng et al., 2006). An ratio larger than 100 for galaxies more luminous than implies that these galaxies are not detected at in our selection (limited to )
At our UV selection goes deeper ( ), therefore galaxies with a larger dust attenuation can be detected in UV. It is also interesting to note that the galaxies with the highest are found at (Fig. 4) for the UV faintest galaxies and that the fraction of galaxies with is globally higher at than at any other redshift (Fig. 5). However, it is puzzling to invoke a drastic evolution from to . Since the cosmic time differs by less than a few Gyr, such an evolution should be very fast.
As a conclusion, up to UV rest-frame observations must be much deeper (by more than 5 mag) than the expected limit in bolometric luminosities if one must be able to detect most of the star forming galaxies.
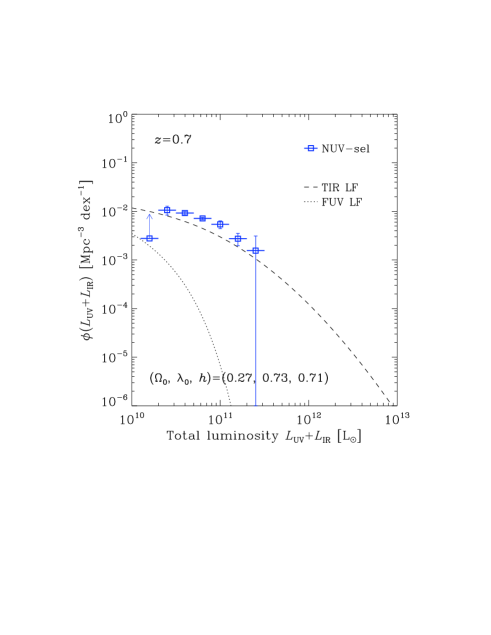
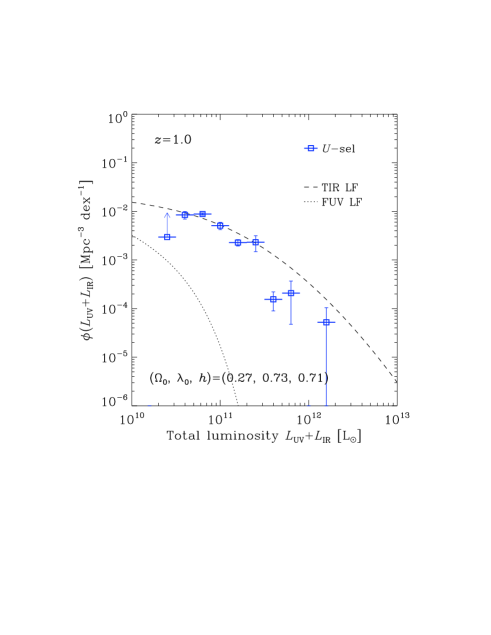
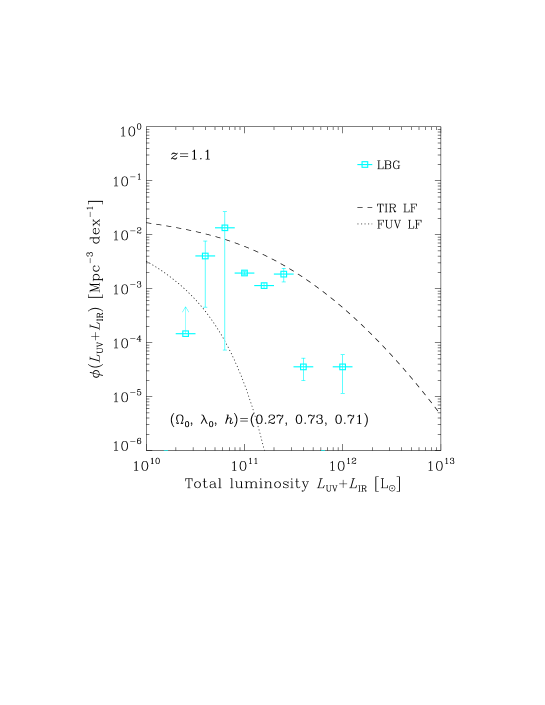
Figure 11 shows the total UV+IR LF of the LBG sample. The deficiency of total LF is more prominently seen in the LBG LF. In this case, the deficiency ranges toward lower luminosities . Considering the LBG sample selection which makes use of NUV and FUV fluxes observed at and Å by GALEX, this trend may be understood consistently: the LBG sample consists of galaxies with less extinction on average, leading to less IR luminosities with respect to the same as shown in section 3. The deficiency with respect to the -selection affects the faintest bins of the LBG LF (Fig. 9 and discussion in section 5.2). Since the dispersion of the distribution is very large as we have seen before, the contribution of these bins to the number density of galaxies is significant and the deficiency of galaxies affects all the range of the total LF.
5.4 Discussion
As discussed by many authors (e.g., Chary & Elbaz, 2001; Takeuchi et al., 2005a; Caputi et al., 2007; Rieke et al., 2008), the monochromatic MIR luminosity-to-total IR luminosity conversion plays an important role, especially because of the currently limited number of deep multi-band observations at FIR. Since the intrinsic scatter in the linear regression is not very small, these “calibration formulae” inevitably have significant uncertainty. Then, it makes sense to examine how different formulae change our results, especially the deficiency of intrinsically luminous galaxies in the UV-selection.
To test this, we have estimated the total LFs exactly in the same manner but with CE01 conversion. The resulting LFs are shown in Figure 12. In Figure 12, open squares represent the LFs with the formula of Takeuchi et al. (2005a), while open triangles are the ones with CE01 conversion. All the other symbols are the same as in Figure 10.
At , since the difference of these formulae is quite small (cf. upper panel in Fig. 1), the results are almost the same. At , the difference is visible between the two estimates. As we have seen in Figure 1, CE01 formula gives larger IR luminosity. Hence, it produces larger total luminosity in with respect to the same . As a result, the discrepancy between the total LF and the IR LF becomes smaller, but still statistically significant.
At and , Reddy et al. (2008) were able to reproduce all the IR LF up to from only UV-optical data with even an excess of faint sources as compared to the results from IR surveys alone. They built the UV rest-frame LF with Monte Carlo simulations to recover all the star forming galaxies; then, to recover the IR LF they assumed either a constant dust attenuation distribution irrespective of UV luminosity or a decrease of the average dust attenuation for UV faint galaxies. Conversely, at dust attenuation is found not very dependent on UV luminosity with only a slight decrease for UV luminous galaxies. We cannot reconstruct the bright end of the IR LF from a UV-selected sample. The IR luminous galaxies, observed in IR surveys, exhibit a very large dust attenuation which makes them undetected in UV (rest-frame). Since we use actually observed IR and UV flux densities (including upper limits) our method can be considered as being secure, although it is dependent on the validity of the MIR to total IR luminosity conversion. The method of Reddy et al. also suffers from the uncertainty in the MIR to total IR luminosity conversion which is particularly large at m rest-frame and on the accuracy of dust attenuation factors estimated from the UV-optical alone (see discussion in section 3.2). Nevertheless if we trust both results it implies a lower fraction of galaxies intrinsically UVIR luminous and with a large dust attenuation at than at . We will re-investigate this issue by using IR-selected samples up to in a fully bivariate manner (Takeuchi et al. 2009, in preparation). The future observations of HERSCHEL should give us the high redshift IR selected samples necessary to solve this question.
6 Conclusions
We have analysed the IR emission of galaxies selected in UV rest-frame from to . The samples were built to be very homogeneously selected in terms of wavelength and luminosities. We also considered a sample of Lyman Break Galaxies at .
-
1.
The ratio was used as a proxy for dust attenuation. For the bulk of our galaxy samples, this dust attenuation is found not to vary significantly with and less than 20 % of the sample galaxies have a . Anyway, some evolution is seen in the extreme regimes of high and low ratio. The most luminous UV objects () are only present at and exhibit a very low dust attenuation. When , the fraction of galaxies with a high is larger at than in the nearby universe and the galaxies with the largest dust attenuation are the faintest ones in our samples () . However these results all depend on the MIR-total IR calibration which is uncertain. Dust attenuation increases with the luminosity in a similar way at all redshifts. A residual trend is found with the UV luminosity: when increases, galaxies of a given have a lower . A relation between , and is given. LBGs at seem to be less extinguished than UV selected galaxies of similar UV luminosity and at same . Since the UV luminosity of galaxies globally increases with , these trends found with the UV luminosity must be accounted for to interpret the evolution with redshift of reported in previous studies.
-
2.
Massive and UV luminous galaxies ( and ) are found very active in star formation (large SSFR) whereas fainter galaxies of similar mass exhibit a larger range of SSFR. LBGs and UV selected galaxies have similar SSFR.
-
3.
We constructed LFs with total luminosity related to star formation activity, from our UV-selected galaxy samples. We have used the Kaplan-Meier estimator to make use of information carried by IR detections and upper limits in a coherent manner. The resulting total LFs are much higher than the univariate UV LFs from purely UV-selected samples. This means that most of the luminosity produced by star formation activity is emitted in the IR wavelength range. Though at , the total LF we obtain is consistent (even higher because of a density excess) with the univariate IR LF, we find a clear deficiency of galaxies in the total LF at for galaxies more luminous than This result is not significantly affected by different total IR luminosity calibration formula. Thus, we conclude that the IR LF cannot be reconstructed solely from our UV-selected galaxies at and that deeper data are needed in order to detect galaxies with a large . Practically, to detect most of the star forming galaxies down to a given bolometric magnitude, UV rest-frame observations must be deeper than this bolometric limit by at least 5 mag (corresponding to (). The deficiency in the total LF is found much higher for the LBG selection affecting the whole range of luminosity explored in this work for these objects (i.e. ).
Acknowledgements.
TTT has been supported by Program for Improvement of Research Environment for Young Researchers from Special Coordination Funds for Promoting Science and Technology, and the Grant-in-Aid for the Scientific Research Fund (20740105) commissioned by the Ministry of Education, Culture, Sports, Science and Technology (MEXT) of Japan. We thank Akio K. Inoue and Hiroyuki Hirashita for fruitful discussions. TTT and KLM are partially supported from the Grand-in-Aid for the Global COE Program “Quest for Fundamental Principles in the Universe: from Particles to the Solar System and the Cosmos” from the MEXT.References
- Arnouts et al. (2001) Arnouts, S., Vandame, B., Benoist, C. et al. 2001, A&A, 379, 740
- Arnouts et al. (2005) Arnouts, S, Schiminovich, D., Ilbert, O. et al., 2005, ApJ, 619, L43
- Arnouts et al. (2007) Arnouts, S, Walcher, C. J., Le Fèvre O. et al., 2007, A&A, 476, 137
- Basu-Zych et al. (2007) Basu-Zych, A.R., Schiminovich, D., Johnson, B. et al., 2007, ApJS 173, 457
- Bauer et al. (2004) Bauer, F.E., Alexandern D.M., Brandt, W.N. et al. 2004, AJ, 128, 2048
- Bell et al. (2003) Bell, E. F., MacIntosh, D. H., Katz,N., Weinberg, N. D. 2003, ApJS, 149, 289
- Buat et al. (2002) Buat, V., Deharveng, J. M., Burgarella, D., Kunth, D. 2002, A&A, 393, 33
- Buat et al. (2005) Buat, V., Iglesias-Páramo, J, Seibert, M. et al. 2005, ApJ, 619, L51
- Buat et al. (2007) Buat, V., Takeuchi, T. T., Iglesias-Páramo, J, et al. 2007, ApJS, 173, 404
- Buat et al. (2007) Buat, V., Marcillac, D., Burgarella, D. et al. 2007, A&A, 469, 19
- Buat et al. (2008) Buat, V., Boissier, S., Burgarella, D. et al. 2008, A&A, 483, 107
- Burgarella et al. (2006) Burgarella, D., Pérez-González, P., Tyler, K. D. 2006, A&A, 450, 69
- Burgarella et al. (2007) Burgarella, D., Le Floc’h, E., Takeuchi, T. T. 2007, MNRAS, 380, 986
- Burgarella et al. (2009) Burgarella, D., Buat, V., Takeuchi, T. T. 2009, PASJ, 61, 177
- Calzetti et al. (2000) Calzetti, D., Armus, L., Bohlin, R. C. et al. 2000, ApJ, 533, 682
- Caputi et al. (2007) Caputi, K, Lagache, G., Yan, L. et al. 2007, ApJ, 660, 97
- Chary & Elbaz (2001) Chary, R., Elbaz, D. 2001, ApJ, 556, 562
- Choi et al. (2006) Choi, P. I., Yan, L., Im, M., et al. 2006, ApJ, 637, 227
- Dale & Helou (2002) Dale, D. A. , Helou, G. 2002, ApJ, 576, 159
- Dale et al. (2001) Dale, D. A., Helou, G., Contursi, A. et al. 2001, ApJ, 549, 215
- Dale et al. (2005) Dale, D. A. , Bendo, G. J., Engelbracht, C. W. et al. 2005, ApJ, 633, 857
- Elbaz et al. (2007) Elbaz, D., Daddi, E. , Le Borgne, D. et al. 2007, A&A, 468, 33
- Heckman et al (2005) Heckman, T. M. et al. 2005, ApJ, 619, L35
- Hoopes et al (2007) Hoopes, C. G. et al. 2006, ApJS 173, 441
- Hopkins et al. (2001) Hopkins, A. M., Connolly, A. J., Haarsma, D. B., Cram, L. E. 2001, AJ, 122, 288
- Iglesias-Paramo et al. (2006) Iglesias-Páramo, J., Buat, V., Takeuchi, T. T., et al. 2006, ApJS, 164, 38
- Iglesias-Paramo et al. (2007) Iglesias-Páramo, J., Buat, V., Hernández-Fernández, J. et al. 2007, ApJ, 670, 279
- Kaplan & Meier (1958) Kaplan, E. L., & Meier, P. 1958, J. Am. Stat. Assoc. 53, 457
- Le Floc’h et al. (2005) Le Floc’h, E., Papocich, C., Dole, H. 2005, ApJ, 632, 169
- Leitherer et al. (2002) Leitherer, C., Li, I.-H, Calzetti, D., Heckman, T. M. 2002, ApJS, 140, 303
- Lynden-Bell (1971) Lynden-Bell, D. 1971, MNRAS, 155, 95
- Malkan et al. (2003) Malkan, M., Webb, W., Konopacky, Q. 2003, ApJ, 598, 878
- Marcillac et al. (2006) Marcillac, D., Elbaz, D., Chary, R. R. et al. 2006, A&A 451, 57
- Martin et al. (2005) Martin, D. C., Seibert, M., Buat, V. et al. 2005, ApJ, 619, L59
- Martin et al. (2007) Martin, D. C. Small, T., Schiminovich, D. et al. 2007, ApJS, 173, 415
- Morrissey et al. (2005) Morrissey, P., Schiminovich, D., Barlow, T. A. 2005, ApJ, 619, L7
- Moustakas et al. (2006) Moustakas, J., Kennicutt, R. C., Tremonti, C. A. 2006, ApJ, 642, 775
- Reddy et al. (2006) Reddy, N,A, Steidel, C.C., Erb, D.K. 2006, ApJ, 653, 1004
- Reddy et al. (2008) Reddy, N. A., Steidel, C. C., Pettini, M. et al. 2008, ApJS, 175, 48
- Rieke et al. (2008) Rieke, G. H., Alonso-Herrero, A., Weiner, B.J. et al. 2009, ApJ, 692, 556
- Schmidt (1968) Schmidt, M. 1968, ApJ, 151, 393
- Somerville et al. (2004) Somerville, R. S., Lee, K., Ferguson, H. C., Gardner, J. P., Moustakas, L. A., & Giavalisco, M. 2004, ApJ, 600, L171
- Stern et al. (2005) Stern, D., Eisenhardt, P., Gorjian, V. et al. 2005, ApJ, 631, 163
- Takeuchi et al. (2000) Takeuchi, T. T., Yoshikawa, K., & Ishii, T. T. 2000, ApJS, 129, 1
- Takeuchi (2000) Takeuchi, T. T. 2000, Ap&SS, 271, 213
- Takeuchi et al. (2003) Takeuchi, T. T., Yoshikawa, K., & Ishii, T. T. 2003, ApJ, 587, L89
- Takeuchi et al. (2005a) Takeuchi, T. T., Buat, V.,Iglesias-Páramo, J, Boselli, A., Burgarella, D. 2005, A&A, 432, 423
- Takeuchi et al. (2005b) Takeuchi, T. T., Buat, V., Burgarella, D. 2005, A&A, 440, L17
- Tresse et al. (2007) Tresse, L., Ilbert, O., Zucca, E. et al. 2007, A&A, 472, 404
- Wolf et al. (2004) Wolf, C., Meisenheimer, K., Kleinheinrich, M. et al. 2004, A&A, 421, 913
- Xu et al. (2007) Xu, C. K., Shupe, D., Buat,V. et al. 2007, ApJS, 173, 432
- Zheng et al. (2006) Zheng, X. Z. et al. 2006, ApJ, 640, 784