Optical spectroscopy of the quiescent counterpart to EXO 0748676
Abstract
We present phase resolved optical spectroscopy and X-ray timing of the neutron star X-ray binary EXO 0748676 after the source returned to quiescence in the fall of 2008. The X-ray light curve displays eclipses consistent in orbital period, orbital phase and duration with the predictions and measurements before the return to quiescence. H and He I emission lines are present in the optical spectra and show the signature of the orbit of the binary companion, placing a lower limit on the radial velocity semi-amplitude of km s-1. Both the flux in the continuum and the emission lines show orbital modulations, indicating that we observe the hemisphere of the binary companion that is being irradiated by the neutron star. Effects due to this irradiation preclude a direct measurement of the radial velocity semi-amplitude of the binary companion; in fact no stellar absorption lines are seen in the spectrum. Nevertheless, our observations place a stringent lower limit on the neutron star mass of M⊙. For the canonical neutron star mass of M⊙, the mass ratio is constrained to .
keywords:
1 Introduction
Neutron star low-mass X-ray binaries (LMXBs) consist of a neutron star that accretes matter from a low-mass companion star. From binary evolution models, we know that the neutron star could accrete up to 0.7 M⊙ from the companion (e.g. van den Heuvel & Bitzaraki 1995). In that case, neutron stars as massive as M⊙ may be expected in LMXBs. Such a high-mass neutron star would pose strong constraints on the equation of state (EOS) of matter at the pressures and densities encountered in neutron star cores (see Lattimer & Prakash 2004 and references therein). Determining the neutron star EOS is one of the ultimate goals of the study of neutron stars.
In order to determine the neutron star mass in these effectively single-line spectroscopic binaries, we need to know the inclination, the projected rotational velocity of the companion star and the semi-amplitude of its radial velocity curve. In principle, these last two parameters can be determined via optical spectroscopy. Unfortunately, the companion stars of LMXBs are nearly always intrinsically faint and they are typically located at distances of several kilo-parsecs. Furthermore, in systems accreting at high accretion rates the accretion disc out-shines the small companion stars making it impossible to detect the stellar absorption lines necessary to determine and . In LMXBs the binary inclination can be determined accurately if the system is eclipsing (Horne, 1985). Hence, in order to provide the strongest, model independent constraints on the neutron star mass we need to target quiescent, eclipsing LMXBs.
EXO 0748676 is such an eclipsing LMXB. It was discovered using observations of the European X-Ray Observatory Satellite (EXOSAT) in 1985 (Parmar et al., 1985). The presence of X-ray eclipses and type I X-ray bursts marking the compact object as a neutron star, were readily found (Parmar et al., 1986; Gottwald et al., 1986). In hindsight the source had been observed serendipitously by the EINSTEIN satellite as well as during EXOSAT slews (Garcia & Callanan 1999 and Reynolds et al. 1999, respectively).
The optical counterpart to the X-ray source has been found by Parmar et al. (1985). Wade et al. (1985) report on the discovery of the optical counterpart as well as on searches of archival optical plates showing that the optical source was not present down to roughly 23rd magnitude in the SRC J plate when the X-ray source was inactive. Cottam et al. (2002) reported on a measurement of the gravitational redshift from X-ray absorption line spectroscopy during type I X-ray bursts providing ; this is, so far, unique to this source. However, these features were not detected in subsequent observations and thus require further confirmation (see Cottam et al. 2008). Recently, Galloway et al. (2009) announced the discovery of nearly periodic oscillations during two type I X-ray bursts in EXO 0748-676 at a frequency of 552 Hz. This is at odds with the 45 Hz burst oscillations reported by Villarreal & Strohmayer (2004). If 552 Hz is indeed the neutron star spin frequency the redshift measurement is challenged further since rotational Doppler broadening tends to lower the contrast unless the orientation of the neutron star is favorable, with the spin axis pointing in our direction. Using a combination of observations, including the contested redshift measurement, and theoretical findings Özel (2006) argues that the mass in EXO 0748676 is M⊙, which if confirmed would rule out many soft equations of state. However, a high spin frequency, such as 552 Hz, besides challenging the redshift measurement, also introduces sizeable relativistic corrections to the equations and thus result of Özel (2006).
Attempts to use narrow He, C and N emission lines that are probably originating on the heated inner hemisphere of the companion star to get a lower limit on the mass of the neutron star are presented in Pearson et al. (2006) and Muñoz-Darias et al. (2009). The X-ray eclipse duration for EXO 0748676 in outburst has been measured from X-ray studies using the EXOSAT and XMM-Newton satellite (8.3 minutes, Parmar et al. 1986 and Homan et al. 2003, respectively).
Recently, the system returned to quiescence after a more than 20 year-long active phase (see Wolff et al. 2008ab, Hynes & Jones 2008; Torres et al. 2008). Analysing the optical -band and near-infrared -band light curves, Hynes & Jones (2009) find that the residual X-ray luminosity of the cooling hot neutron star (see Degenaar et al. 2009) is causing the inner hemisphere of the companion star to be heated.
We here present phase-resolved optical spectroscopy and X-ray observations of the source shortly after the end of the outburst.
2 Observations and data reduction
2.1 X-ray observations
We have observed EXO 0748676 on Nov. 6, 2008 at 08:53:10 (UTC) with the European Photon Imaging Camera (EPIC) on board the XMM-Newton satellite. These data were acquired 62 days after the first X-ray observations of EXO 0748676 by Degenaar et al. (2009). Hence, the source was in quiescence. The observation time was awarded to our Directors Discretionary Time proposal. The observation identification number is 0560180701. Two of the three imaging cameras on board XMM-Newton use Metal Oxide Semi-conductor (MOS) CCD arrays whereas one uses a pn CCD array. Since the MOS cameras receive less than 50 per cent of the light due to the presence of the Reflection Grating Spectrometers in the light path we present results of the pn camera only. The pn camera was employed in PrimeFullWindow mode and a medium filter was put in place to avoid strong contamination due to bright optical sources in the field of view.
To benefit from the latest calibrations available in December 2008 we have reprocessed and analysed the data using the SAS software version 8.0.0. Data are excluded if the 10-12 keV background count rate for single events in a CCD-pixel region (with pattern 0.0) is higher than 1.0 count s-1. The net on-source exposure time is 29.82 ks. We have produced bary-centered events lists using the SAS tool barycen.
Next, we have produced a background subtracted source light curve with 10 second time bins including events of photon energies larger than 0.15 keV. Source photons have been extracted from a circular region of radius centered on the best known source position. Background photons have been extracted from a source-free region of the same size and shape on the same CCD.
2.2 Optical observations
Long-slit spectra of the optical counterpart to EXO 0748676 were obtained with FORS2, the low dispersion spectrograph of ESO’s Very Large Telescope. Between November 25th and December 26th, 2008, a total of 31 spectra were obtained, all with 870 s exposure times and using the 1200R grism, covering the wavelength range between 5750 Å and 7310 Å, and a slit. The detectors were read out with binning, providing a resolution of 2.1 Å sampled at a dispersion of 0.76 Å pix-1. All spectra were obtained during times of good to excellent seeing ( to ).
The images were corrected for bias and flat-fielded using lamp flats. For the sky subtraction we used clean regions on the slit, fitting it with a polynomial of up to 2nd order if that provided the best fit. The spectra were optimally extracted following the algorithm of Horne (1986) and wavelength calibrated using arc lamp exposures taken during daytime. Finally, an approximate flux calibration, not correcting for slit losses, was determined from a 22 s exposure of the spectrophotometric standard LTT 3218 taken on the first night with a slit.
We furthermore analysed 15 -band acquisition images of 30 or 40 s exposure times taken prior to the spectral observations. These images were corrected for bias and flat-fielded using sky flats. Instrumental magnitudes of stars on each image were determined through point-spread-function fitting using DAOphot II (Stetson, 1987). All magnitudes were calibrated against the instrumental magnitudes of stars on the first image by using some 350 to 400 comparison stars to fit for an offset in instrumental magnitude.
For the photometric calibration of the first image, we used aperture photometry of a few bright stars to determine the aperture correction and determined the photometric calibration from 19 photometric standards from the PG 2213006 field (Landolt, 1992; Stetson, 2000). We used the standard FORS2 -band extinction coefficient of 0.08 mag per airmass to correct for the difference in airmass between the field of EXO 0748676 and the PG 2213006 standard field. Because no color coefficients could be determined, we estimate the uncertainty in the photometry as the rms in the zeropoint, which is about 0.1 mag.
3 Data analysis
3.1 X-ray timing
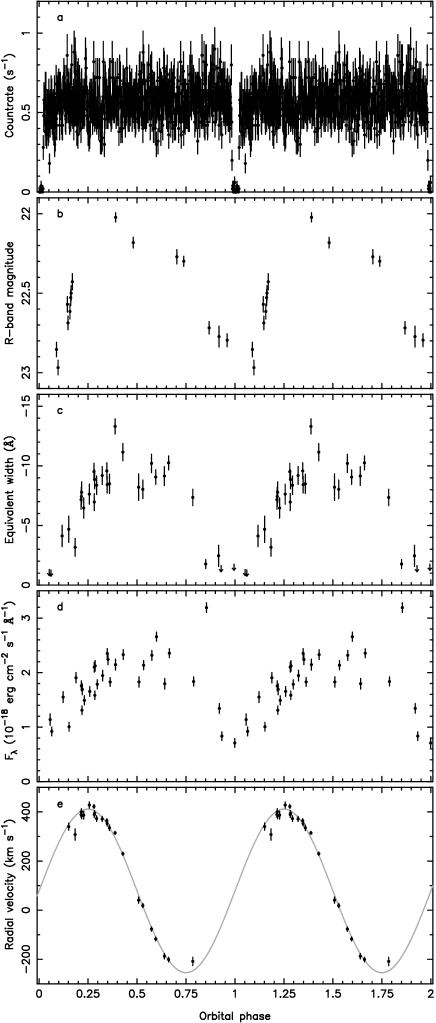
During the X-ray observations of EXO 0748676 the source shows a constant count rate of counts s-1 except for the two distinct eclipses. Fig. 1a shows the X-ray light-curve of the total detected counts (including background). The background flux was consistent with being constant at 0.015 counts s-1. For the present work we are mainly interested in the eclipse duration and the orbital period and mid eclipse times. The spectral properties of the source will be presented elsewhere. We fit the light curve by a constant plus four step functions located at and for the first eclipse and and for the second eclipse. Here is the mid eclipse time of the first eclipse, is the orbital period and is the eclipse duration. The step functions are approximated by heaviside functions, defined as , where hour-1 is used to describe the eclipse ingress and hour-1 describing the eclipse egress. With these values for , 50 per cent of the flux at the ingress and egress times is contained in a single 10 s bin. Fitting for , , and a constant to describe the flux out of the eclipse, we obtain MJD/TDB, h and s.
We have compared and with the values predicted by the orbital ephemerids of EXO 0748676 obtained from RXTE X-ray timing by Wolff et al. (2002). Extrapolating their ephemerids to orbit gives consistent results for the orbital period at the level, while the mid eclipse time falls between the predictions of the constant-period ephemeris and the quadratic ephemeris using all data. At , the prediction from the constant-period ephemeris lies closest to our measurement. Because the ephemeris of Wolff et al. (2002) uses a considerably larger dataset, their results are expected to represent the long term timing better, and hence, for the remainder of the paper we will use the mid eclipse time and orbital period given by the constant-period ephemeris of Wolff et al. (2002).
We selected in total 800 s worth of data centered on the mid-eclipse times for both eclipses in our dataset. Even during the X-ray eclipses, EXO 0748676 is still detectable, providing 29 source counts (38 total counts from which 9 are expected due to the background) in the 800 s of observation that we used. This constitutes approximately 6.6 per cent of the out of eclipse keV count rate.
3.2 Radial velocities and spectral properties
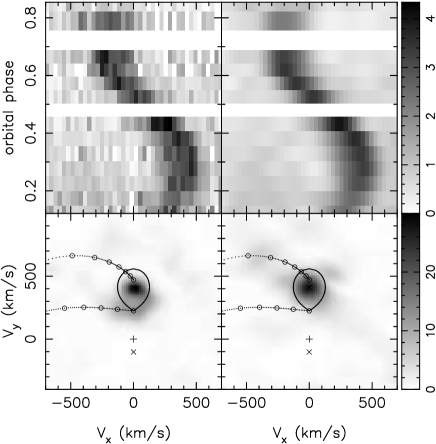
The individual extracted optical spectra are generally featureless except for the region around H where all spectra have a broad emission component (FWHM of about 26 Å), while a strong narrow emission line (5 Å FWHM) is present in spectra taken between orbital phases of approximately . Here is defined as the center of the X-ray eclipse. Fig. 2 shows a trailed spectrum of the H region, folded on the ephemeris of Wolff et al. (2002), where the emission clearly follows the orbital signature of a circular orbit. The emission appears strongest between the quadratures and weakest at the time of the X-ray eclipse.
To measure radial velocities of the H components we fit the spectral range between 6400 Å and 6700 Å of each spectrum with either a single Gaussian for spectra taken between and and two Gaussians for spectra taken between . Three parameters, position, width and height, were fitted for each Gaussian. Fitting a circular orbit with to the radial velocities of the narrow emission component returns km s-1 and km s-1 with a reduced for 22 degrees of freedom (see Fig. 1e). The errors on the values given above are the formal uncertainties and are scaled to give . Because these radial velocities are determined from emission lines the measured radial velocity semi-amplitude may or may not be equal to the true radial velocity semi-amplitude of the companion , see § 4.
For this fit, the orbital period and mid eclipse time were set to those of the ephemeris of Wolff et al. (2002). Leaving these parameters free in the fit gives values that are fully consistent with their constant-period ephemeris extrapolated to . The difference in is only min ( in phase), while the difference in is s.
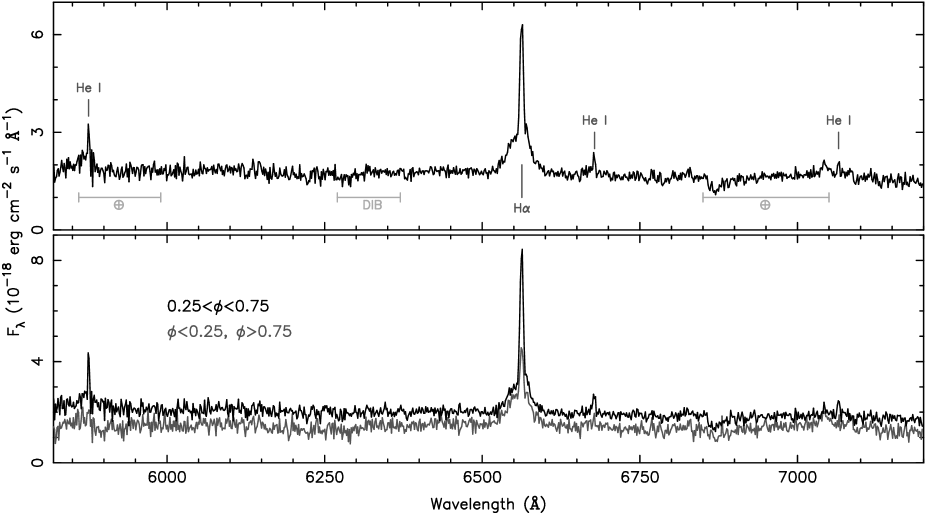
An average of the 31 individual spectra is shown in Fig. 3, where the individual spectra are shifted to zero radial velocity using the H radial velocity curve. This spectrum shows, besides the narrow and broad H components, weak emission lines of He I , and . Some telluric absorption features are present at Å. Zero velocity averages of individual spectra with orbital phases between and between and are also shown in Fig. 3. Here, the first spectrum predominantly shows the hemisphere of the companion facing the neutron star, while the latter spectrum shows the opposite hemisphere. The spectra are significantly different, with the H and He I emission lines being strongest on the hemisphere facing the neutron star. Furthermore, that hemisphere appears brighter by about a factor 2.
Though no absorption features appear to be present that may be attributable to the binary companion, we have compared the averaged spectrum against synthetic stellar spectra by Munari et al. (2005). In the wavelength range covered by our observations, the strongest absorption features are the TiO bands around 6180 Å and 7050 Å for temperatures below about K, while the Na I D lines are present for temperatures between 4000 K to 7500 K, decreasing in strength with increasing temperature. Between 4000 K to 5000 K many metallic lines are present in the range between 6000 Å to 6400 Å. Above about 5000 K H becomes increasingly stronger.
Unfortunately the region around the Na I D lines overlaps with the He I emission line while the H emission likely swamps the absorption component. As such, both regions cannot be used. Instead, we use the region between 6000 Å and 6250 Å, computing a statistic by fitting the ratio in flux between the template and the zero velocity averaged spectrum with a second order polynomial. We find that the best fit solution sets a limit on the temperature of K, regardless of the surface gravity. This temperature is the temperature above which the TiO bands, disappear. The fit has for some 4900 degrees of freedom. The absence of absorption lines in the observed and synthetic spectra essentially prevent us from obtaining a better constraint on the temperature of the companion, and measuring its radial velocity curve using photospheric absorption lines.
3.3 Variability
The spectroscopic as well as the photometric observations show that the optical flux varies in both the continuum and emission lines. Fig. 1b shows the -band magnitudes determined from the acquisition images and they confirm the light curve published by Hynes & Jones (2009); a single peaked modulation with the minimum at the time of the X-ray eclipse. This trend is also present in both the equivalent width of H (Fig. 1c) and the continuum emission (Fig. 1d). The narrow H emission seems to disappear completely near the phase of the X-ray eclipse at , while the broadband flux varies by a factor of about 2.
3.4 Doppler tomography
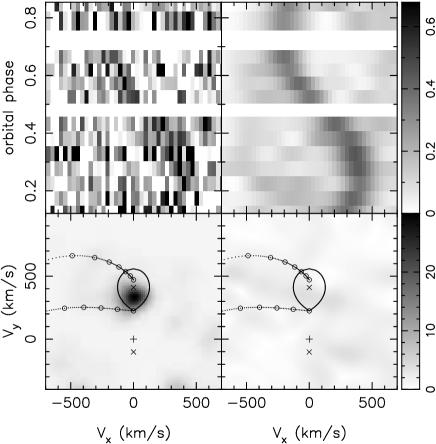
In order to prepare the spectra for emission line tomography, we first continuum normalised each spectrum using a spline-fit and re-binned the data to a constant velocity scale sampling of 33.8 km s-1 pix-1. The spectra were then phase-binned using the Wolff et al. (2002) ephemeris. The prominent orbital variation in the H component led us to employ the modulation Doppler tomography method described in Steeghs (2003). This technique includes variable contributions modulated on the orbital period and was used to construct emission line tomograms resolving the H and He I emission distributions. We used a systemic velocity of 78 km s-1 as derived in § 3.2, although the reconstructions are robust against the exact choice of . The advantages of Doppler tomography are its ability to map complex line profiles using the whole data set at once. Contributions from specific sources in the binary can then be identified by their known position on the tomogram.
Reconstructions achieved good fits to the observed line profiles, achieving formal for both H and He I . We show the reconstructions for these lines in Fig. 2. The bulk of the emission originated from a region consistent with the location of the mass donor star, although a weak underlying signature from an accretion disc can also be seen. These are responsible for the broad base (disc) and narrow (donor) moving line components previously mentioned. Since we are mainly concerned with the contribution from the donor, we restrict the plotted velocity intervals to the region surrounding the expected location of the donor.
In H, the donor star component is reconstructed as an extended feature centred on the Y-axis, covering velocities between 200 and 410 km s-1. This emission is furthermore significantly modulated with an amplitude of 30 per cent, peaking near orbital phase . Both the distribution as well as the modulation of this emission is exactly what would be expected for line emission from an irradiated donor star. However, the emission does not appear to be uniformly distributed across the Roche lobe. We measured the centroid position of the pronounced peak in our Doppler tomograms using several methods and found consistent velocity measurements to within a few km s-1. For example, a Gaussian fit to the H map delivers a peak of km s-1 while the highest pixel is at 410 km s-1. We also reconstructed Doppler maps using different values for the systemic velocity to see by how much the measured peak position would be affected. Varying the systematic velocity by as much as 15 km s-1 shifts the peak velocity down by up to 5 km s-1. The donor star component is broadened and weaker for reconstructions with significantly above or below our assumed value of 78 km s-1. This is further confirmation that this is close to the true value for the systemic velocity and that its impact on the measured is small. Given that formal error propagation is not possible in maximum-entropy regularised inversions such as our Doppler maps, we conservatively assign an uncertainty of 5 km s-1 to our measured velocities. This uncertainty encompasses the observed scatter in derived when comparing different centroid methods as well as the systematic contribution due to a possible uncertainty in (as evaluated above).
For H, our measured km s-1 is significantly larger than the values determined in § 3.2 via our radial velocity curve fits. For comparison, He I shows a more spot-like distribution, again centred closely to the Y-axis and peaking at km s-1. We do not have sufficient signal-to-noise in this much weaker line to constrain its variability amplitude to a significant degree. We thus find that the peak of the H emission is found further back on the Roche lobe compared to the He I emission. For illustration, we plot the expected shape of the donor star Roche lobe in Fig. 2 using a mass ratio of and km s-1. The various estimates for will be compared and discussed in the next section.
4 Discussion and conclusions
We have obtained X-ray timing and phase-resolved optical spectra of the eclipsing low-mass X-ray binary EXO 0748676 shortly after the source transitioned into quiescence after several decades of outburst activity. Timing of the X-ray eclipses show that the orbital period and eclipse duration are consistent with the values when the source was in outburst. In addition, the orbital phase is consistent with extrapolating the constant period ephemeris of Wolff et al. (2002).
The X-ray eclipses in EXO 0748676 are near total, however, about 6 to 7 per cent of light remains during the eclipses. Bonnet-Bidaud et al. (2001) find that in outburst part of this residual flux can be attributed to fluorescent thermal halo emission. Homan et al. (2003) find that in outburst about 4 per cent of the keV continuum emission is detected during eclipse. They attribute this to light scattered into our line of sight by a corona. Given that they find that the fraction of light during the eclipse is larger for lower energies, our value seems consistent with that found in outburst. This implies that the structure responsible for the scattering is still present, or still replenished even when the source is in quiescence.
Using our medium resolution VLT/FORS2 spectra of EXO 0748676 we find emission lines of H and He I. They display the orbital motion expected if the lines originate on the binary companion. The optical spectra show considerable flux variations in both the continuum and the emission lines. The variations display a single peak over the orbital period and we attribute this to irradiation of the hemisphere of the companion facing the neutron star. Hynes & Jones (2009) also presented evidence for an irradiated donor star on the basis of their optical and near-infrared photometric observations.
This irradiation causes three effects that will skew the measurement of the radial velocity semi-amplitude. First, due to the irradiation the centre of light is offset from the centre of mass of the companion. The former being on the hemisphere facing the neutron star, the measured radial velocity semi-amplitudes are smaller than the actual orbital velocity of the companion. To correct for this difference one can apply a so called ’-correction’ (Wade & Horne, 1988). This ’-correction’ can be estimated assuming values for the mass-ratio and the opening angle of the accretion disk. The latter is needed to correct for the partial shielding of the binary companion by the accretion disc from the irradiating flux (cf. Muñoz-Darias et al. 2005). Second, the irradiation may induce gas motion on the surface of the mass donor star, resulting in apparent shifts in orbital phase of the radial velocity curve (Kirbiyik 1982; cf. Jonker et al. 2005). Third, due to the difference in flux observed from the irradiated and non-irradiated hemispheres of the companion the rotational broadening profiles are not symmetric. As a result observed line profiles can become dependent on orbital phase and inclination (Jonker et al. 2003; Jonker et al. 2005). This effect is obvious when considering the extreme case where all the flux originates from the irradiated hemisphere. Assuming synchronous rotation, at phase the companion is moving away from the observer at its maximal observed orbital velocity, however, the observed irradiated hemisphere is rotating towards the observer lowering the observed semi-amplitude of the radial velocity curve.
How much the measurement of the radial velocity semi-amplitude is influenced depends therefore on whether the semi-amplitude is determined by fitting Gaussians to the emission line profiles or by fitting a two dimensional Gaussian to the spot in a Doppler tomogram. We modelled the changes in the line velocities by fitting a double Gaussian, one narrow, one significantly broader, to the H emission profiles. We find that the velocities of the narrow component can be well described by fitting a sinusoid with a constant. The semi-amplitude is km s-1 and the constant representing the systemic velocity km s-1 when restricting the fit to the velocities over the orbital phases when the narrow component of the emission line is strongest.
Using Doppler tomography of the H emission line with km s-1 as input we find that the centre of the H emission spot in the Doppler map falls at km s-1. This value for the radial velocity semi-amplitude measured from Doppler tomography is significantly larger than that obtained fitting a double Gaussian to the emission peak. The reason for this difference lies in the fact that the Doppler tomography method does not require symmetric line profiles whereas fitting Gaussians obviously does. The Doppler maps do show that H emission is complex in shape and thus that the single Gaussian model for the narrow component is likely too simplistic to reproduce the observed distribution. The third effect mentioned above renders the line profiles asymmetric, affecting the determined velocities for the ’double Gaussian’ method predominantly. The Doppler tomography will, however, suffer less from this effect yielding velocities closer to the true centre-of-mass velocities. Note, however, that also the Doppler tomography velocities follow the centre of light and hence they also require an unknown ’-correction’.
For the only other emission line strong enough for a Doppler map study, the He I line, we obtain km s-1. There are a number of effects controlling the distribution of line emission across the Roche lobe, and hence defining the location of the centre of light. Parts of the lobe may be shielded from irradiation due to a vertically extended disc, and the optical thickness of this will be dependent on wavelength. The incident angle of the incoming radiation is also much larger near the terminator compared to the region near the inner Lagrangion point (L1). Different emission lines will thus show a different distribution reflecting the varying local conditions of the gas, the ionisation potential of the element involved as well as the geometry of the incoming radiation field. This typically leads to higher-ionisation potential lines to be formed closer to the L1 point (e.g. Harlaftis 1999; Unda-Sanzana et al. 2006).
Our finding that He I emission peaks closer to the L1 point compared to H thus agrees with this picture. It shows that the Balmer lines can still be excited near the terminator, but at the same time also suffer from more effective shielding near the front of the lobe because of the increased optical depth of the accretion flow due to neutral Hydrogen.
The measured radial velocity semi-amplitudes are higher and carry smaller statistical errors than those found during outburst by Muñoz-Darias et al. (2009). Besides a higher radial velocity semi-amplitude, we also find a higher systemic velocity, although the values are consistent within the errors. Muñoz-Darias et al. (2009) observed the system in outburst using emission lines from He II whereas our observations are done in quiescence and using H. The differences in X-ray flux between outburst and quiescence and the different element, may explain the difference in measured radial velocity semi-amplitude in our data compared to Muñoz-Darias et al. (2009) as explained above.
Line emission from the secondary can be expected to lie anywhere between its L1 point and the terminator. Rather than make specific assumptions about the irradiation geometry, we will instead use the peak of the H emission from the Doppler map as a determination of the radial velocity semi-amplitude, since it provides the strictest lower limit on the true radial velocity semi-amplitude of the mass donor, i.e. . Hence, with km s-1, we find that km s-1.
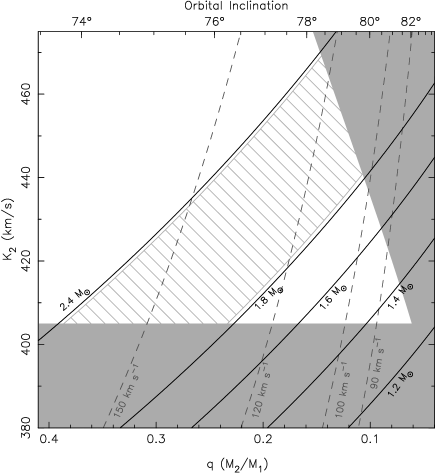
So far, we have used the fact that the true is larger than the observed , where the ’-correction’ depends on the distribution of the emission across the Roche lobe. Thus the lines with the largest must be formed closest to the terminator, whereas lines with lower are more towards L1. An additional limit can thus be set by demanding that . Muñoz-Darias et al. (2009) reported values that are somewhat lower than ours and we used their lower limit on km s-1 to calculate which mass ratios are ruled out because the velocity of the L1 point would be larger than 300 km s-1, which would be inconsistent with the donor star components observed during outburst. This leads to a lower limit on the system mass ratio for a given which is indicated by the shaded region in the upper right of Fig. 4. From this we see that the range of measured donor star velocities that all must satisfy rule out neutron star masses below 1.27 M⊙, so that M⊙. For the canonical neutron star mass of M⊙ our observations constrain the mass ratio to a narrow range of and the companion mass to 0.11 M M⊙.
Narrow H emission originating from the secondary star has also been observed in other quiescent low mass X-ray binaries. When measured after subtracting the underlying H absorption line from the secondary and accounting the veiling from the accretion disc, the equivalent width in these systems is of 2-3 Å and comparable to that observed in rapidly rotating chromospherically active stars (see e.g. Casares et al. 1997; Torres et al. 2002, 2004). In contrast, the narrow H component in EXO 0748676 reaches an equivalent width of tenths of Å (Fig. 1). These high values of the equivalent width can be explained as due mostly to X-ray irradiation of the secondary. Stellar rotation in G-M dwarfs cannot produce such a strength because of saturation effects of stellar activity with rotation (see e.g. Soderblom et al. 1993; Stauffer et al. 1997).
Fitting theoretical stellar template spectra to the observed spectrum averaged in the frame of the companion star, we constrain the temperature of the inner face of the mass donor star to be larger than 5000 K. Stars of such a temperature do not show significant absorption lines in the spectral range covered by our observations. Such temperatures are unexpected for the orbital period of EXO 0748676. A Roche lobe filling main sequence star would have a mass corresponding to that of an M2 star and thus a temperature of approximately 3500 K, much lower than the lower limit derived above. Besides evidence from the equivalent widths of the above mentioned emission lines and the comparison of theoretical stellar templates, we find that the continuum varies in accord with a heated inner hemisphere of the mass donor star (see Fig. 1d), hence, the variability in magnitude over the orbit cannot be explained fully by the change in equivalent width of the emission lines.
Repeat observations targeting a different wavelength range showing deep stellar absorption lines from the mass donor star even in the presence of heating due to the hot neutron star have been requested. Furthermore, the hot neutron star probably causing the irradiating flux (Hynes & Jones 2009) could cool significantly on timescales of a year reducing the irradiating flux (Degenaar et al. 2009).
Acknowledgments
This research is based on observations collected with ESO Telescopes at the Paranal Observatory under programme ID 282.D-5012(A) and on observations obtained with the XMM-Newton satellite. PGJ acknowledges support from the Netherlands Organisation for Scientific Research (NWO). MAPT acknowledges support from NASA grants G08-9041X and G09-8055X. DS acknowledges a STFC Advanced Fellowship.
References
- Bonnet-Bidaud et al. (2001) Bonnet-Bidaud J. M., Haberl F., Ferrando P., Bennie P. J., Kendziorra E., 2001, A&A, 365, L282
- Casares et al. (1997) Casares J., Martin E. L., Charles P. A., Molaro P., Rebolo R., 1997, New Astronomy, 1, 299
- Cottam et al. (2002) Cottam J., Paerels F., Mendez M., 2002, Nat, 420, 51
- Cottam et al. (2008) Cottam J., Paerels F., Méndez M., Boirin L., Lewin W. H. G., Kuulkers E., Miller J. M., 2008, ApJ, 672, 504
- Degenaar et al. (2009) Degenaar N., Wijnands R., Wolff M. T., Ray P. S., Wood K. S., Homan J., Lewin W. H. G., Jonker P. G., Cackett E. M., Miller J. M., Brown E. F., 2009, MNRAS, 396, L26
- Galloway et al. (2009) Galloway D. K., Chakrabarty D., Lin R., 2009, The Astronomer’s Telegram, 2094
- Garcia & Callanan (1999) Garcia M. R., Callanan P. J., 1999, AJ, 118, 1390
- Gottwald et al. (1986) Gottwald M., Haberl F., Parmar A. N., White N. E., 1986, ApJ, 308, 213
- Harlaftis (1999) Harlaftis E., 1999, A&A, 346, L73
- Homan et al. (2003) Homan J., Wijnands R., van den Berg M., 2003, A&A, 412, 799
- Horne (1985) Horne K., 1985, MNRAS, 213, 129
- Horne (1986) Horne K., 1986, PASP, 98, 609
- Hynes & Jones (2008) Hynes R., Jones E., 2008, Astronomer’s Telegram, 1816
- Hynes & Jones (2009) Hynes R. I., Jones E. D., 2009, ApJ, 697, L14
- Jonker et al. (2005) Jonker P. G., Steeghs D., Nelemans G., van der Klis M., 2005, MNRAS, 356, 621
- Jonker et al. (2003) Jonker P. G., van der Klis M., Groot P. J., 2003, MNRAS, 339, 663
- Kirbiyik (1982) Kirbiyik H., 1982, MNRAS, 200, 907
- Landolt (1992) Landolt A. U., 1992, AJ, 104, 340
- Lattimer & Prakash (2004) Lattimer J. M., Prakash M., 2004, Science, 304, 536
- Muñoz-Darias et al. (2005) Muñoz-Darias T., Casares J., Martínez-Pais I. G., 2005, ApJ, 635, 502
- Muñoz-Darias et al. (2009) Muñoz-Darias T., Casares J., O’Brien K., Steeghs D., Martínez-Pais I. G., Cornelisse R., Charles P. A., 2009, MNRAS, 394, L136
- Munari et al. (2005) Munari U., Sordo R., Castelli F., Zwitter T., 2005, A&A, 442, 1127
- Özel (2006) Özel F., 2006, Nat, 441, 1115
- Parmar et al. (1986) Parmar A. N., White N. E., Giommi P., Gottwald M., 1986, ApJ, 308, 199
- Parmar et al. (1985) Parmar A. N., White N. E., Giommi P., Haberl F., Pedersen H., Mayor M., 1985, IAU Circ, 4039
- Pearson et al. (2006) Pearson K. J., Hynes R. I., Steeghs D., Jonker P. G., Haswell C. A., King A. R., O’Brien K., Nelemans G., Méndez M., 2006, ApJ, 648, 1169
- Reynolds et al. (1999) Reynolds A. P., Parmar A. N., Hakala P. J., Pollock A. M. T., Williams O. R., Peacock A., Taylor B. G., 1999, A&AS, 134, 287
- Soderblom et al. (1993) Soderblom D. R., Stauffer J. R., Hudon J. D., Jones B. F., 1993, ApJS, 85, 315
- Stauffer et al. (1997) Stauffer J. R., Balachandran S. C., Krishnamurthi A., Pinsonneault M., Terndrup D. M., Stern R. A., 1997, ApJ, 475, 604
- Steeghs (2003) Steeghs D., 2003, MNRAS, 344, 448
- Stetson (1987) Stetson P. B., 1987, PASP, 99, 191
- Stetson (2000) Stetson P. B., 2000, PASP, 112, 925
- Torres et al. (2004) Torres M. A. P., Callanan P. J., Garcia M. R., Zhao P., Laycock S., Kong A. K. H., 2004, ApJ, 612, 1026
- Torres et al. (2002) Torres M. A. P., Casares J., Martínez-Pais I. G., Charles P. A., 2002, MNRAS, 334, 233
- Torres et al. (2008) Torres M. A. P., Jonker P. G., Steeghs D., Seth A. C., 2008, Astronomer’s Telegram, 1817
- Unda-Sanzana et al. (2006) Unda-Sanzana E., Marsh T. R., Morales-Rueda L., 2006, MNRAS, 369, 805
- van den Heuvel & Bitzaraki (1995) van den Heuvel E. P. J., Bitzaraki O., 1995, A&A, 297, L41
- Villarreal & Strohmayer (2004) Villarreal A. R., Strohmayer T. E., 2004, ApJ, 614, L121
- Wade & Horne (1988) Wade R. A., Horne K., 1988, ApJ, 324, 411
- Wade et al. (1985) Wade R. A., Quintana H., Horne K., Marsh T. R., 1985, PASP, 97, 1092
- Wolff et al. (2008) Wolff M., Ray P., Wood K., Wijnands R., 2008, Astronomer’s Telegram, 1812
- Wolff et al. (2002) Wolff M. T., Hertz P., Wood K. S., Ray P. S., Bandyopadhyay R. M., 2002, ApJ, 575, 384
- Wolff et al. (2008) Wolff M. T., Ray P. S., Wood K. S., 2008, Astronomer’s Telegram, 1736