Discovery of Very High Energy -rays from the blazar S5 0716+714
Abstract
The MAGIC collaboration reports the detection of the blazar S5 0716+714 () in very high energy gamma-rays. The observations were performed in November 2007 and in April 2008, and were triggered by the KVA telescope due to the high optical state of the object. An overall significance of the signal accounts to for 13.1 hours of data. Most of the signal () comes from the April 2008 data sample during a higher optical state of the object suggesting a possible correlation between the VHE -ray and optical emissions. The differential energy spectrum of the 2008 data sample follows a power law with a photon index of , and the integral flux above 400 GeV is at the level of , corresponding to a 9% Crab Nebula flux. Modeling of the broad band spectral energy distribution indicates that a structured jet model appears to be more promising in describing the available data than a simple one zone synchrotron self-Compton model.
1 Introduction
Blazars, a common term used for flat spectrum radio quasars (FSRQ) and BL Lacertae objects, appear to be the most energetic types of Active Galactic Nuclei (AGN). In these objects the dominant radiation component originates in a relativistic jet pointed nearly towards the observer. The double-peaked spectral energy distribution (SED) of blazars is attributed to a population of relativistic electrons spiraling in the magnetic field of the jet. The low energy peak is due to synchrotron emission and the second, high energy peak is often attributed to inverse Compton scattering of low energy photons in leptonic emission models (Maraschi et al., 1992; Dermer & Schlickeiser, 1993; Bloom & Marscher, 1996). Models based on the acceleration of hadrons can also sufficiently describe the observed SEDs and light curves (Mannheim, 1993; Mücke et al., 2003). For most FSRQs and a large fraction of BL Lacertae objects (namely LBLs111LBL = low frequency peaking BL Lacertae) the low energy peak is located in the energy range between submillimeter and optical. On the other hand, for most of the sources detected to emit VHE -rays (HBLs222HBL = high frequency peaking BL Lac) the low energy peak is located at UV to X-rays energies (Padovani, 2007). The high energy peak is typically at MeV–GeV energies. Blazars are highly variable in all wavebands and the relation between variability in different bands is a key element in discriminating between different models.
The MAGIC Collaboration is performing Target of Opportunity observations of sources in a high flux state in the optical and/or X-ray band. Optically triggered observations have resulted in the discovery of VHE -rays from Mrk 180 (Albert et al., 2006) and 1ES 1011+496 (Albert et al., 2007a). In this paper we report the results of observations of S5 0716+714 in November 2007 and April 2008. The observation at the latter date resulted in the discovery of VHE -rays from the source as announced in Teshima et al. (2008).
The BL Lac object S5 0716+714 has been studied intensively at all frequency bands. It is highly variable with rapid variations observed from the radio to X-ray bands (Wagner et al. 1996). It has therefore been target to several multiwavelength campaigns, the most recent one organized by the GLAST-AGILE Support Program in July-November 2007 (Villata et al., 2008; Giommi et al., 2008a). Due to the very bright nucleus, which outshines the host galaxy, the redshift of S5 0716+714 is still uncertain. The recent photometric detection of the host galaxy (Nilsson et al., 2008) suggests a redshift of which is consistent with the redshift determined by spectroscopy for three galaxies close to the location of S5 0716+714 (Stickel et al., 1993). In the SED of S5 0716+714 the synchrotron peak is located in the optical band and is, therefore, classified either as LBL (Nieppola et al., 2006) or as IBL333IBL = intermediate frequency peaking BL Lacertae (Padovani et al., 1995)
S5 0716+714 was detected in the MeV energy range several times at different flux levels by the EGRET detector on board the Compton Gamma-ray Observatory (Hartman et al., 1999). In 2008 AGILE reported the detection of a variable -ray flux with a peak flux density above the maximum reported from EGRET (Chen et al., 2008). S5 0716+714 is also on the Fermi-LAT bright source list (Abdo et al., 2009). Observations at VHE -ray energies by HEGRA resulted in an upper limit of F( photons/cm2/s (Aharonian et al., 2004). In this paper we present the first detection of VHE -rays from S5 0716+714. It is the third optically triggered discovery of a VHE -ray emitting blazar by MAGIC.
2 Observations
The MAGIC (Major Atmospheric Gamma-ray Cherenkov) telescope is a standalone imaging atmospheric Cherenkov telescope located on the Canary Island of La Palma. MAGIC has a standard trigger threshold of 60 GeV for observations at low zenith angles, an angular resolution of on the event by event basis and an energy resolution above 150 GeV of (see Albert et al., 2008a, for details).
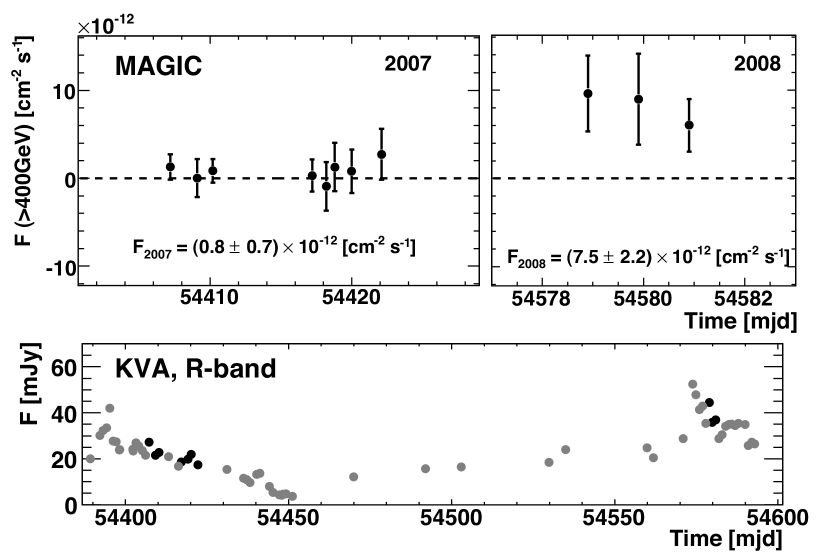
The Tuorla blazar monitoring program444http://users.utu.fi/kani/1m (Takalo et al., 2007) monitors S5 0716+714 on a nightly basis using the KVA 35 cm telescope at La Palma555http://tur3.tur.iac.es/ and the Tuorla 1 meter telescope. At the end of October 2007 (22th, MJD=54395) the optical flux had more than doubled (from 19 mJy to 42 mJy) in less than a month and, according to a predefined criteria MAGIC was alerted. Due to moon and weather constraints, the MAGIC observations started 11 days later, when the optical flux had already decreased significantly (see Fig. 1). The observations were performed in the wobble mode (Daum et al., 1997) pointing deg offset from the source to enable simultaneous estimation of the background from the same field of view. MAGIC observed the source during 14 nights for a total of 16.8 hours. During some nights the observing conditions were rather poor and the affected data were rejected from the analysis. The exposure time for good quality data amounts to 10.3 hours. The zenith angle range of these observations was from 42 to 46 degrees.
In April 2008 a new bright and fast optical flare occurred. The optical flux almost doubled within three nights (14th of April, MJD=54570: 29 mJy, 17th April: 52 mJy), and at 17th of April reached its historical maximum value. MAGIC started the observations 5 nights later, when the moon conditions allowed. The source was observed during 9 nights with zenith angles from 47 to 55 degrees for a total of 7.1 hours. Unfortunately, during the last 6 nights of the observations there was strong calima wind carrying fine sand from Sahara desert and these data were, therefore, of bad quality and rejected from the analysis. The total exposure time of good quality data for this observation period amounts to only 2.8 hours. The total live time of S5 0716+714 MAGIC observations in 2007 and 2008 after data quality cuts was 13.1 hours.
3 Data Analysis and Results
The MAGIC data were analyzed using the standard analysis chain as described in Albert et al. (2008a, b); Aliu et al. (2009). In order to suppress the background showers produced by charged cosmic rays, a multivariate classification method known as Random Forest is used (Albert et al., 2008c). For every event, the algorithm takes as input a set of image parameters, and produces one single parameter as output, called Hadronness. The background rejection is then achieved by a cut in Hadronness, which was optimized using Crab Nebula data taken under comparable conditions.
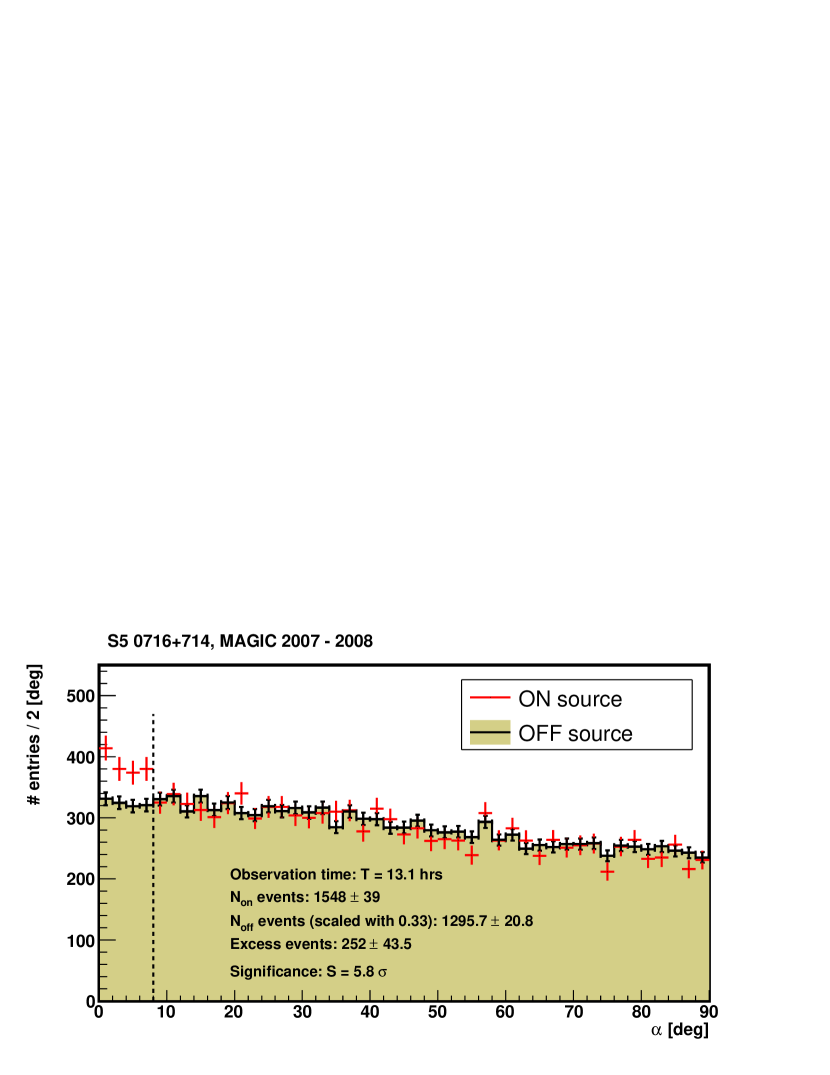
The cut in Alpha that defines the signal region was also optimized in the same way. An additional cut removed the events with a total charge of less than 200 photoelectrons (phe) in order to assure a better background rejection. We used standard cuts in Hadronness and Alpha, which are determined to give the best significance for a point-like source with a flux on the 10% level of the Crab Nebula flux. For the given cuts and the relatively large zenith angles of the observations the analysis threshold corresponds to 400 GeV. The resulting Alpha distribution after all cuts for the overall S5 0716+714 data sample in 2007 – 2008 is shown in Fig. 2. An overall excess of 252 -like events corresponding to a significance of was found (following Eq. 17 in Li & Ma (1983), Non = 1548, Noff = 3887, alpha = 0.33). Most of the signal comes from the 2008 data sample: the analysis of the 2008 data alone results in 176 excess events over 422 background events corresponding to . From the 2007 data alone an excess corresponding to was found.
The day-by-day light curve as measured by MAGIC data is shown in Fig. 1 (upper panel) together with the optical KVA light curve (lower panel). In November 2007 the MAGIC flux above 400 GeV is at , whereas the flux is about 9 times higher in 2008: . No significant variability is seen on time scales shorter than 6 months. Given the limited effective exposure times these observations are not sensitive to variability on shorter time scales. The individual MAGIC points would have low significance, and an intra-night variability by a factor of at least ten would have been required to detect it. In the optical band, instead, a clear variability on time scales from days to months is visible with two distinct flares: the first in October 2007, and the second in April 2008 (Fig. 1, lower panel).
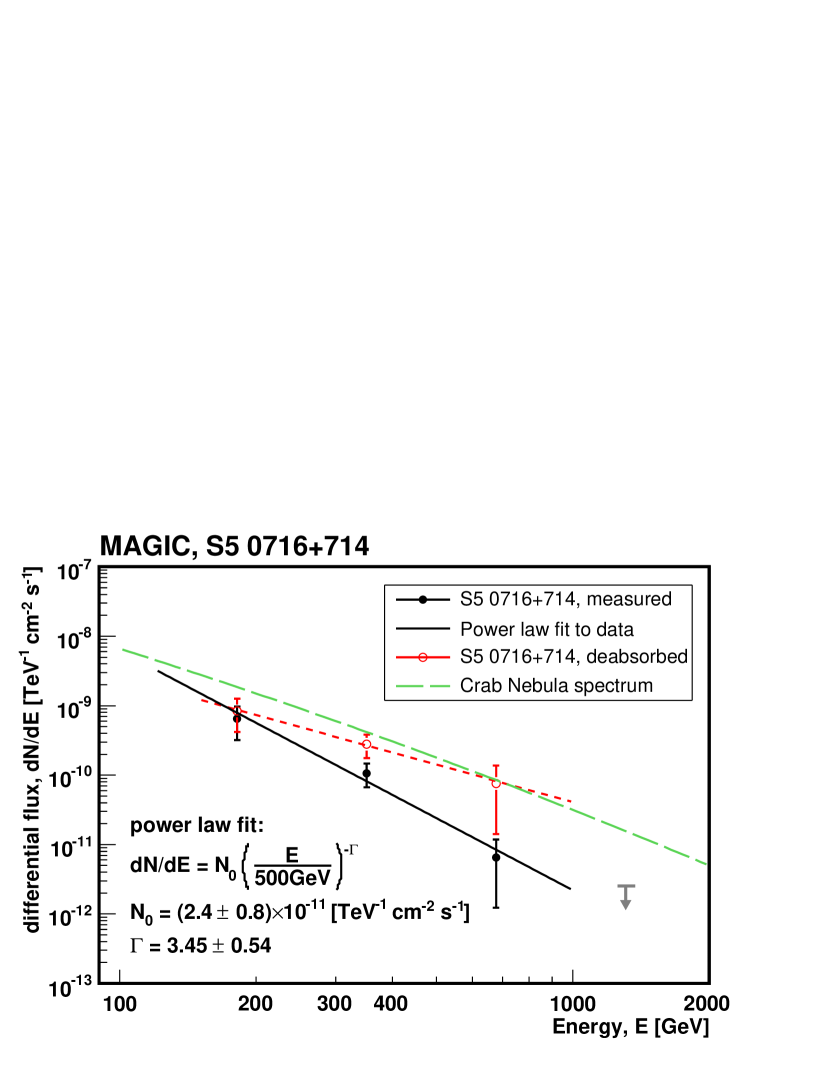
The differential energy spectrum is calculated only for the April 2008 data set. The measured and unfolded for detector effects (Albert et al., 2007c) spectrum is shown in Fig. 3. The data point at TeV has a significance below 1 and was, therefore, converted into an upper limit corresponding to a 95% confidence level. The measured spectrum can be well fitted by a simple power law (with the differential flux given in units of TeV-1 cm-2 s-1):
| (1) |
The errors are statistical only. The systematic uncertainties are estimated to be 0.2 on the photon index and 30% on the absolute flux level. Due to the energy-dependent attenuation of VHE -rays with low-energy photons of the extragalactic background light (EBL, Gould & Schréder, 1967), the VHE -ray flux of distant sources is significantly suppressed. We calculated the deabsorbed, i.e. intrinsic, spectrum of S5 0716+714 using an EBL model of Franceschini et al. (2008) and assuming a redshift of . The resulting intrinsic spectrum (shown in Fig. 3, red points) has a fitted photon index of , which is well within the range of other extragalactic sources measured so far.
As the source redshift is still uncertain, we used the MAGIC spectra to calculate upper limits to the redshift. We assumed two different maximum values for a possible hardness of the intrinsic spectrum: 1.5, being a canonical value for a -ray spectrum emitted by electrons with a spectral index of 2.0; and 0.666, being the limiting case for a -ray spectrum emitted by a monoenergetic electron distribution. Using the method described in Mazin & Goebel (2007) we obtain the following upper limits for the redshift: (for an assumed intrinsic spectrum with a power law photon index of 1.5) and (for an assumed intrinsic spectrum with a power law photon index of 2/3). Both limits agree with the redshift determined from the host galaxy detection () and from the spectroscopy of 3 nearby galaxies ().
4 Discussion
MAGIC observed the blazar S5 0716+714 in November 2007 and April 2008, the observations resulting in the discovery of a very high energy -ray excess with a significance of . During the November 2007 MAGIC observations the average optical flux was mJy, while in April 2008 the optical flux was mJy. The same trend is also visible in the MAGIC data: the flux in April 2008 is significantly higher than in November 2007. This seems to support the indication seen in previous MAGIC observations for other BL Lac objects Albert et al. (2006, 2007a, 2007b), that there is a connection between optical high states and VHE -ray high states.
In April 2008 S5 0716+714 was also in a historical high state in X-rays (Giommi et al., 2008b) and the optical polarization angle started to rotate immediately after the optical maximum had been reached (Larionov et al., 2008). However, the radio flux at 37 GHz did remain at a quiescent level (A. Lähteenmäki, priv.comm). This energy dependent behavior is very similar to the one seen in BL Lac in 2005, which was attributed to an emission feature moving in a helical path upstream of the VLBA core (Marscher et al., 2008). The high VHE -ray flux of S5 0716+714 observed by MAGIC might originate from such a moving emission feature, but a more detailed study of the multiwavelength light curves from spring 2008 are needed to confirm this.
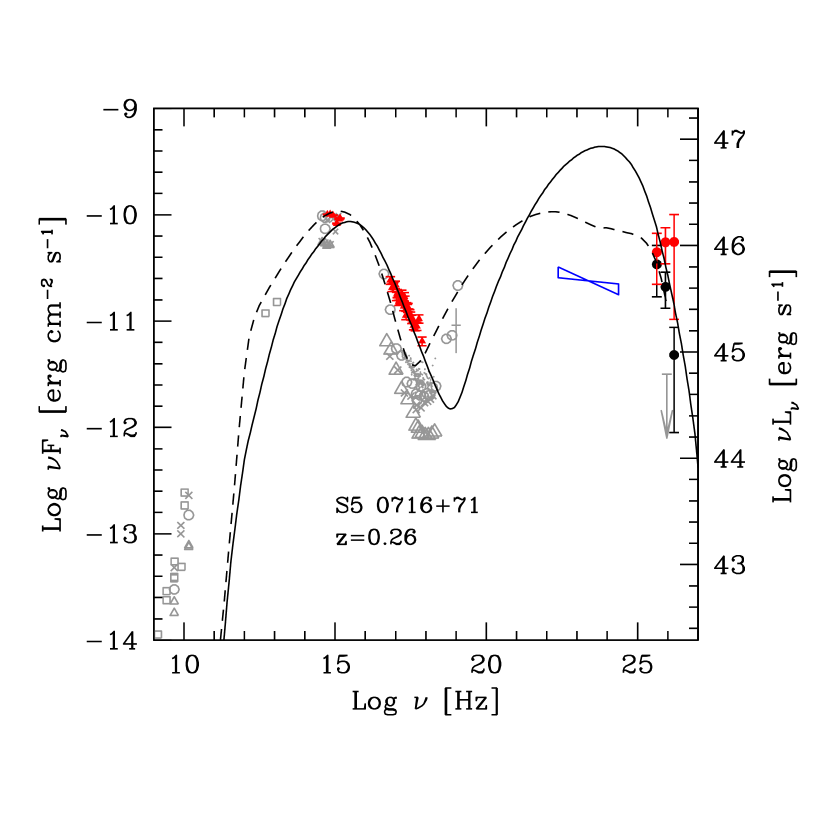
We tried modeling the SED with a one-zone synchrotron self Compton (SSC) model with relativistic electrons following a smoothed broken power law energy distribution (see Tavecchio et al. (2001) for a full description). The fit parameters are: the minimum electron energy , the break energy in the electron spectrum , the maximum electrom energy , the electron spectral index below and above the break energy , , respectively, the magnetic field , the normalization factor , the radius of the emitting region and the Doppler factor . To account for the observed TeV flux corrected for intergalactic absorption the model (continuous line in Fig. 4) predicts a high intensity peak in the 10 GeV range. Although the source was flaring in optical at the time of the MAGIC detection, such high -ray flux (more than 10 times larger than observed by EGRET and Fermi, open blue bow-tie in Fig. 4) appears somewhat implausible. Therefore, we also considered the emission from a structured jet, modeled as a fast ”spine” surrounded by a slower moving ”layer” (Ghisellini et al., 2005). Photons emitted by the layer are subject to IC scattering by the relativistic electrons of the spine thus introducing an additional contribution to the IC spectrum at energies higher than SSC can reach. The computed model is shown as a dashed line in Fig. 4. The GeV excess is substantially reduced and the spectral shape in the -ray domain is consistent with the spectral indices measured at both GeV and TeV energies, though with presumably different intensity states.
The discovery of high flux of VHE -rays by MAGIC from the blazar S5 0716+714 in April 2008 should be compared to detailed light curves from other wavelengths (radio, optical and X-rays) as well as VLBA maps and optical polarization light curve in order to further investigate the origin of this interesting event.
Acknowledgement
We would like to thank the Instituto de Astrofisica de Canarias for the excellent working conditions at the Observatorio del Roque de los Muchachos in La Palma. The support of the German BMBF and MPG, the Italian INFN and Spanish MICINN is gratefully acknowledged. This work was also supported by ETH Research Grant TH 34/043, by the Polish MNiSzW Grant N N203 390834, and by the YIP of the Helmholtz Gemeinschaft. The authors would also like to thank the anonymous referee for the valuable comments and suggestions, which help to improve the paper.
References
- Abdo et al. (2009) Abdo, A. et al. (the Fermi LAT Collaboration) 2009, arxiv:0902.1559
- Aharonian et al. (2004) Aharonian, F. et al. (the HEGRA Collaboration) 2004, A&A, 421, 529
- Albert et al. (2006) Albert, J. et al. (the MAGIC Collaboration) 2006, ApJ, 648, L105
- Albert et al. (2007a) Albert, J. et al. (the MAGIC Collaboration) 2007a, ApJ, 667, L21
- Albert et al. (2007b) Albert, J. et al. (the MAGIC Collaboration) 2007b, ApJ, 666, L17
- Albert et al. (2007c) Albert, J. et al. (the MAGIC Collaboration) 2007c, Nucl. Instr. Meth. A 583, 494
- Albert et al. (2008a) Albert, J. et al. (the MAGIC Collaboration) 2008a, ApJ, 674, 1037
- Albert et al. (2008b) Albert, J. et al. (the MAGIC Collaboration) 2008b, Nucl. Instr. Meth. A, 594, 407
- Albert et al. (2008c) Albert, J. et al. (the MAGIC Collaboration), 2008c, Nucl. Instr. Meth. A, 588, 424
- Aliu et al. (2009) Aliu, E. et al. (the MAGIC Collaboration), 2009, Astropart. Phys., 30, 293
- Bloom & Marscher (1996) Bloom, S. D. & Marscher, A. P. 1996, ApJ, 461, 657
- Chen et al. (2008) Chen, A. W. et al. 2008, A&A, 489, 37
- Daum et al. (1997) Daum, A. et al. (The HEGRA Collaboration), 1997, Astropart. Phys., 8, 1.
- Dermer & Schlickeiser (1993) Dermer, C. D. & Schlickeiser, R. 1993, ApJ, 416, 458
- Franceschini et al. (2008) Franceschini, A., Rodighiero, G., & Vaccari, M. 2008, A&A, 487, 837
- Giommi et al. (2008a) Giommi, P. et al. 2008a, A&A, 487,49
- Giommi et al. (2008b) Giommi, P. et al. 2008b, ATel 1495
- Ghisellini et al. (2005) Ghisellini, G., Tavecchio, F., Chiaberge, M., 2005, A&A, 432, 401
- Gould & Schréder (1967) Gould, R. J. and Schréder, G. P. 1967, Physical Review 155, 1408
- Hartman et al. (1999) Hartman, R. C. et al. 1999, ApJS, 123, 79
- Larionov et al. (2008) Larionov, V. et al. 2008, ATel 1502
- Li & Ma (1983) Li,T.-P., and Ma, Y.-Q., 1983, ApJ, 272, 317.
- Mannheim (1993) Mannheim, K. 1993, A&A, 269, 67
- Maraschi et al. (1992) Maraschi, L., Ghisellini, G. & Celotti, A. 1992, ApJ, 397, L5
- Marscher et al. (2008) Marscher, A. P. et al. 2008, Nature, 452, 966
- Mazin & Goebel (2007) Mazin, D. & Goebel, F. 2007, ApJ, 655, L13
- Mücke et al. (2003) Mücke, A. et al. 2003, APh, 18, 593
- Nieppola et al. (2006) Nieppola, E., Tornikoski, M., Valtaoja, E. 2006, A&A, 445, 441
- Nilsson et al. (2008) Nilsson, K. et al. 2008, A&A, 487, L29
- Padovani et al. (1995) Padovani, P., Giommi, P. 1995, MNRAS, 277, 1477
- Padovani (2007) Padovani, P. 2007, Ap&SS, 309, 63
- Stickel et al. (1993) Stickel, M., Fried, J. W. & Kuehr, H. 1993, A&AS, 98, 393
- Takalo et al. (2007) Takalo, L. O. et al. 2007 ASP Series, 373, 249
- Tavecchio et al. (2001) Tavecchio, F. et al. 2001, ApJ, 554, 725
- Tavecchio & Ghisellini (2009) Tavecchio, F., Ghisellini, G. 2009, MNRAS, 394, 131
- Teshima et al. (2008) Teshima, M. (for the MAGIC Collaboration) 2008a, ATel 1500
- Villata et al. (2008) Villata, M. et al. 2008, A&A, 480, 339
- Wagner et al. (1996) Wagner, S. J. et al. 1996, AJ, 111, 2187