Multiple dynamic regimes in concentrated microgel systems
Abstract
microgels, soft colloids, glasses, jamming, heterogeneous dynamics, photon correlation imaging
We investigate dynamical heterogeneities in the collective relaxation of a concentrated microgel system, for which the packing fraction can be conveniently varied by changing the temperature. The packing fraction dependent mechanical properties are characterised by a fluid-solid transition, where the system properties switch from a viscous to an elastic low-frequency behaviour. Approaching this transition from below, we find that the range of spatial correlations in the dynamics increases. Beyond this transition, reaches a maximum, extending over the entire observable system size of . Increasing the packing fraction even further leads to a second transition, which is characterised by the development of large zones of lower and higher dynamical activity that are well separated from each other; the range of correlation decreases at this point. This striking non-monotonic dependence of on volume fraction is reminiscent of the behaviour recently observed at the jamming/rigidity transition in granular systems (Lechenault et al. 2008). We identify this second transition as the transition to ‘squeezed’ states, where the constituents of the system start to exert direct contact forces on each other, such that the dynamics becomes increasingly determined by imbalanced stresses. Evidence of this transition is also found in the frequency dependence of the storage and loss moduli, which become increasingly coupled as direct friction between the particles starts to contribute to the dissipative losses within the system. To our knowledge, our data provide the first observation of a qualitative change in dynamical heterogeneity as the dynamics switch from purely thermally-driven to stress-driven.
1 Introduction
Soft deformable colloids, such as foam bubbles, emulsion droplets, star polymers and microgels can be efficiently packed beyond the close packing conditions of hard spheres. At such high packing fraction, the constituents of the system touch each other, exerting direct forces on each other, which results in their deformation. Consequently we expect the dynamics in such a ‘squeezed’ state to be mainly determined by force balances. Any imbalance in the forces, i.e. stresses, will lead to motion and thus to reconfiguration of the system. Indeed, we can presume that the dynamics of deformable spheres is predominantly determined by either stress-imbalances or temperature depending on their packing fractions, and the goal of this work is to assess some of the differences between stress-driven and thermally-driven dynamics. Our investigation is motivated by the assumption that the high packing fraction behaviour of repulsive deformable spheres is determined by two critical conditions: a) the glass transition at which the particles become so densely packed that the diffusion of the particles past their nearest neighbours becomes highly improbable on an experimental time scale and b) the jamming transition at which the particles are jammed together, forming a network of direct contacts. That both transitions may be significant can be inferred from the combined datasets obtained by respectively Meeker et al. (1997) and Mason et al. (1995).
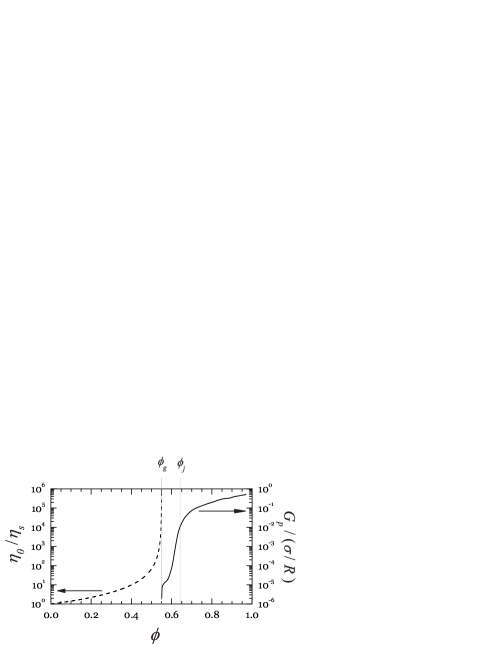
Meeker et al. (1997) investigated the low shear viscosity of hard sphere colloidal systems. According to their investigations, the low shear viscosity exhibits an apparent divergence at the experimental glass transition , where they find that an unconstrained fit of the Krieger-Dougherty equation, , to their data yield the parameters and , where is the viscosity of the background medium; these fit results are shown as a dashed line in fig. 1. Mason et al. (1995) investigated the elasticity of dense emulsions beyond ; the volume fraction dependence of the elastic modulus normalized by the ratio of the surface tension to droplet radius is shown as a solid line in fig. 1. According to their investigations, the volume fraction dependence is determined by both the experimental glass transition at and the jamming transition at . For , the elasticity increases quickly with increasing volume fraction, while for the elasticity increases approximately linearly with . Reflecting the squeezed nature of the system at very high , the elasticity converges towards the elasticity intrinsic to emulsion droplets, i.e. , for approaching unity (Princen 1983). Inferring that the emulsion droplets would behave like the hard sphere system below the glass transition, we therefore expect three states for a deformable sphere: at the system behaves like a supercooled fluid, at the system is in a glassy state, at the system is in a squeezed state.
In this paper we present our work on the dynamics of thermosensitive microgels, as an example of deformable spheres, and we show that these three states are characterised by a distinct behaviour of dynamical heterogeneity. More precisely, spatial correlations of the dynamics are relatively short-ranged and of small amplitude in the supercooled state, grow dramatically in the glassy state, where they span the whole system, and finally become more localized, but of large amplitude, in the squeezed state.
2 Sample characteristics: conformational and mechanical properties
We use aqueous solutions of poly-N-isopropylacrylamide (PNiPAM) microgels, which exhibit a lower critical solution temperature (LCST) at (Senff & Richtering 1999). Below the LCST, the dimensions of our PNiPAM microgels exhibit a remarkable sensitivity to temperature, which enables us to vary the volume fraction of a given system by a factor of 1.7 by varying the temperature from to . Though very convenient for the study of the high volume fraction behaviour, working with microgel solutions calls for some caution, if the aim is to compare their behaviour to other soft sphere systems like foams and emulsions. Indeed, microgel solutions are solutions and not dispersions; they are in thermodynamic equilibrium with the solvent and do not possess a well defined interface. They thus can partly interpenetrate and/or compress under their own osmotic pressure. Despite this enhanced difficulty, their unique temperature sensitivity bears two main advantages: the volume fraction can be varied by changing the temperature and, more importantly, the sample history can be controlled uniquely by temperature, with no need to apply a preshear to the sample, as is typically required by colloidal systems. Indeed, the study of the dynamics of highly concentrated systems, in particular of glassy and squeezed systems, can tremendously suffer from an ill-controlled history of the sample. The thermosensitive microgel systems offer the unique advantage to allow for the preparation of the system in a fluid-like state at low volume fraction (high temperature), which is subsequently quenched to the solid-like states by inflating the particle (decreasing the temperature), so as to obtain a higher volume fraction. This protocol is not only convenient to use in almost any experimental set-up, it is to a certain extent more meaningful than the application of a high shear stress or rate, which is generally used to erase the sample history (Cloitre et al. 2000; Rogers et al. 2008). Indeed, the application of shear imposes a directional deformation to the system, while the isotropic inflation of the particles results in randomly oriented stresses i.e. strains.
Our PNiPAM-microgels are synthesized as described by Senff & Richtering (1999) and purified by extensive dialysis against water. We subsequently produce a highly concentrated stock solution by evaporating water at a temperature of and reduced pressure using a rotary evaporator. This stock solution is then used to produce more dilute samples. The actual concentration of the stock is determined by drying a defined solution volume and determining the residual amount of microgels to obtain both a concentration in weight% and a concentration in g/ml, where the latter is defined relative to the solution volume at a room temperature of . Due to the use of an ionic initiator, our microgels are charged. To screen these charges, we add a solution of sodium-thiocyanate, NaSCN, to all our PNiPAM solutions, so that the final salt concentration in our systems is .
We characterise the temperature dependent conformational properties of our microgels at a concentration of by static and dynamic light scattering using a commercial light scattering apparatus. We characterise both salt-free and salted microgel solutions to ascertain that the salt does not significantly change the solubility of the microgels. Both systems exhibit essentially the same temperature dependence for smaller than the lower critical solution temperature . Increasing the temperature leads to a gradual decrease of the particle size up to , where we find that the temperature dependence of the hydrodynamic radius and the radius of gyration is well approximated by a critical-like function of form . The resulting fit parameters for are , , and ; for , we find , , and . In agreement with previous investigations on similar PNiPAM-microgels, the hydrodynamic radius is significantly larger than the radius of gyration for (Senff & Richtering 2000; Clara Rahola 2007). This is due to the uneven distribution of cross-linkers, the cross-linking density being larger in the centre of the microgels than on the edges (Mason & Lin 2005). Because of the higher density of the core, the core scatters significantly more than the lower density edges, such that we essentially measure the radius of the highly cross-linked core in static light scattering, while we capture the hydrodynamically effective radius of the particle in dynamic light scattering. As the temperature approaches the critical solution temperature, the overall density of the microgel increases, such that approaches . Beyond the LCST, the characterisation of the microgel dimensions is only possible for the salt-free solution, where the unscreened charges of the particles prevent aggregation. In this range of temperature we find that , near the value expected for hard sphere colloids (Dhont 1996).
Near the LCST, a change in temperature affects both intra- and inter-molecular interactions of the microgels (Wu et al. 2003). To assess the range of temperatures at which a change in temperature will only inflate or deflate the particle but will not significantly alter the inter-particle interactions, we determine the temperature dependence of the low shear viscosity of microgel solutions in the range of concentrations of to . Our rheological measurements are performed in the lower concentration range ( to ) with an Ubbelohde viscometer; in the higher concentration range ( to ) we use a commercial stress-strain rheometer equipped with a cone and plate geometry (cone and plate radius , cone angle ). To ensure the best possible temperature control and to avoid evaporation in the rheometer, we use a temperature hood combined with a solvent trap (Sato & Breedveld 2005). This guarantees that our samples will not exhibit evaporation-induced changes over an experimental time window of 2–3 hours. At higher concentrations, the history of our samples is carefully controlled using the following protocol: the samples are equilibrated in a fluid state at , where we additionally apply a shear rate of to fully erase any previous quench history. The temperature is then decreased to the desired temperature and equilibrated at this temperature for prior to any experiment, where we have tested that our systems do not exhibit any significant changes in their rheological properties beyond this waiting time.
The low shear viscosity is determined in shear rate experiments, where we ramp the shear rate from – , depending on temperature and microgel concentration. For each shear rate, we maintain for a sufficiently long time to allow for the system to reach steady state. The steady state viscosity exhibits a shear rate dependence that is typical of colloidal suspensions. At low concentrations and high temperature, we find that exhibits almost no dependence on ; in these cases we determine as the mean of , . At higher concentrations and lower temperatures the system exhibit shear thinning behaviour; in these cases we obtain by fitting to the Cross-equation,
| (1) |
where is the high shear viscosity and is a measure of the crossover shear rate denoting the onset of shear thinning.
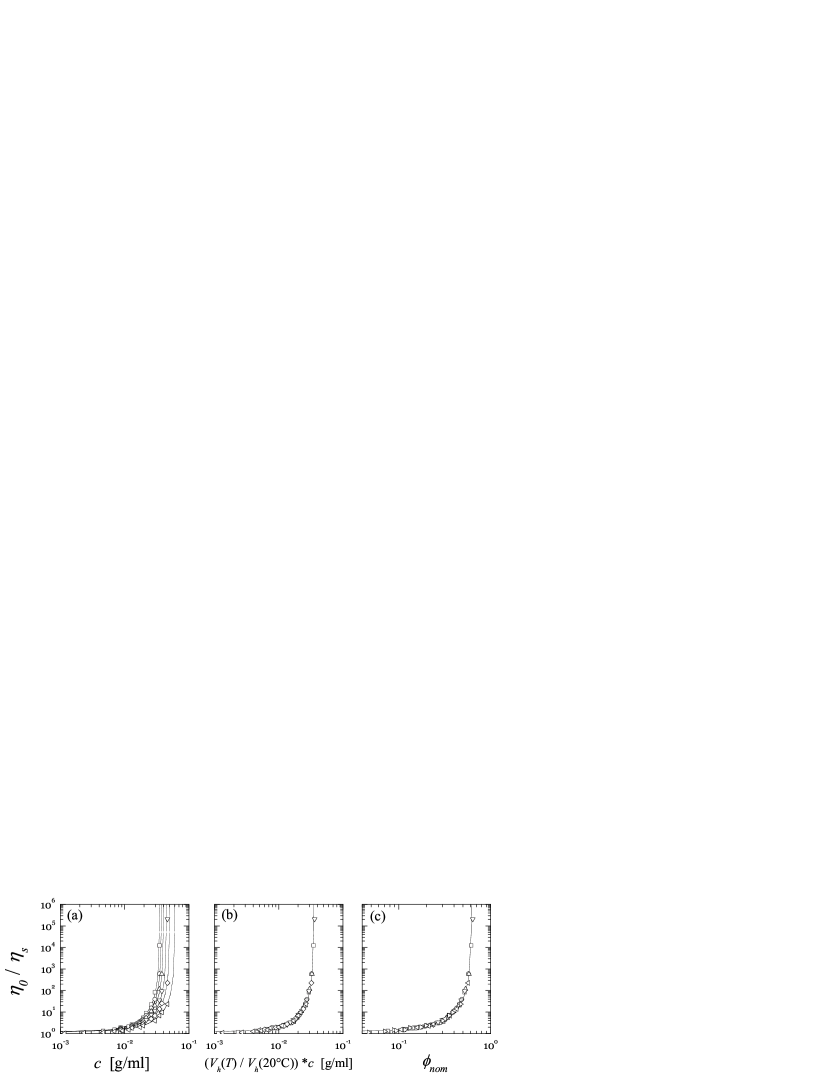
In fig. 2(a) we report the relative viscosity as a function of concentration . The measurements are performed at temperatures ranging from to . Our data exhibit distinct variations as the temperature is changed. At any given temperature, we find that increases dramatically with concentration, exhibiting a critical-like divergence at some critical concentration. This critical concentration systematically shifts to higher values as the temperature is increased. That this behaviour is entirely due to the change in the particle volume is shown in fig. 2(b). A simple renormalisation of the concentration by the ratio collapses the data onto a single master curve, where we use as a reference volume, such that the concentration axis refers to the one obtained at . This almost perfect collapse demonstrates the equivalence between varying the volume fraction by changing the particle concentration and varying the volume fraction by changing the particle volume via temperature (Senff & Richtering 1999, 2000). For our microgels, this equivalence holds up to ; for temperatures larger than , the concentration dependence of the viscosity exhibits deviations from the scaling behaviour, reflecting a change in the particle-particle interactions. Our master-curve is well approximated by a critical-like function, , with a critical concentration of and a critical exponent of . To express concentrations in terms of volume fractions, we assume a voluminosity of for our systems at , which we use to define a nominal volume fraction according to . This voluminosity is chosen based on different mapping techniques, including the one where the low concentration dependence of is mapped to the behaviour expected for hard spheres (Senff & Richtering 1999, 2000). However, we find that different approaches can lead to a variation in of almost 20%, such that the indicated nominal volume fraction can only be regarded as an approximate gauge of the volume fraction. Nonetheless, for convenience we use instead of to indicate our concentrations. For the concentration and temperature dependence of this results in the dependence shown in fig. 2(c), where the critical divergence according to occurs at .
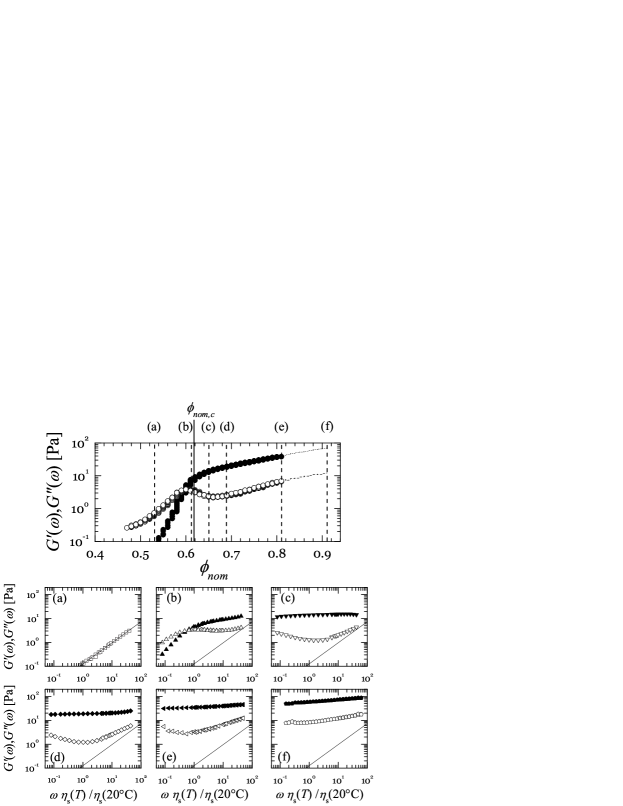
For our study of the states below and above the apparent divergence of the viscosity, we choose to investigate our microgel system at a concentration of ; this system covers the nominal volume fraction range in the temperature range . To gain insight in the temperature-dependent mechanical behaviour of this system, we perform an oscillatory shear experiment at a fixed angular frequency () and fixed strain (), ramping the temperature from to at a rate of , where we ensure that the strain of is well within the linear viscoelastic regime at all temperatures investigated. Converting concentration and temperature into nominal volume fractions enables us to report the -dependence of the loss modulus and storage modulus in fig. 3, where we indicate the critical condition obtained from the divergence of the low shear viscosity as a solid vertical line. In the volume fraction range below , we find that initially dominates over ; with increasing , increases more quickly than and eventually dominates over . Indeed, upon approach of the critical conditions we expect the characteristic relaxation time to increase dramatically. Accordingly, the characteristic frequency denoting the cross-over from the high frequency elasticity behaviour to the low frequency viscous behaviour systematically shifts to lower frequencies. In a test where we probe the mechanical response at a given frequency, we thus expect to observe a transition from a regime in which dominates, to a regime in which dominates, consistent with the observed behaviour.
That our system indeed undergoes a fluid to solid transition at can be seen in the development of the frequency dependent responses of this system as the temperature is decreased. At (; fig. 3(a)) the material response function is essentially determined by viscous losses; increases nearly linearly with frequency, the magnitude of is consistent with the low shear viscosity measured in steady shear experiments. Decreasing the temperature to (; fig. 3(b)), the material response function exhibits the typical features of a viscoelastic fluid; the response is characterised by a cross-over frequency beyond which is the dominating modulus, while is dominating over at lower frequencies. Decreasing the temperature further to (; fig. 3(c)) finally leads to a response which is typical for soft glassy materials: is dominating over in the entire frequency range investigated and is nearly frequency independent; exhibits a minimum, indicative of some residual slow relaxation process.
Beyond , increases with increasing , where we can take (, shown in the main graph of fig. 3, as a measure of the plateau modulus . Though the increase in does not exhibit any further characteristic feature that may indicate a change in the samples mechanical properties, the frequency dependence of and qualitatively changes as we increase beyond . To better capture this change, we extend our investigations to a microgel sample with . The results obtained from the temperature ramp from to are shown as dashed underlying lines in fig. 3, demonstrating the extension of the concentration range to . By increasing the from 0.69 (fig. 3(d)) to 0.81 (fig. 3(e)) to 0.91 (fig. 3(f)), we observe that the difference between and decreases with increasing ; the minimum in gradually disappears; at and exhibit essentially the same frequency dependence. Moreover, while the loss modulus in the high frequency range has a similar magnitude in the investigated range of , they significantly increase beyond . To show this, we report in fig. 3(a)-(f) the fit describing the data at , where we account for the temperature dependence of the background viscosity by normalising the frequencies with , the ratio of the solvent viscosity at the experimental temperature to the one at .
The change in the shape of the material response function in conjunction with the increase of the loss modulus in the high frequency range seemingly indicates that for the migrogels are in a different state. We tentatively interpret this change as a hallmark of the transition to a ‘squeezed’ state, where the particles are in direct contact. In this state, the dissipative losses at high frequencies are no longer primarily determined by the hydrodynamics of individual particles, but by the direct friction of particles against another. As the direct contact forces not only determine the friction, but also the elastic modulus, the storage and the loss moduli become more coupled to each other and decay together with frequency.
Finally, we want to point out that the observed dependence of on resembles the one of emulsions beyond random close packing (see fig. 1). Thus, we seemingly miss the range where the mechanical behaviour is defined by a strong increase of between and . Such behaviour is in agreement with results obtained for similar PNiPAM-microgels (Senff & Richtering 1999; Senff & Richtering 2000) and related core-shell particles (Senff et al. 1999; Deike et al. 2001; Le Grand & Petekidis 2008). It can be attributed to the fact that microgels and core-shell particles — unlike emulsion droplets — do not have a well defined interface and in fact allow for partial interpenetration and compression (Stieger et al. 2004; Clara Rahola 2007). Deviations from hard sphere behavior are thus expected to occur at lower volume fractions than for systems with well-defined interfaces that allow for deformation only. Indeed, the strong increase of between and has been observed for non-deformable hard sphere colloids (Le Grand & Petekidis 2008). Thus, while emulsions still exhibit hard sphere behaviour between and , the softness of microgels and core-shell particles determines the behaviour over the entire range of volume fraction above .
3 Spatially and temporally resolved collective dynamics
We investigate the collective dynamics of our microgel system with , spanning the transitional range . To obtain the dynamics with temporal and spatial resolution, we use the recently introduced photon correlation imaging (PCIm) technique applied to a small angle light scattering experiment as described by Duri et al. (2009). Coherent laser light with an in vacuo wavelength of illuminates the sample at normal incidence. We use a lens with a focal length of to image the sample onto the detector of a charged-coupled device (CCD) camera. In contrast to normal imaging, we place an annular aperture of radius in the focal plane of the lens, thereby ensuring that only light scattered within a narrow range of angles reaches the detector. The speckled image of the sample is thus formed by the light scattered at a single magnitude of the scattering wave vector, ; in our case . The magnification factor of the image is determined by imaging a finely marked grid. The CCD array comprises , corresponding to a rectangular observation window of approximately within the sample.
To follow the space and time-dependent fluctuations in the dynamics of our system, we record the space-resolved speckle images in time, where we use a camera exposure time of and vary the acquisition rate between and depending on the sample dynamics. Any change of the sample configuration results in a change of the speckle pattern, which we quantify by calculating a space and time resolved intensity correlation function. We divide the full image into regions of interest (ROIs) of corresponding to within the sample. The local degree of correlation between two images taken at time and and for a ROI centered around the position is calculated according to:
| (2) |
The quantity is the intensity measured at a single pixel, represents an average over pixels belonging to a ROI centered in , and the coefficient is a coherence factor that depends on the speckle to pixel size ratio (Goodman 1984); it is chosen so that for . The spatially averaged but time-resolved degree of correlation, , is obtained by taking the averages over a single ROI encompassing the full image. A further average over time yields the usual intensity correlation function measured in traditional dynamic light scattering: , where denotes an average over . The spatially resolved information on the change of configuration between and can be conveniently visualized by constructing a “dynamic activity map (DAM)”. Representative dynamical activity maps of our sample at different temperatures are shown in fig. 7; a physical interpretation of these maps will be given later. Each metapixel of the dynamical activity map corresponds to a ROI and its colour symbolises the local degree of correlation, which we indicate in units of the standard deviation of , (Duri et al. 2009).
To control the temperature, we confine our microgel solution between two sapphire windows, where a metal spacer of thickness between the two windows determines the sample thickness along the optical axis. Square thermoelectric (Peltier) heaters with a central hole are affixed directly to the sapphire windows to serve as a heat source. Rejected heat from the Peltier elements is removed through contact with large aluminum blocks cooled by external water circulation; these heat sinks have, like the Peltier elements, a central hole placed along the optical axis to allow the light to pass the sample. A digital PID temperature controller controls the current output to the thermoelectric devices, where we use a thermistor inserted into the sample as a temperature probe. Once the temperature set point is reached, the control is extremely stable; the sample temperature is recorded during the experiments and the fluctuations rarely exceed . All interfaces are lightly coated with a thermal grease to ensure efficient heat transfer.
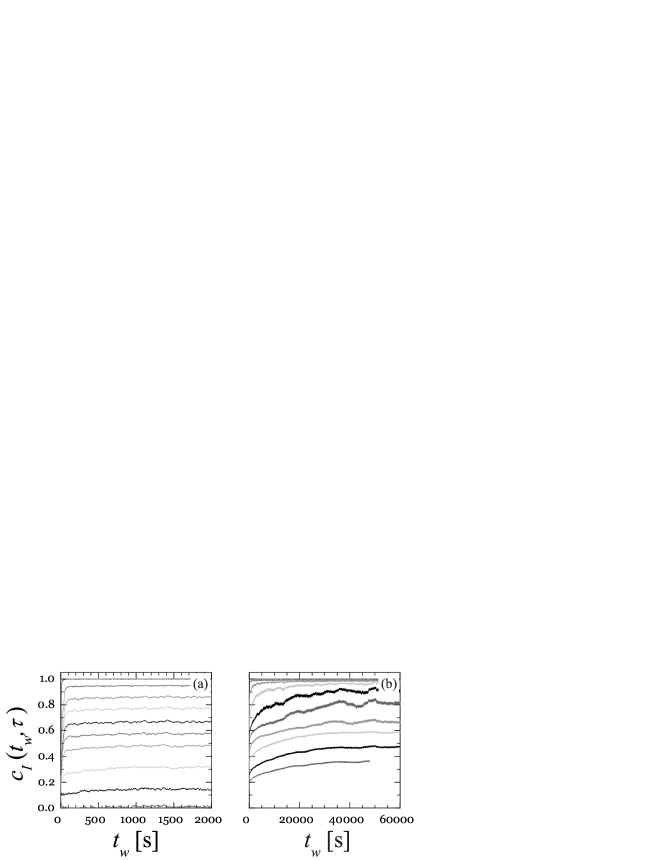
Prior to any experiment, our sample is equilibrated at to ensure full fluidization as a starting condition. The moment we lower to the desired experimental temperature is defined as . The temperature is typically stabilized at the set temperature within 50–100s, depending on the temperature difference between starting and set temperature. We follow the evolution of the dynamics of our samples by recording the speckle pattern, subsequently calculating the spatially averaged instantaneous degree of correlation at different lag times. Representative examples of the evolution after the quench for respectively (, ) and (, ) are shown in fig. 4(a) and (b). In both cases increases after the quench to then reach a quasi-stationary behaviour, indicating that the system is characterised by a well-defined slow relaxation process for both and . Though this is not surprising for , where the system rheology is defined by a low shear viscosity (fluid-like behaviour), it is somewhat unexpected for , where the system rheology is defined by a low frequency elasticity (solid-like behaviour). Indeed, beyond , we would in principle expect that any residual slow dynamics would continuously evolve with , exhibiting the typical characteristics of ageing solid-like systems (van Megen et al. 1998; Cipelletti et al. 2000; Bandyopadhyay et al. 2004). However, as our particles are deformable we may conceive that relaxation processes via shape fluctuations eventually lead to the quasi-stationary dynamics observed. Though quenches below or above both lead to a quasi-stationary slow dynamics, we find distinct differences in the evolutionary behaviour between the two conditions. While the quasi-stationary behaviour is reached after for , we typically need to wait 20000 – 30000 seconds to reach the quasi-stationary behaviour for . These differences in the waiting time seemingly reflect the differences between the situation in which the system is quenched to a state where the individual particle diffusion is nearly suppressed (supercooled fluid) and the one where the system is quenched to a state where the individual particle diffusion is suppressed (glassy system).
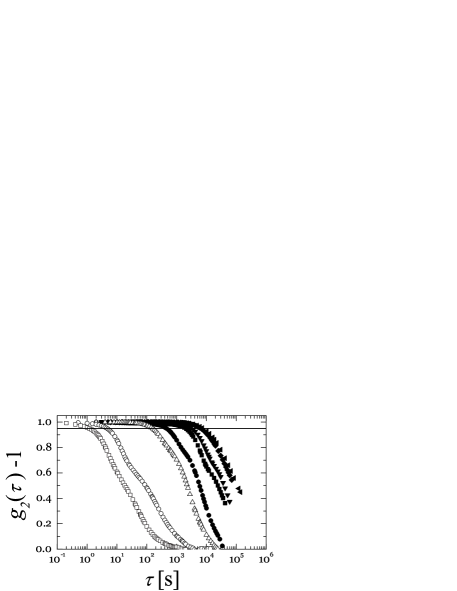
The quasi-stationary dynamics enables us to characterise the mean dynamics of our system at different volume fractions by determining the space and time averaged correlation functions over the time window where we observe the dynamics to be quasi-stationary. As shown in fig. 5, exhibits a strong dependence on ; the characteristic decay times evolve from to within the temperature range investigated. At the lowest temperatures investigated, i.e. the largest nominal volume fractions, the duration of our experiments is insufficient to capture the full decay of the correlation function. To assess the absolute scale of in these experiments we determine the baseline of by calculating the degree of correlation between speckle images taken at and speckle images taken at the set temperature. Indeed, this temperature jump leads to a complete reconfiguration of the system and thus guarantees that our procedure yields the lowest possible degree of correlation, which we use as a measure of the baseline value. As we are working at low , we presume that we capture the entire short time relaxation spectrum within the time window accessible with the camera, such that we normalize the intercept of our correlation functions to one by using the value obtained by extrapolating the short time behaviour to .
The mean correlation functions exhibit a not well developed two-step decay over a wide range of , which we attribute to instabilities in our experimental set-up. Indeed, it is worth recalling that our experiments are performed at low , well within the -range where we probe collective diffusion. Estimating the experimental observational length-scale as , we find that we are probing a length-scale that corresponds to particle diameters. The probed dynamics thus entails fluctuations of the refractive index on length-scales large compared to the particle size. We therefore do not expect to observe the typical features of glassy dynamics probed at length scales comparable to the particle size, where the fast local diffusion of a particle trapped in a cage of nearest neighbours and the slow structural rearrangement of the cage it-self lead to a two-step decay in the intensity correlation function (van Megen & Underwood 1993; van Megen et al. 1998). At low the displacements of the particles diffusing within the cages of nearest neighbours are insufficient to lead to any significant dephasing of the light and thus are not contributing to the decay of the intensity correlation function. Instead, we expect the temporal evolution of the density fluctuations to be the main cause for a decay in at low .
To quantify these dynamics, we choose to focus on the data obtained at lag times where , as marked by the horizontal line in fig. 5. Though somewhat arbitrary, this choice is based on the following considerations. When analyzing the characteristic decay of a correlation function to , we generally consider that the system has to reconfigure on a length scale of . For a significantly smaller amount of dephasing, like the one chosen, we can think of the lengthscale over which things have to reconfigure to be reduced. As mentioned before, is in our experiment rather large, corresponding to particle diameters; by monitoring the fluctuations in with a mean of , we expect to resolve heterogeneities in collective rearrangements on lengthscales smaller than 30 particle diameters. Moreover, in order to have sufficient statistics in , the system has to reconfigure several times over the chosen observational lengthscale. For the largest investigated, the time to reconfigure so that is already of the order of , near to the duration of the experiment; here, the processing of a lower degree of correlation and thus larger lag time is precluded because of the finite duration of our experiment. Finally, the choice of a lag time which is significantly smaller than the characteristic decay time enables us to use the direct noise correction scheme described by Duri et al. (2005, Sec. IVc).
From our -data with a mean of , we extract three quantities that respectively characterise the average dynamics, its temporal fluctuations, and the spatial correlations in the dynamics of our system. The dependence of these quantities on is shown in fig. 6 along with the mechanical characteristics, which we use as a gauge of the transitional behaviour. As a parameter characterising the average dynamics, we determine the lag time at which , . Though significantly increases as is increased, the fluid-solid transition, as defined by the mechanical properties of our system, is not reflected by any pronounced feature in the -dependence of . For the volume fraction range below , the characteristic time strongly increases, while at the transition this increase is somewhat slowed down; for , reaches a constant value.
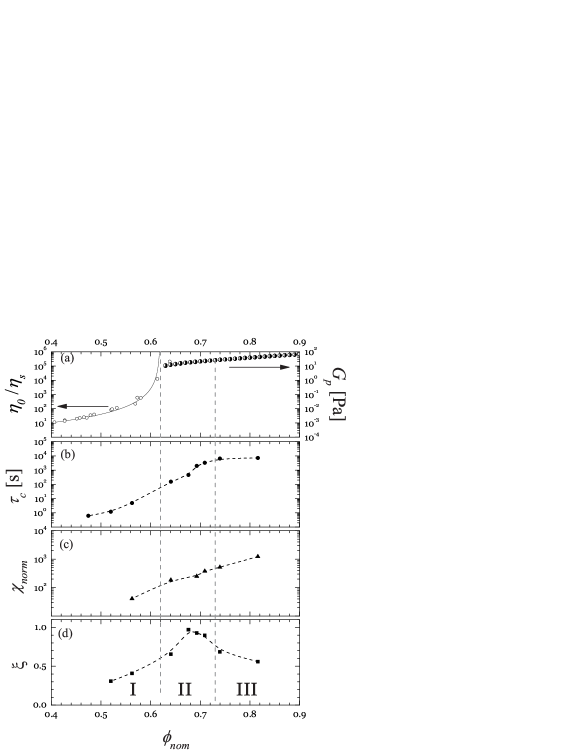
To characterise the temporal fluctuations in the dynamics of our system, we calculate , the temporal variance of , again fixing such that . We recall that is the instantaneous degree of correlation obtained by taking the pixel average in Eq. (2) over the entire image. Thus, quantifies the temporal fluctuations of the spatially averaged dynamics, similarly to the dynamical susceptibility introduced in numerical works on glassy systems (Lačević 2003). To gauge the significance of with respect to the noise stemming from the finite number of speckles recorded, we normalise our data with data obtained in reference measurements, where we use freely diffusing colloidal particles as a model system exhibiting homogeneous dynamics. For the Brownian particles, contains only the noise contribution. Any excess of the variance with respect to the value obtained for the Brownian particles can thus be ascribed to temporally heterogeneous dynamics. For all investigated, the normalised temporal variance is significantly larger than the one expected for homogeneous dynamics, as shown in fig. 6(c); this indicates that the dynamics of our system is characterised by heterogeneities at all volume fractions investigated, temporal heterogeneity becoming more pronounced as the volume fraction increases, as denoted by the increase of with .
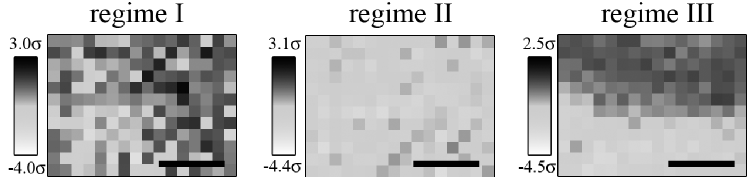
As discussed for instance in Trappe et al. (2007), depends on both the amount of temporal fluctuations of the dynamics at a given location and the range of spatial correlations of the dynamics. To characterise the spatial fluctuations in the dynamics of our system, we process the speckle images calculating the degree of correlation with spatial resolution, . By contrast to the mean dynamics and the temporal variation of the dynamics, the dynamic activity maps obtained from a space-resolved analysis at a lag reveal striking differences depending on whether is below , just above or above , where we identify the three conditions as regime I, regime II, and regime III. At (regime I), the dynamics are characterised by local fluctuations of , which can be visually assessed from the fluctuations of the intensity in the dynamical activity map shown in fig. 7 (left image). These fluctuations appear to be weakly correlated. At (regime II), the DAMs have, at any given time , essentially the same intensity level in all metapixels, as shown in fig. 7 (middle image). This suggests that the dynamics are correlated over distances comparable to the system size. At (regime III), we find large variations in the DAM intensity, with regions of high dynamical activity coexisting with “quieter” zones, as shown in fig. 7 (right image). The boundary between the high and low dynamical activity zones appears to be well defined; these zones typically extend over a sizeable fraction of the field of view, but do not extend over the entire field of view like in regime II. As a further difference between the three regimes, we note that the temporal evolution of the spatial heterogeneities strongly depends on whether we quench the system to regime I, II, or III. While for regime I and II the dynamical activity within one region quickly switches from low to high and vice versa, the dynamic activity within a given zone persists for a long time in regime III.
To quantify the spatial correlations of the dynamics, we calculate the four-point correlation function introduced by Duri et al. (2009). This function compares the local dynamics on a time scale in regions separated by a distance . Its definition is similar to that used in numerical work (Lačević et al. 2003):
| (3) |
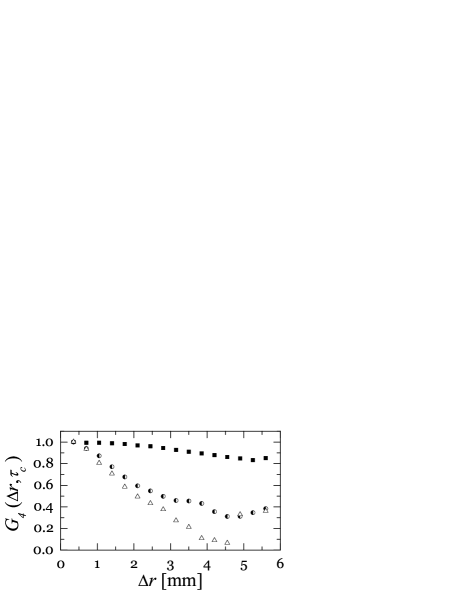
where , is a constant such that for , and is the average over all pairs of and corresponding to the same distance, . As for the other dynamical quantities reported in fig. 6, we analyse for . The spatial correlation functions corresponding to the three regimes shown in fig. 7 are shown in fig. 8.
In regime I, decays over a few metapixels, corresponding to about 2 mm. By contrast, in regime II over the full field of view, implying that the dynamics are almost perfectly correlated over distances at least as large as . In regime III, the range of spatial correlations is reduced, although it remains higher than in regime I. In order to extract a characteristic length describing the range of correlated dynamics, in principle one would fit to some functional form, such as an exponential. While this approach would be sound at the lowest and highest volume fractions investigated, it would fail in regime II, because is essentially flat over the full accessible range of spatial delays. Instead, we introduce a normalized correlation length by defining
| (4) |
where mm is the largest spatial delay accessible in our experiment. This correlation length varies between 0 if the dynamics of distinct metapixel are totally uncorrelated and 1 if the dynamics are perfectly correlated over the full field of view. Reflecting the trend shown by in fig. 8, starts at a low level at low , increases dramatically up to almost unity in regime II and finally decreases in regime III, as shown in fig. 6(d).
Consistent with the growth of observed here in regime I and II, confocal microscopy (Weeks et al. 2007) and dynamic light scattering experiments (Berthier et al. 2005; Brambilla et al. 2009) have shown that for colloidal hard spheres the range of correlated dynamics continuously increases with volume fraction, this increase extending beyond the apparent divergence of the structural relaxation time at the experimental glass transition. However, the correlation length measured here beyond , which we identify as the volume fraction at which the low shear viscosity apparently diverges, is much larger than the one reported for the self-diffusion of hard spheres, where the dynamics are correlated only up to a few particle sizes (Weeks et al. 2007). In this context, it is worth stressing that we do not probe the dynamics on a particle level. Indeed, our experiment is performed at low and a given ROI extends over nearly 2000 particles. Our experiment thus probes the reconfiguration of large spatial density fluctuations and the correlation length measured indicates how zones of higher or lower dynamical activity are correlated with each other; this does not necessarily correspond to the actual number of cooperatively rearranging particles that can be measured in real space experiments. Indeed, spatial correlations that span the whole sample have recently been inferred in a study of the dynamical heterogeneities of xenospheres by diffusing wave spectroscopy (Ballesta et al. (2008)). In this study, Ballesta et al. showed that the correlation length grows with increasing volume fracion to eventually span the whole sample near the maximal packing conditions, in agreement with the behavior observed in regime I and II. For the xenospheres, measurements beyond the maximal packing condition were not possible as the xenospheres are essentially non-deformable. The striking decrease of at volume fractions beyond observed in our system is instead reminiscent of the behavior reported for a 2-dimensional driven granular system (Lechenault et al. 2008), where a non-monotonic dependence in the spatial corrrelation of the dynamical heterogeneities has been observed as well.
Together with these suggestive analogies, our data can be rationalized considering the transition from a situation where the particles are densely packed but do not exert direct contact forces on one another (regime I and II) to a situation where they do (regime III). In regime I (supercooled state) and II (glassy state) the dynamics is purely determined by thermal motion. With increasing volume fraction, the dynamics becomes increasingly cooperative, reaching in regime II a situation where any dynamical activity at a given zone will require the neighbouring zone to be dynamically active as well. By contrast, a quench into regime III (squeezed state) imposes large deformations on the microgels. The dynamic activity observed in this regime is therefore likely to be at least partly due to imbalanced stresses; these lead to rearrangements, which do not appear to equilibrate the stress imbalances. As a result of this the dynamical activity persists in time and elastically propagates in space, albeit remaining well localized, exhibiting sharp boundaries to dynamically inactive zones.
Finally, we note that the almost complete lack of hallmarks in at is somewhat surprising. Indeed, we generally would expect that becomes maximal when is maximal. The increase of beyond indicates that the amplitude in the dynamical fluctuations of the spatially averaged signal dramatically increases beyond , thereby compensating the effect of the decreasing correlation length. A full understanding of this effect in conjunction with the dependence of is the subject of further research.
4 Conclusions
We have characterized the mechanical and dynamical properties of a PNiPAM-microgel system whose dimensions are conveniently varied by temperature. Despite the fact that these microgels do not possess a well-defined interface, allow for partial interpenetration and compression, a remarkable number of the mechanical features of hard and soft, deformable spheres with well-defined interfaces are reproduced. The low shear viscosity appears to critically diverge at some nominal critical volume fraction , which we define as the transition from a ‘supercooled’ to a ‘glassy’ state. As the volume fraction of our microgel system is ill-defined, the indication in terms of nominal volume fractions does not allow for any conclusions with respect to the exact volume fraction at this transition. Moreover, previous work has shown that the lower density shells of our microgels partly interpenetrate near (Clara-Rahola 2007), which adds to the difficulty in precisely assessing the fluid to solid transition observed at . The indication ‘supercooled’ and ‘glassy’ here refer to the inferred conditions that the microgels are able to escape out of a cage of nearest neighbours in the ‘supercooled’ state, while this is not the case in the ‘glassy’ state, where we additionally presume that the microgels do not exert direct contact forces on each other in the ‘glassy’ state. Despite the evident disadvantages in using microgels to investigate the fluid-solid transitions of repulsive systems, the advantage of varying the volume fraction by changing the temperature enables us to precisely control the history of our sample, which we believe prevails over the disadvantages. All our experiments are performed by first equilibrating the system in the fluid state at high temperature, which is then quenched to a given solid state by lowering the temperature. The residual dynamics in the solid-like states are thus not affected by the shear history of the sample other than the one imposed by the inflation of the particles.
We measure this residual dynamics at a -vector where we probe the collective diffusion of our system. Approaching the critical nominal volume fraction from below, we find that the extent of the spatial correlation in the collective dynamics increases, reflecting the increasing constraints set by the increasing volume fraction, whereby a local reconfiguration of the system can only occur when the neighbouring areas also reconfigure. Beyond the range of spatial correlations extends over the entire observational window. The mechanical properties are characterised by a low frequency elasticity; the dissipative losses probed at high frequencies indicates that the local dynamics of the particles are still determined by the hydrodynamics of individual particles. Increasing the volume fraction further, we identify a second transition, the transition to the ‘squeezed’ states. In these states we find that the storage and dissipative contributions in the mechanical properties of the system become increasingly coupled and that the high frequency dissipative losses become significantly larger than the ones observed at lower . We attribute this behaviour to friction between the particles resulting from the fact that the particles exert direct forces on one another. In this state, the dynamics exhibit spatial heterogeneities that are characterised by large zones of respectively high and low dynamical activity. This behaviour appears to be a hallmark of squeezed systems, where the quench into this state does not necessarily lead to a balanced-stress situation. This imbalance leads to rearrangements, which again may or may not result in a balanced-stress situation, such that the dynamical activity persists in time. The ranges of the dynamically correlated regions here are smaller than in the ‘glassy’ state, indicating that stress-driven rearrangements are more localized than the thermally-driven rearrangements in the glassy state. To our knowledge, our data are the first demonstrating the intrinsic changes in the dynamical heterogeneities of deformable colloidal systems as the origin of the dynamical process switches from purely thermal to stress-driven.
Acknowledgements.
We gratefully acknowledge financial support from the Swiss National Science Foundation (grant no. 200020-117755 and 200020-120313), CNES and CNRS (PICS no. 2110). L. C. acknowledges support from the Institut Universitaire de France.References
- [1]
- [2] Ballesta, P., Duri, A. & Cipelletti L. 2008 Unexpected drop of dynamical heterogeneities in colloidal suspensions approaching the jamming transition. Nature Physics 4, 550–554.
- [3]
- [4] Bandyopadhyay, R., Liang, D., Yardimci, H., Sessoms, D. A., Borthwick, M. A., Mochrie S. G. J., Harden, J. L., & Leheny, R. L. 2004 Evolution of particle-scale dynamics in an aging clay suspension. Phys. Rev. Lett. 93, 228 302.
- [5]
- [6] Berthier, L., Biroli, G., Bouchaud, J. P., Cipelletti, L., El Masri, D., L’Hote, D., Ladieu, F. & Pierno, M. 2005 Direct experimental evidence of a growing length scale accompanying the glass transition. Science 310, 1797–1800.
- [7]
- [8] Brambilla, G., El Masri, D., Pierno, M., Petekidis, G., Schofield, A. B., Berthier, L. & Cipelletti, L. 2009 Probing the equilibrium dynamics of colloidal hard spheres above the mode-coupling glass transition. Phys. Rev. Lett., 102, 085 703.
- [9]
- [10] Cheng, Z. D., Zhu, J. X., Chaikin, P. M., Phan, S. E. & Plimpton S. J. 1999 Spatial correlations of mobility and immobility in a glass-forming Lennard-Jones liquid. Phys. Rev. E 60, 3107–3119.
- [11]
- [12] Cipelletti, L., Manley, S., Ball, R.C. & Weitz, D.A. 2000 Universal aging features in the restructuring of fractal colloidal gels. Phys. Rev. Lett. 84, 2275–2278.
- [13]
- [14] Clara Rahola, J. 2007 Elasticity and dynamics of weakly aggregated colloidal systems. Ph.D. thesis, Université de Fribourg, Fribourg, Switzerland.
- [15]
- [16] Cloitre, M., Borrega, R. & Leibler, L. 2000 Rheological aging and rejuvenation in microgel pastes. Phys. Rev. Lett. 85, 4819–4822.
- [17]
- [18] Deike, I., Ballauff, M., Willenbacher, N. & Weiss, A. 2001 Rheology of thermosensitive latex particles including the high-frequency limit. J. Rheol. 45, 709–720.
- [19]
- [20] Dhont, J. K. G. 1996 An introduction to dynamics of colloids. Amsterdam: Elsevier Science.
- [21]
- [22] Duri, A., Bissig, H., Trappe, V. & Cipelletti, L. 2005 Time resolved correlation measurements of temporally heterogeneous dynamics. Phys. Rev. E 72, 051 401.
- [23]
- [24] Duri, A., Sessoms, D. A., Trappe, V. & Cipelletti, L. 2009 Resolving long-range spatial correlations in jammed colloidal systems using photon correlation imaging. Phys. Rev. Lett. 102, 085 702.
- [25]
- [26] Goodman, J. W. 1984 Statistical properties of laser speckle patterns. In Laser speckle and related phenomena (ed. J. Christopher Dainty) pp.9. Berlin: Springer-Verlag.
- [27]
- [28] Lačević, N., Starr, F. W., Schrøder, T. B. & Glotzer S. C. 2003 Spatially heterogeneous dynamics investigated via a time-dependent four-point density correlation function. J. Chem. Phys. 119, 7372–7387.
- [29]
- [30] Lechenault, F., Dauchot, O., Biroli, G. & Bouchaud, J. P. 2008 Critical scaling and heterogeneous superdiffusion across the jamming/rigidity transition of a granular glass. Europhys. Lett. 83, 46 003.
- [31]
- [32] Le Grand, A. & Petekidis, G. 2008 Effects of particle softness on the rheology and yielding of colloidal glasses. Rheol. Acta 47, 579–590.
- [33]
- [34] Mason, T. G., Bibette, J. & Weitz, D. A. 1995 Elasticity of compressed emulsions. Phys. Rev. Lett. 75, 2051–2054.
- [35]
- [36] Mason, T. G. & Lin, M. Y. 2005 Density profiles of temperature-sensitive microgel particles. Phys. Rev. E 71, 040 801.
- [37]
- [38] Meeker, S. P., Poon, W. C. K. & Pusey, P. N. 1997 Concentration dependence of the low-shear viscosity of suspensions of hard-sphere colloids. Phys. Rev. E 55, 5718–5722.
- [39]
- [40] Princen, H. M. 1983 Rheology of foams and highly concentrated emulsions. J. Colloid Interface Sci. 91, 160–175.
- [41]
- [42] Rogers, S. A., Vlassopoulos, D. & Callaghan, P.T. 2008 Aging, yielding and shear banding in soft colloidal glasses. Phys. Rev. Lett. 100, 128 304.
- [43]
- [44] Sato, J. & Breedveld, V. 2005 Evaporation blocker for cone-plate rheometry of volatile samples. Applied Rheology 15, 390–397.
- [45]
- [46] Senff, H. & Richtering, W. 1999 Temperature sensitive microgel suspensions: colloidal phase behaviour and rheology of soft spheres. J. Chem. Phys. 111, 1705–1711.
- [47]
- [48] Senff, H., Richtering, W., Norhausen, A., Weiss, A. & Ballauff, M. 1999 Rheology of a temperature sensitive core-shell latex. Langmuir 15, 102–106.
- [49]
- [50] Senff, H. & Richtering, W. 2000 Influence of cross-link density on rheological properties of temperature-sensitive microgel suspensions. Colloid Polym. Sci. 278, 830–840.
- [51]
- [52] Stieger, M., Pederson, J. S., Lindner, P. & Richtering, W. 2004 Are thermoresponsive microgels model mystems for concentrated colloidal suspensions? A rheology and small-angle neutron scattering study. Langmuir 20, 7283–7292.
- [53]
- [54] Trappe, V., Pitard, E., Ramos, L., Robert, A., Bissig, H. & Cipelletti, L. 2007 Investigation of q-dependent dynamical heterogeneity in a colloidal gel by x-ray photon correlation spectroscopy Phys. Rev. E 76, 051 404.
- [55]
- [56] van Megen, W. & Underwood S. M. 1993 Glass transition in colloidal hard spheres: mode-coupling theory analysis. Phys. Rev. Lett. 70, 2766–2769.
- [57]
- [58] van Megen, W., Mortensen, T. C., Williams, S. R. & Müller, J. M. 1998 Measurement of the self-intermediate scattering function of suspensions of hard spherical particles near the glass transition. Phys. Rev. E 58, 6073–6085.
- [59]
- [60] Weeks, E. R., Crocker J. C., & Weitz D. A. 2007 Short- and long-range correlated motion observed in colloidal glasses and liquids. J. Phys.: Condens Matter 19, 205 131.
- [61]
- [62] Wu, J., Huang, G. & Hu, Z. 2003 Interparticle potential and the phase behaviour of temperature-sensitive microgel dispersions. Macromolecules 36, 440–448.
- [63]