11email: nlodieu@iac.es,mosorio@iac.es,rrl@iac.es,ege@iac.es 22institutetext: Departamento de Astrofísica, Universidad de La Laguna, E-38205 La Laguna, Tenerife, Spain 33institutetext: Centro de Astrobiología (CSIC/INTA), 28850 Torrejón de Ardoz, Madrid, Spain 44institutetext: Scottish Universities’ Physics Alliance (SUPA), Institute for Astronomy, School of Physics & Astronomy, University of Edinburgh, Royal Observatory, Blackford Hill, Edinburgh EH9 3HJ, UK
44email: nch@roe.ac.uk
A census of very-low-mass stars and brown dwarfs in the Orionis cluster ††thanks: This work is based in part on data obtained as part of the UKIRT Infrared Deep Sky Survey. The United Kingdom Infrared Telescope is operated by the Joint Astronomy Centre on behalf of the Science and Technology Facilities Council of the U.K.
Abstract
Context. The knowledge of the initial mass function (IMF) in open clusters constitutes one way of constraining the formation of low-mass stars and brown dwarfs, along with the frequency of multiple systems and the properties of disks.
Aims. The aim of the project is to determine the shape of the mass function in the low-mass and substellar regimes in the Orionis cluster (3 Myr, 352 pc, solar metallicity) as accurately as possible and compare it with the results in other clusters.
Methods. We have analysed the near-infrared photometric data from the Fourth Data Release (DR4) of the UKIRT Infrared Deep Sky Suvey (UKIDSS) Galactic Clusters Survey (GCS) to derive the cluster luminosity and mass functions, evaluate the extent of the cluster, and study the distribution and variability of low-mass stars and brown dwarfs down to the deuterium-burning limit.
Results. We have recovered most of the previously published members and found a total of 287 candidate members within the central 30 arcmin in the 0.5–0.009 M⊙ mass range, including new objects not previously reported in the literature. This new catalogue represents a homogeneous dataset of brown dwarf member candidates over the central 30 arcmin of the cluster. The expected photometric contamination by field objects with similar magnitudes and colours to Orionis members is 15 %. We present evidence of variability at the 99.5% confidence level over yearly timescales in 10 member candidates that exhibit signs of youth and the presence of disks. The level of variability is low ( 0.3 mag) and does not impact the derivation of the cluster luminosity and mass functions. Furthermore, we find a possible dearth of brown dwarfs within the central five arcmin of the cluster, which is not caused by a lower level of photometric sensitivity around the massive, O-type multiple star Ori in the GCS survey. Using state-of-the-art theoretical models, we derived the luminosity and mass functions within the central 30 arcmin from the cluster centre, with completeness down to = 19 mag, corresponding to masses ranging from 0.5 M⊙ down to the deuterium-burning mass boundary (0.013 M⊙).
Conclusions. The mass function of Orionis in this mass interval shows a power law index = 0.50.2 (when expressed as dN/dMM-α), which agrees with the one derived for the 3–5 Myr cluster Upper Sco (based on similar data obtained with the GCS) in the same mass range.
Key Words.:
photometric — stars: low-mass, brown dwarfs; stars: luminosity function, mass function — infrared: stars — galaxy: open clusters and associations: individual (Orionis)1 Introduction
The number of objects per unit of mass, known as the initial mass function (hereafter IMF), is of prime importance in understanding stellar and substellar formation processes. After the pioneering studies by Salpeter (1955), Miller & Scalo (1979), and Scalo (1986), the stellar IMF has been investigated during the past decades in various environments and over a wide mass range to look into a possible dependence on time and place. To address some of the crucial questions like the universality of the IMF, young open clusters and star-forming regions have been extensively targeted because they represent a coeval population of stars of similar metallicity at a given distance. Results from large-scale surveys of open clusters suggest that no clear and unambiguous variation in the IMF has been seen and that the IMF is consistent with the field mass function (Kroupa 2002; Chabrier 2003). However, Luhman et al. (2003) find evidence of a clear variation in the IMF between Taurus that peaks at 0.8 M⊙ and other young regions (e.g. IC 348; peak at 0.1–0.2 M⊙).
The UKIRT Deep Infrared Sky Survey (UKIDSS; Lawrence et al. 2007), made of five sub-surveys, is designed to reach three to four magnitudes deeper than 2MASS (Cutri et al. 2003) and cover several thousands of square degrees in several infrared filters. The UKIDSS project is described in Lawrence et al. (2007) and uses the Wide Field Camera (WFCAM; Casali et al. 2007) installed on the UK InfraRed Telescope (UKIRT) and the Mauna Kea Observatory (Tokunaga et al. 2002) photometric system described in Hewett et al. (2006). The pipeline processing is described in Irwin et al. (in prep)111Extensive details on the data reduction of the UKIDSS images is available at http://casu.ast.cam.ac.uk/surveys-projects/wfcam/technical and the WFCAM Science Archive (WSA) in Hambly et al. (2008).
The Galactic Clusters Survey (GCS), one of the UKIDSS components, aims to make a census of young brown dwarfs in ten star-forming regions and open clusters over large areas in five passbands () across the 1.0–2.5 micron wavelength range with a second epoch in . The main goal is to measure the form of the IMF (Salpeter 1955; Miller & Scalo 1979; Scalo 1986) in the low-mass and substellar regimes to investigate important issues, including the formation and spatial distribution of low-mass stars and brown dwarfs. Early results on the IMF in the Pleiades and in Upper Scorpius are presented in Lodieu et al. (2007a) and Lodieu et al. (2007b), respectively, and are used for comparison with Orionis in this paper.
The Orionis cluster, located around the O9.5-type multiple star of the same name, belongs to the Orion OB 1b association and was first mentioned by Garrison (1967) and later by Lynga (1981). The X-ray detection of a high concentration of sources around the central star by ROSAT (Walter et al. 1994) triggered deep optical surveys dedicated to the search for low-mass stars and brown dwarfs. The cluster is 1–8 Myr old (Béjar et al. 1999) with a most probable age of 32 Myr (Oliveira et al. 2002; Zapatero Osorio et al. 2002a; Sherry et al. 2004) and suffers from little reddening (Lee 1968; Béjar et al. 1999). The cluster is located at 352 pc according to Hipparcos (Perryman et al. 1997) but could actually be further away, at a distance of 440 pc (Brown et al. 1994; Sherry et al. 2004; Jeffries et al. 2006). Deep optical surveys of a large area of the cluster complemented by near-infrared photometry revealed numerous low-mass stars, brown dwarfs (Béjar et al. 1999; Kenyon et al. 2005), and planetary-mass members (Zapatero Osorio et al. 2000). Many objects have been spectroscopically confirmed over a large mass range in the optical (Béjar et al. 1999; Zapatero Osorio et al. 2000; Béjar et al. 2001a; Barrado y Navascués et al. 2001; Kenyon et al. 2005; Sacco et al. 2008) and in the near-infrared (Zapatero Osorio et al. 2000; Martín et al. 2001). Many sources have now mid-infrared counterparts with the advent of the Spitzer space telescope (Hernández et al. 2007; Caballero et al. 2007; Zapatero Osorio et al. 2007; Scholz & Jayawardhana 2008; Luhman et al. 2008), allowing an estimate of the disk fraction through the mid-infrared excesses. The cluster mass function, derived across the low-mass (0.2 M⊙), substellar, and planetary-mass regimes, indicates a rising slope with an index = 0.80.4 (Béjar et al. 2001a), recently revised by Caballero et al. (2007) to = 0.60.2 (when expressed as the mass spectrum, dN/dMM-α). Moreover, Jeffries et al. (2006) reported the presence of two distinct populations in Orionis but indistinguishable in colour-magnitude diagrams (see also Caballero (2007b)). The first one is associated with Orionis itself and has an age around 3 Myr and a distance of 440 pc whereas the second group appears older (10 Myr) and closer (d 352 pc).
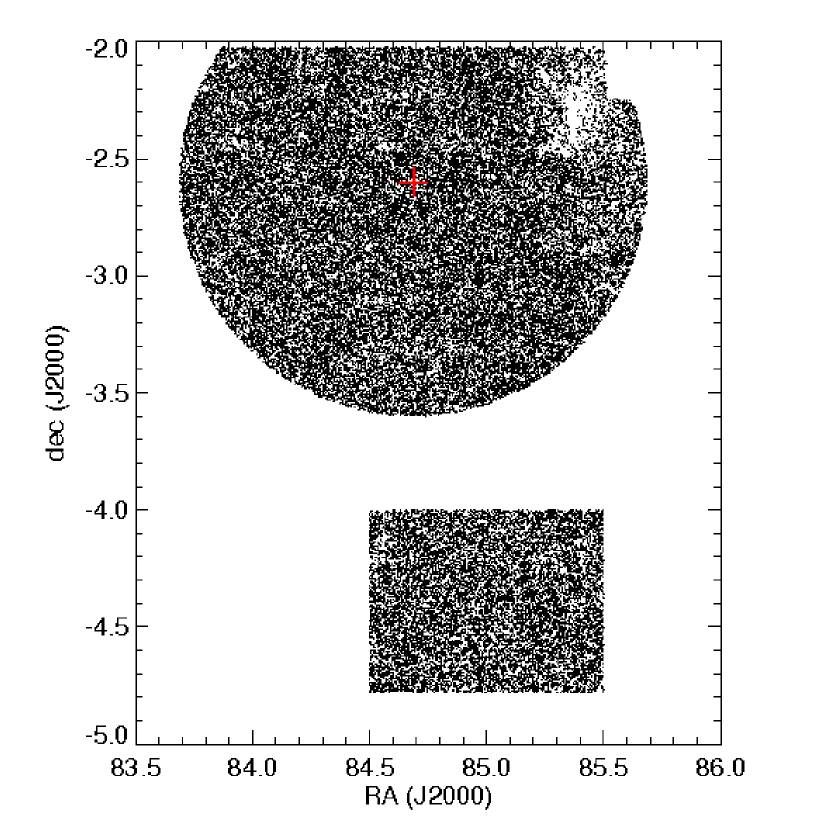
The GCS provides a full near-infrared coverage of Orionis in five filters over the central 30 arcmin (Fig. 1). In this paper we present a census of very low-mass star (referred to as M 0.5 M⊙ throughout this paper) and brown dwarf member candidates down to the deuterium-burning limit ( 17.9 mag) in Orionis. In Sect. 2 we describe the selection of photometric and proper motion member candidates. In Sect. 3, we compare our catalogue with previous studies of low-mass stars and brown dwarfs identified in Orionis. In Sect. 4, we explore the variability of cluster member candidates. In Sect. 5 we briefly evaluate the extent of Orionis on the sky. In Sect. 6, we investigate the distribution of low-mass stars and brown dwarfs across the central 30 arcmin of the cluster. In Sect. 7 we discuss the level of contamination affecting our photometric selection across the full magnitude range. Finally, we derive the cluster luminosity and mass functions for the central 30 arcmin down to the deuterium-burning limit and compare our results to earlier studies in Orionis and other clusters (Sect. 8).
2 The selection of cluster member candidates
2.1 The query
We extracted from the UKIDSS GCS DR4 all point sources located within a one degree radius from the star Ori which marks the centre of the cluster (Fig. 1). The survey coverage is spatially homogeneous and complete up to 35 arcmin because the part north of Declination equal to 2 deg is missing in GCS DR4. The central coordinates of the tiles observed by the GCS in Orionis are listed in Table 1. Each WFCAM tile (54 by 54 arcmin aside) was observed in all five passbands (). Average seeing measured on the Orionis images and in each individual filter ranged from 0.75 to 1.0 arcsec. Central coordinates (in J2000) of each WFCAM tile along with the corresponding observing date are provided in the table.
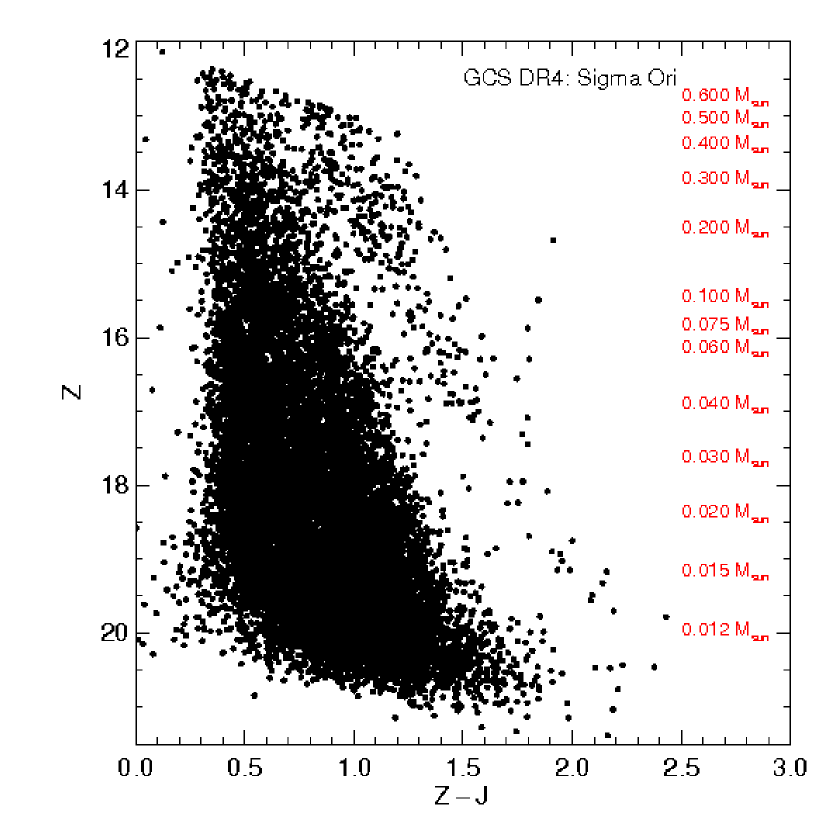
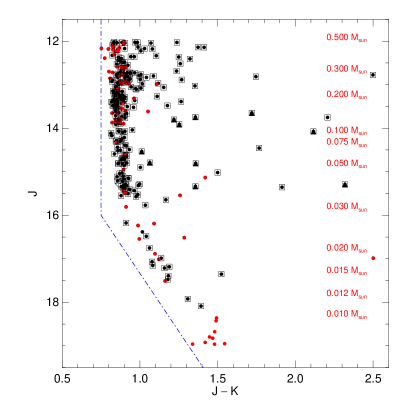
We used a similar Structured Query Language (SQL) query to our work in Upper Sco (Lodieu et al. 2006, 2007b) and the Pleiades (Lodieu et al. 2007a) to extract the catalogue of sources towards Orionis. Briefly, we selected only point sources (Class parameter equal to 2 or 1) detected in as well as those detected only in . The resulting catalogue contained 46884 sources. All sources within 30 arcmin (to guarantee a full spatial coverage, and also see Sect. 5) are plotted in the (,) colour-magnitude diagram presented in Fig. 2. We estimate that the survey towards Orionis is complete in the following magnitude ranges: 12.2 20.2 mag, 12.4 20.0 mag, 12.0 19.0 mag, 12.5 18.4 mag, and 11 18 mag. These magnitudes are estimated from the values where the histograms of the numbers of sources as a function of magnitude deviate from a power law fit to the counts. Our analysis will solely focus on candidates fainter than 12 mag, corresponding to low-mass star (M 0.5 M⊙) and brown dwarf members down to the deuterium-burning limit. The GCS provides five-band photometry and our SQL query included the computation of the proper motions from the cross-match between the 2MASS (Cutri et al. 2003) and the GCS for all sources brighter than = 15.5 mag.
| Tilea | R.A. | Dec | Date |
|---|---|---|---|
| h:m | d:’ | YYYY-MM-DD | |
| 1 | 05:33 | 03:21 | 2005-10-05 |
| 2 | 05:33 | 02:28 | 2005-10-14 |
| 3 | 05:36 | 03:21 | 2005-10-13 |
| 4 | 05:36 | 02:28 | 2005-10-06 |
| 5 | 05:39 | 03:21 | 2005-10-13 |
| 6 | 05:40 | 02:28 | 2005-10-14 |
| 7 | 05:41 | 03:21 | 2005-10-06 |
| 8 | 05:43 | 02:28 | 2005-10-10 |
| 9 | 05:45 | 03:21 | 2005-10-10 |
2.2 Selection in colour-magnitude diagrams
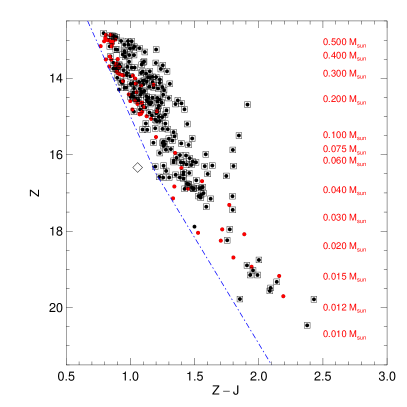
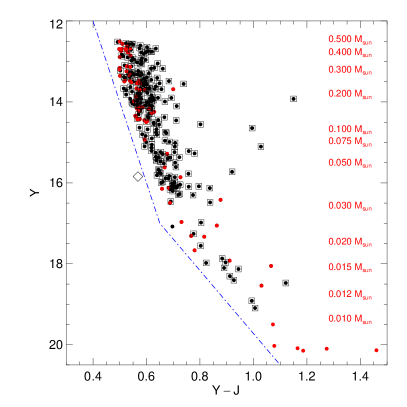
The selection of cluster member candidates in Orionis was carried out in a similar manner as the procedure outlined for the similarly young Upper Sco (Lodieu et al. 2006, 2007b) and the older Pleiades clusters (Lodieu et al. 2007a). Nonetheless, we used the Mayrit catalogue (Caballero 2008c) along with other spectroscopic known members (see Section 3) to design photometric cuts in three different colour-magnitude diagrams (Fig. 3).
We restricted our selection to sources fainter than = 12 mag and to the central 30 arcmin in radius around the massive multiple star Ori to avoid contamination by the Orion complex (see Sect. 5). We also defined a combination of lines in three colour-magnitude diagrams to separate the location of potential cluster members from foreground and background field objects. These “separators”, shown in Fig. 3, are as follows:
-
(,) from (0.6,12.0) to (1.2,16.5)
-
(,) from (1.2,16.5) to (2.1,21.5)
-
(,) from (0.40,12.0) to (0.65,17.0)
-
(,) from (0.65,17.0) to (1.10,20.5)
-
0.75 mag for = 12–16 mag
-
(,) = (0.75,16.0) to (1.50,20.0)
These photometric cuts were guided by known bright members published by Caballero (2008c) and faint spectroscopic members (Béjar et al. 1999; Barrado y Navascués et al. 2001; Martín et al. 2001). Cluster candidates were selected as those objects redder than the “separators” (dot-dashed lines) of Fig. 3. The first photometric selection based on the colour returned 327 sources while the colour gave 303 objects. The total number of candidates was 295 after considering all three colors , , and ; this included 88 potential brown dwarfs with magnitudes fainter than 14.4 mag, assuming an age of 3 Myr and a distance of 352 pc (Baraffe et al. 1998) for the cluster. If we assume a larger distance of 440 pc, the stellar/substellar boundary would be at 14.9 mag, decreasing the number of brown dwarf candidates to 64. The selection of candidates is complete down to = 19.0 mag, translating into a mass of 0.0075 and 0.009 M⊙ for a distance of 352 pc and 440 pc, respectively.
2.3 Proper motions
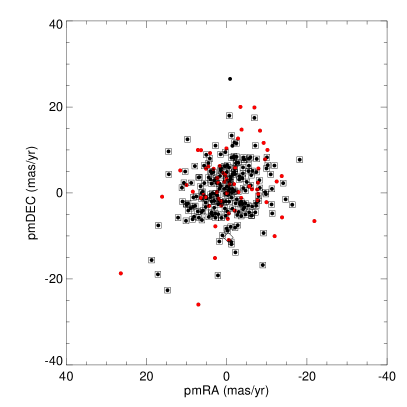
Among the 293 sources extracted from the photometric selection, 263 are brighter than = 15.5 mag and have proper motions accurate to 10 mas/yr from the 2MASS/GCS cross-match implemented in our SQL query (bottom right panel of Fig. 3). The 2MASS data in Orionis were taken between October 1998 and November 2000, yielding a baseline of 5–7 years between the 2MASS and GCS data. The mean proper motion of Orionis (, ) = (3.421.05,0.200.60) mas/yr (Kharchenko et al. 2005) is not large enough to use proper motion to separate potential cluster members from field star non–members as in the Pleiades (e.g. Lodieu et al. 2007a). However, we can reject high proper motion sources with a proper motion 5–10 above the mean of the cluster (30 mas/yr; Caballero 2007b) taking into account the uncertainty of 10 mas/yr in the accuracy of the proper motions. This lower limit allowed us to identify eight objects: five are proper motion non-members and three others are resolved close visual binaries in the UKIDSS images but were not on the 2MASS images, leading to an erroneous proper motion estimate (Table 5). We do not include the three potential binaries in our final catalogue because their physical association should be confirmed first. The five sources with large proper motions might be of interest for subsequent astrometric follow-up to obtain their three dimensional motions and assess their membership to find out if they could have been ejected from the cluster early on during the formation process or if they could belong to a moving group associated with Orion. To summarise, our photometric and proper motion sample contains 285 candidates.
2.4 Faint candidates
To extend the cluster sequence to fainter magnitudes ( = 18–19 mag), we carried out a search for sources detected in but not in using the same and colour criteria as in Sect. 2.2. Again, we limited the search to the central 30 arcmin. This query returned 10 sources in the magnitude interval = 18–19 mag but one object lies at the edge of the detector and another one has a marginal enhancement above the background in the -band but is uncatalogued in the GCS source detection table. The cross-match between the sample of 10 candidates that lack -band detection and the previously known members leads to the identification of SOri 56 and SOri 60 (Zapatero Osorio et al. 2000). Only two sources are brighter than =18.5 mag, SOri 56 (Zapatero Osorio et al. 2000) and SOri J053829.5025959, the brightest of all. The errors on the photometry are on the order of 0.2 mag while the errors on and are around 0.1 mag or below. The other five objects are new. We provide photometry with the associated errors for these 10 sources in Table 6.
We repeated the same search but for objects detected only in i.e., no detection in and . We found five new candidates brighter than = 19 mag (Table 6). The two brightest candidates lie very close to a bright star and are actually seen on the and images but not catalogued in the GCS source detection table likely due to the proximity of the bright star. The cross-match with deep Subaru , data (unpublished) within 3 arcsec shows that two sources are detected at and and exhibit blue optical ( 0.3–0.4 mag) and optical-to-infrared ( 1.4–1.5 mag) colours inconsistent with cluster membership222The offsets between -band filters is = 0.5 mag. Therefore, only one source remains as a potential member from the selection, SOri J053857.52022905.5.
3 Comparison with previous catalogues
In this section, we discuss the cross-match of our list of candidates identified in the GCS (filled circles in Fig. 3) with previous cluster members published in the literature (squares in Fig. 3), including the work at optical and near-infrared wavelengths by Béjar et al. (1999), Zapatero Osorio et al. (2000), Béjar et al. (2001a)333, photometry of objects in the area survey surveyed by the Isaac Newton Telescope Wide-Field camera can be found in the PhD thesis of Victor Sánchez Béjar (University of La Laguna, Tenerife, Spain; Béjar et al. 2001b; Béjar 2001), Kenyon et al. (2005), and Burningham et al. (2005) as well as the Mayrit catalogue (Caballero 2008c). We have also compared our list of candidates with the mid-infrared catalogues of Hernández et al. (2007) and Luhman et al. (2008).
3.1 The Mayrit catalogue
The Mayrit catalogue contains 338 sources in the = 4.3–16.4 mag range, including 241 members showing at least one youth feature described in Caballero (2008c) and 97 member candidates with no previous membership information. Among these 338 objects, 116 are brighter than = 12 mag, the upper limit used for the selection of candidates in the GCS, 16 are not in the GCS database (9 of them have youth features) because they do not satisfy the criteria imposed on the Class parameters in at least one passband (Sect. 2.1), and the remaining 206 have a GCS counterpart within 2 arcsec. After cross-matching these 206 sources with our list of Orionis candidate members (Table 7), 198 of them nicely define the photometric sequence of the cluster in the colour-magnitude diagrams depicted in Fig. 3. We note that four of the 198 sources fitting the cluster sequence are spectroscopic binaries (M258337, M459224, M873229, M1493050; Maxted et al. 2008). The other sources listed in Table 4 of Maxted et al. (2008) are either photometric and/or proper motion non-members.
Among the 206 sources common to the GCS and the Mayrit catalogues (Caballero 2008c), eight did not pass our selection photometric criteria although the majority of those show signatures of a young age. One source, M500279, is possibly a Class II object with X-ray emission (Caballero 2007a; Hernández et al. 2007) but has no photometry for an unknown reason which leaves it outside our selection. We reject M537040 (S Ori 20; KJN 52) because of its relatively high proper motion (Table 8), confirming its previously reported doubtful membership (Béjar et al. 1999; Barrado y Navascués et al. 2003; Kenyon et al. 2005). Moreover, we should mention that M92149 has a discrepant proper motion with the mean value of the cluster despite showing several signs of membership, including lithium, H in emission, X-ray emission (Franciosini et al. 2006), and a mid-infrared flux excess (Hernández et al. 2007). This object could be part of the Orion complex and not of Orionis, or could have been rejected from the Orionis cluster. The remaining five Mayrit member candidates did not satisfy the colour criterion, including two which are borderline (Table 8), including M487350 ((SE 2004)70; Caballero et al. 2006a) which is discussed in more detail in Sect. 3.5.
We note that all of the Mayrit candidate members fainter than = 12 mag, which are confirmed spectroscopically (Table 1 of Caballero et al. (2008)), are present in our list of candidates whereas the two objects rejected as non-spectroscopic members, Mayrit 926051 and UCM 05360239, are not in our catalogue. A similar result is drawn from the sample of spectroscopic members listed in Table 1 of Sacco et al. (2008). The only exception is SE 51, classified as a member on the basis of radial velocity, lithium content, and H emission but not present in our catalogue because it does not satisfy the point source requirement (Class parameter is not equal to 2 or 1 as set in our SQL query). Moreover, three sources (S36, S42, and S97), rejected by Sacco et al. (2008) as members, are in our list: the first one is not in the Mayrit catalogue and the remaining two are in the Mayrit catalogue and classified as member candidates (Caballero 2008c).
3.2 The Kenyon et al. catalogue
Kenyon et al. (2005) published a list of candidates divided into three groups: 57 members, 13 ambiguous i.e. members or non-members, and 6 non-members based on their photometric () and spectroscopic (lithium absorption, gravity derived from the sodium doublet equivalent width, and radial velocity) properties. All these sources are present in the GCS database, except one member (KJN 35) and one non-member (KJN 7), because they do not satisfy our point source criteria (Sect. 2). None of their spectroscopic non-members are present in our list of candidates, in agreement with their non-membership classification. We found that the photometry of all their spectroscopic members (Table 7) is consistent with membership and we verify their candidacy. Also, we classified six out of 13 “Maybe” candidates as photometric member candidates in our survey (KJN 25, 27, 40, 72, 73, and 76). KJN 52 (also a “Maybe” object; SOri 20) has a proper motion inconsistent with that of the cluster and is a binary candidate (Kenyon et al. 2005). The remaining six sources (KJN 29, 33, 34, 45, 53, and 59; Table 8) do not fit the cluster sequence in the colour-magnitude diagrams shown in Fig. 3.
3.3 The Burningham et al. catalogue
Using follow-up spectroscopy, Burningham et al. (2005) published absorption feature equivalent widths for 54 sources selected photometrically by Kenyon et al. (2005) and radial velocities for 37 of them. Among these 54 sources in Table 3 of Burningham et al. (2005), 48 are in the GCS database but only 11 are within the 30 arcmin radius from the cluster centre. All 11 passed our photometric criteria and have membership probabilities larger than 80%, except for one for which equivalent width and radial velocity measurements are missing (Object 285; Burningham et al. 2005). The GCS photometry is provided in Table 8.
3.4 The Spitzer catalogues
Hernández et al. (2007) and Luhman et al. (2008) published mid-infrared photometry obtained by the Spitzer telescope for candidate members compiled from the literature, mostly based on spectroscopy and optical and near-infrared colour-magnitude diagrams.
A total of 306 objects are common to those two catalogues. From the sample of Luhman et al. (2008), we have found 201 sources common to our list of candidates out of the 371 objects given in their Table 1. We note that 131 of these 371 sources are brighter than = 12 mag and therefore outside our selection criteria. The near-infrared photometry available for the remaining 371201131 = 39 candidates published in Table 1 of Luhman et al. (2008) suggest that they are not probable members of Orionis because they lie to the blue of the cluster sequence in at least one of the colour-magnitude diagrams. The Spitzer photometry published by Luhman et al. (2008) indicates that five out of 39 exhibit mid-infrared flux excesses, including SOri 55 which may have a disk (Luhman et al. 2008). Three other objects, SO 566, SO 673, and SO 733, show mid-infrared excesses, suggesting that they could be seen in scattered light or have edge-on disks, leading to their rejection photometrically due to unusual colours and magnitudes.
We repeated this procedure for the sample published in Table 1 of Hernández et al. (2007). We confirm the candidacy of 169 sources out of 336 of their probable candidates, taking into account that another 120 are brighter than our -band threshold. Most of them are in the Luhman et al. (2008) sample and included in the Mayrit catalogue. Among the 133 uncertain members of Orionis listed in Table 2 of Hernández et al. (2007), we recovered 15 sources that we classify as photometric members; the remaining ones were rejected.
3.5 Other published sources
We also cross-correlated our list of candidates with Table 3 of Caballero et al. (2007) containing cluster member candidates fainter than the limiting magnitude of the Mayrit catalogue. We recovered all objects in the magnitude interval = 16.4–18.3 mag and identified them as very likely candidates through our five-band photometry. However, we rejected S Ori J053944.5025959 and S Ori J053956.8025315 from our list of very likely candidates because they appear too blue in the (,) colour-magnitude diagram. We note that SOri J053922.2024552, listed in Table 3 of Caballero et al. (2007) but not in the Mayrit catalogue, is in our list of GCS candidates. In addition, we extracted the GCS photometry for five candidates in Table 3 of Caballero et al. (2007) but not in our list because of the limit in . These objects are SOri J053858.6025228, SOri J053949.5023130, SOri 60 (L21.0), SOri J053844.5025512, and SOri J054008.5024550. We note that the first of these sources is extremely red in and has a Spitzer detection with an upper limit in the [3.6]–[8.0] colour (Caballero et al. 2007). The last object is only detected in . In addition, we recovered a few additional objects originally published by Béjar et al. (1999), Zapatero Osorio et al. (2000), and Béjar et al. (2001a). Their photometry is also given in Table 7.
We found a few additional sources that do not fit the cluster sequence in at least two of the colour-magnitude diagrams (crosses in Fig. 3). Those objects, rejected from our list of photometric members and discovered by Béjar et al. (1999), Zapatero Osorio et al. (2000), and Béjar et al. (2001a) are SOri 26 (M4.5), SOri 34, 41, 43, 44 (M7), 49 (M7.5), 57, SOri J053909022814 (M5), SOri J053926022614, and SOri J053948022914 (M7). Moreover, we found that SOri 54 (M9.5), 55 (M9), and 58 (L0) are borderline and maybe part of an adjacent population belonging to Orion as they show evidence of disks (Zapatero Osorio et al. 2007). We consider them as “Maybe” candidate members but do not include them in our final list of photometric candidate members. Table 8 lists their coordinates and GCS photometry along with the original names.
S Ori J053948.1022914 was originally identified by Béjar et al. (2001a) and its membership remains under debate (Caballero et al. 2007). The object has = 16.400.05 mag and a slightly red colour of 1.280.17 (Barrado y Navascués et al. 2003). However, the GCS DR4 has = 16.3820.013 mag and = 1.0160.020 mag, the correction from 2MASS to GCS magnitudes for an M4 dwarf being smaller than 0.01 mag (Hewett et al. 2006). Both colour estimates agree within the error bars. This object lies on the blue side of the cluster sequence (Fig. 3) but it cannot be definitively rejected. Its membership thus remains open.
Caballero et al. (2006a) argued that SE 70 (classified as M5–M6) and SOri 68 (L52 with an estimated mass of 5 MJup) form a wide (physical projected separation of 1700 au) system and belong to Orionis based on photometric, spectroscopic, and kinematic arguments. The secondary, SOri 68, is not detected on the GCS images but SE 70 is clearly seen with = 15.2760.006 mag. Its optical-to-infrared colours are = 1.056 and = 0.568, hence this object lies to the blue of the Orionis sequence in the (,) and (,) diagrams (open diamond in Fig. 3). A comparable trend was visible in the (,) diagram (Caballero et al. 2006a). Its colour (0.871), however, looks consistent with the cluster sequence. The measured proper motion, (,) = (0.4,10.3) mas/yr (Table 8), is small and cannot be used to distinguish between a cluster member and a very distant M dwarf. Additionally, we note that about 70% of field dwarfs with a spectral type of M5 and M6 are active (West et al. 2008), suggesting that this criterion is not sufficient to assign a young age to SE 70 (Franciosini et al. 2006). Furthermore, the radial velocity measurement has large error bars and the detection of the lithium absorption is noisy (Caballero et al. 2006a). Therefore, we question its membership to Orionis and cast doubt about the binary nature of this supposedly wide system.
Finally, based on those objects discussed in this Section that have not been selected as likely Orionis photometric members in our GCS survey but that show signatures of a very young age (suggesting their possible membership in the cluster), we estimate that our search may have lost up to 8 % of true members of the cluster.
3.6 New member candidates
We identified 66 new candidate members not published in previous studies. Seven of these have additional () photometry in Béjar (2001). Their photometry is indicative of cluster membership and their proper motions are not large enough to discard them. Table 9 gives their coordinates, near-infrared photometry, and proper motions. They are plotted as red filled circles in Fig. 3. Most of them appear to be located in the periphery of the central 30 arcmin, possibly due to the incompleteness of previous surveys in the outer parts of the cluster and the (possibly) greater contamination by an older population belonging to the Orion complex.
We cross-correlated this list of new candidates with the sample of non-members published by Caballero (2008c) and found two objects in common: S Ori J053945.01025348.9 and S Ori J053929.71022722.7. Both sources were rejected as cluster members because no lithium absorption is seen in good quality and high-resolution spectra. We checked our Spitzer database (Zapatero Osorio et al. 2007) and found that none shows mid-infrared flux excesses.
4 Variability of low-mass stars and brown dwarfs
In this section, we examine the variability of low-mass stars and brown dwarfs over a timescale of years by comparing the -band photometry from 2MASS (Cutri et al. 2003) and the GCS DR4. We first focus on the -band because we will derive later the cluster luminosity (Sect. 8.1) and mass (Sect. 8.2) functions from this passband. The level and intensity of the activity would set a lower limit on the magnitude bins chosen to derive the luminosity function.
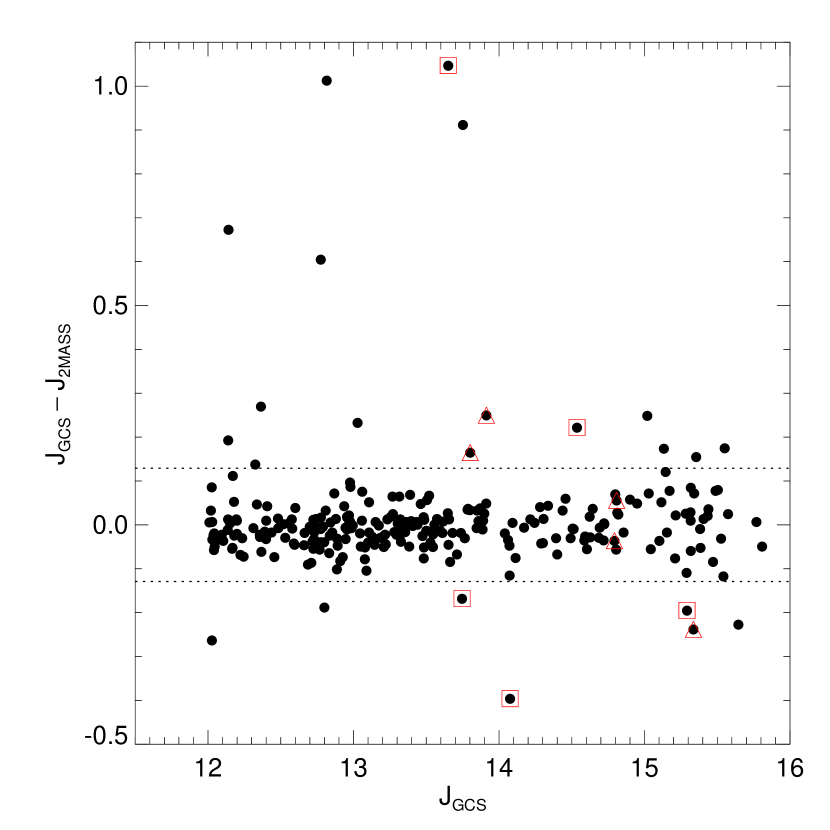
We considered the = 12–16 magnitude range (corresponding to masses between 0.5 and 0.03 M⊙) where both surveys provide reliable photometry. A total of 263 sources have = 12–16 mag among our GCS list of cluster member candidates. The median difference between and magnitudes is 0.007 mag, after taking into account a mean offset of 0.048 mag for M dwarfs between the 2MASS and UKIDSS photometric systems (Hewett et al. 2006). The standard deviation, computed as 1.48 times the median absolute deviation for a robust Gaussian–equivalent root mean square, is 0.043 mag. Thus, any object could be considered as variable (over a timescale of several years) with a 99.5% confidence level if the measured difference in the -band between both epochs is larger than 3. A total of 28 objects satisfy this criterion (see Fig. 4). Two objects show differences larger than one magnitude and three others larger than 0.5 mag in . The remaining ones have amplitudes less than 0.3 mag, implying that the bins of 0.5 mag used to derive the luminosity function are adequate to avoid a significant impact on the luminosity function due to variability.
We repeated this procedure in and and found 13 and 24 candidates for variability, respectively. Hence, we estimate an upper limit of 20% of variable sources among members of Orionis. Only five sources show variability in all three filters with amplitudes larger than 3 (open squares in Fig. 4; Table 10), implying a minimum level of variability of 2%. Another two objects exhibit variability in and while three others show variability in and (open triangles in Fig. 4; Table 10). For two objects, the highest spatial resolution and greater depth of the GCS images compared to 2MASS reveals a faint companion close to M726005 and M458140. All of the 10 candidate variables but one have 1.0 mag and are likely to harbour disks as they are clearly located to the red of the cluster sequence in the (,) diagram (filled triangles in Fig. 3). Indeed, all of them but two (M1082188 and M1583183) show signs of youth with H in emission, presence of lithium and disk (see Table 10 for the detections and references).
5 The extent of the cluster
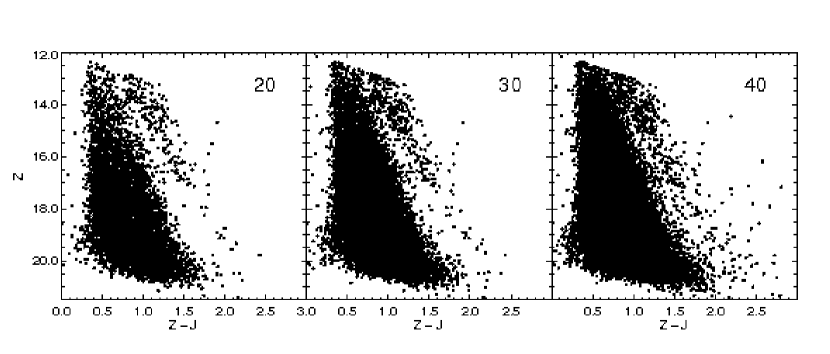
Figure 5 shows (,) colour-magnitude diagram drawn for concentric circles, centered on the star Ori, with radii of 20, 30, and 40 arcmin. The cluster sequence is clearly distinguished from the field stars up to 30 arcmin (smaller radii are not shown for clarity of the figure). At larger radii, the contamination by the population belonging to the Orion complex and foreground field stars increases, blurring the Orionis sequence with field stars. Some cluster member candidates might, however, be present beyond that limit. This topic is discussed in detail in Béjar et al. (2004), Caballero (2008b), and will be addressed in a forthcoming publication (Béjar et al., in prep).
6 The distribution of low-mass stars and brown dwarfs
In this section, we discuss the distribution of low-mass stars and brown dwarfs based on the member candidates extracted from the GCS.
Table 2 shows the numbers of low-mass stars (M 0.5–0.08 M⊙) and brown dwarfs (M = 0.08–0.02 M⊙) for various distances from the cluster centre. The largest radius used for the computation is 30 arcmin, the limit set for our study. The GCS might be incomplete in the inner one arcmin because of the presence of the bright star Ori itself. The masses are directly derived from the magnitudes given by the NextGen (Baraffe et al. 1998) and DUSTY (Chabrier et al. 2000) models. Moreover, we have fixed the age to 3 Myr (Oliveira et al. 2002; Zapatero Osorio et al. 2002a; Sherry et al. 2004) and considered two possible distances: 352 pc derived by Hipparcos (Perryman et al. 1997) and 440 pc (Brown et al. 1994; Sherry et al. 2004; Jeffries et al. 2006).
The relative numbers of brown dwarfs and stars, defined as the RSS ratio by Briceño et al. (2002) or as R1 by Luhman et al. (2003), is computed by adding the high-mass stars (from 10 to 0.5 M⊙) from the Mayrit catalogue to our list of candidates identified in the GCS. This ratio is roughly half the size for the greater distance estimate of Orionis. We derived R1 = 0.230.02 and 0.140.03 for distances of 352 pc and 440 pc, respectively. These numbers increase to 0.450.02 and 0.250.05 when we limit our computation to the mass range covered by the GCS (M 0.5–0.013 M⊙).
The R1 ratios derived for Taurus (Luhman 2004), IC 348 (Luhman et al. 2003), and the Trapezium Cluster (Luhman et al. 2000) are 0.14, 0.12, and 0.26 with an uncertainty of 0.04, respectively. For Orionis, we derived 0.230.02 when including the highest mass members, consistent with the values inferred for the Trapezium Cluster. For the R2 ratio, i.e. the ratio of high-mass (1–10 M⊙ to low-mass (0.15–1 M⊙) stars as defined by Luhman et al. (2003), we derived 0.280.04, again consistent with the Trapezium cluster (0.210.04; Luhman et al. 2000) and also with the Pleiades (0.270.02; Bouvier et al. 1998), M35 (0.220.01; Barrado y Navascués et al. 2001), and Chamaeleon I (0.260.06; Luhman 2007) but two times larger than for Taurus (0.130.04; Luhman 2004). This resemblance with Trapezium is not unexpected since both it and Orionis are part of the Orion complex. We should emphasise the large error on the distance of Orionis and the different sources of uncertainties when comparing ratios derived in different regions, particularly when different methods have been employed to infer masses. Hence, we conclude that the star–brown dwarf fraction of Orionis is probably similar to that of other regions.
| D | starsa,b | BDc | R1d | starsa | BDc | R1e |
|---|---|---|---|---|---|---|
| % | % | |||||
| 5 | 24 ( 25) | 5 | 20.8 (10.2) | 27 ( 25) | 3 | 11.1 ( 5.8) |
| 10 | 64 ( 43) | 24 | 37.5 (22.4) | 77 ( 43) | 13 | 16.9 (10.8) |
| 15 | 93 ( 62) | 37 | 39.8 (23.9) | 109 ( 62) | 24 | 22.0 (14.0) |
| 20 | 128 ( 81) | 51 | 39.8 (24.4) | 147 ( 81) | 37 | 25.2 (16.2) |
| 25 | 163 (108) | 59 | 36.2 (21.8) | 186 (108) | 42 | 22.6 (14.3) |
| 30 | 198 (120) | 73 | 36.9 (23.0) | 223 (120) | 56 | 25.2 (16.4) |
-
a
In this table, low-mass stars are defined as objects with masses between 0.5 and 0.08 M⊙ (for the purpose of the indices)
- b
-
c
In this table, brown dwarfs are defined as objects with masses between 0.08 and 0.02 M⊙ (for the purpose of the indices)
-
d
The results on the left-hand side assume a distance of 352 pc from Hipparcos
- e
| radius | 5 | 10 | 15 | 20 | 25 | 30 |
|---|---|---|---|---|---|---|
| stars | 24 | 65 | 94 | 129 | 165 | 201 |
| BDs | 6 | 27 | 41 | 57 | 67 | 82 |

The R1 ratios appear fairly constant as a function of radius although we observe a possible dearth of brown dwarfs within the central five arcmin (Table 2; Fig. 6) even after correcting by a factor of 0.04 (12/52) for the saturation within the central one arcmin generated by the bright star Ori ( = 4.75; Cutri et al. 2003). Table 3 gives the numbers of stars and brown dwarfs as a function of radius from the cluster. This distribution is illustrated in Fig. 6. The number of brown dwarfs seems to drop off or flatten in the central five arcmin whereas the number of stars keeps rising.
This dearth of brown dwarfs remains independently of the choice of the cluster’s distance (Table 2). This result, already noticed by Caballero (2008b), could be explained by the presence of Ori, a massive multiple system at the center of the cluster (Caballero 2008a) that would have prevented the survival of the lowest-mass objects in the core of the cluster. However, new potential member candidates were extracted within the central 1.51.5 arcmin of the cluster from a multi-conjugate adaptive optics survey (Bouy et al. 2009), suggesting that this issue is not yet settled. The formation mechanism of brown dwarfs proposed by Whitworth & Zinnecker (2004), where the wind of O and B stars would erode the cores during the formation, would not be the main mechanism at play in Orionis. If we assume no dynamical evolution, then the dearth of brown dwarfs tells us about the formation of stars and brown dwarfs, namely that low-mass objects are not found very close to the center but beyond the core radius (about six arcmin; Kharchenko et al. 2005). If we assume, to the contrary, that the cluster has suffered dynamical evolution (even at 3 Myr), then some fraction of the lowest mass stars and brown dwarfs would have been ejected beyond the cluster radius (about 24 arcmin; Kharchenko et al. 2005). Our data allows us to set a lower limit of 30 arcmin as we do not see an excess of low-mass objects within the central 30 arcmin (Fig. 6).
7 Level of contamination
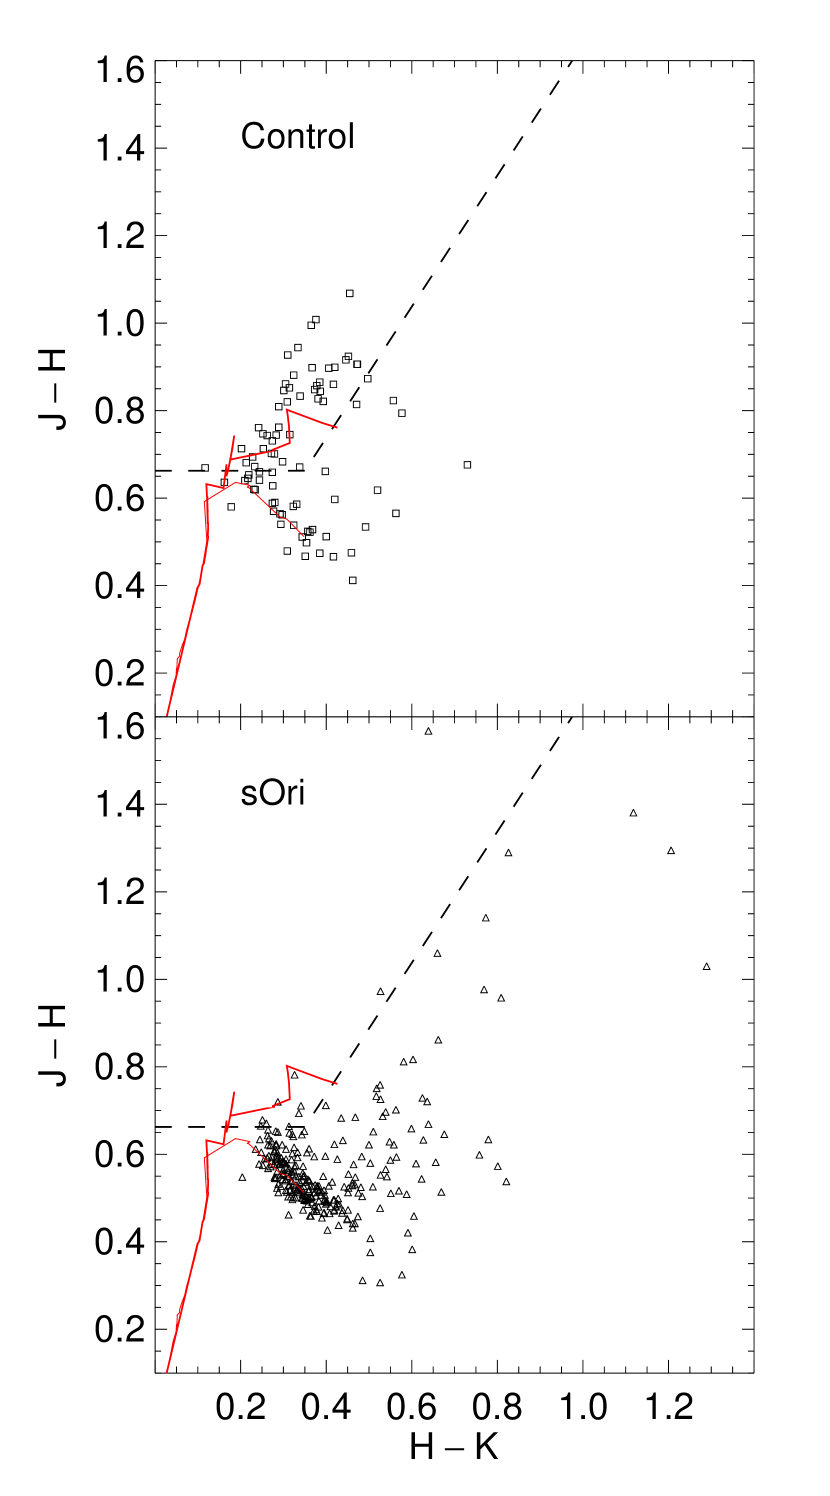
We have attempted to address the issue of photometric contamination by applying our selection procedure to one control field with the same galactic latitude as Orionis. This field is located in the Orion complex but far enough from Orionis and the Trapezium Cluster to minimize the effect of extinction and the presence of young objects (see Fig. 1). However, because this control field is located in the Orion complex, the levels of contamination estimated in this section are very likely upper limits.
We selected the area delineated by RA=84.5–85.5 deg and Dec between 4.78 and 4.0 deg i.e. south–east of Orionis; this area was chosen to match the coverage in Orionis under study. We repeated the photometric and proper motion selection steps described in Sect. 2.2 & 2.3. The sources extracted in the control field after applying all selection criteria are plotted in the (,) two-colour diagram shown in the upper panel of Fig. 7. The total number of sources is 87. Lucas et al. (2008) show (,) two-colour diagrams at different galactic latitudes from the UKIDSS Galactic Plane Survey to identify the multiple groups of stars present along the line of sight. By comparison with our diagram, we can immediately conclude that a large number of contaminants identified in the control field are giants (Fig. 7). For comparison, the same diagram is shown in the lower panel for all candidates identified in Orionis. Therefore, to estimate the true level of contamination in our cluster sample, we have kept only sources below the dashed lines in Fig. 7 defined by:
-
0.35 and 0.6625
-
1.5() 0.1375
The numbers of contaminants (dNCF) in each interval of magnitude are given in Table 4. They are typically within the Poisson errors of the numbers of candidate members identified in Orionis. The level of contamination is around 15% for low-mass stars, 13% for brown dwarfs, and rises to 35% for very low-mass brown dwarfs and planetary–mass objects with masses below 0.02 M⊙ (Table 4).
8 The luminosity and mass functions
In this section, we derive the cluster (system) luminosity and mass functions based on 285 cluster member candidates confirmed photometically and the additional nine sources selected in the (,) and (,) diagrams (dN in Table 4). We have subtracted from this list the potential contaminants identified in the control field (dNCF in Table 4; total 47 sources). Hence, the luminosity and mass functions are derived using the difference of both lists (dNcorr in Table 4). No correction for binaries is applied to the luminosity and mass functions. Finally, we put our results into context and compare them with previous studies in Orionis and other clusters.
For the rest of the paper, we will assume an age of 3 Myr and a distance of 352 pc for Orionis unless stated otherwise. While these parameters have been used extensively in the literature as the most probable values, a word of caution is necessary before discussing the shape of the luminosity and mass functions. Jeffries et al. (2006) demonstrated that two populations (see also Caballero (2007b)), with distinct ages (3 vs 10 Myr) and distances (352 vs 440 pc), are indistinguishable in colour-magnitude diagrams. However, the contamination is less than 10% within the central 10 arcmin but can go up to 40–50% towards the north–west of Orionis due to the presence of another bright star, Ori. Therefore, any list of candidate members belonging to Orionis will be a mix of two populations, leading to some level of errors in the mass determination (see extensive discussion in Jeffries et al. 2006). The main implication is that the “true” mass function of Orionis can only be derived once accurate radial velocity measurements are available for all candidates. Keeping these caveats in mind, we now proceed with the analysis of the luminosity and mass functions.
8.1 The luminosity function
The final sample contains 2859 = 294 photometric member candidates in the = 12–19 mag range within the central 30 arcmin from the cluster centre. We have removed 47 objects identified as contaminants in the control field, leaving 29447 = 247 sources. If we assume an age of 3 Myr and a distance of 352 pc, models (Baraffe et al. 1998; Chabrier et al. 2000) predict that this sample contains 169 stars and 82 brown dwarfs. However, if we assume the larger distance, the numbers of stars and brown dwarfs would be 195 and 56, respectively.
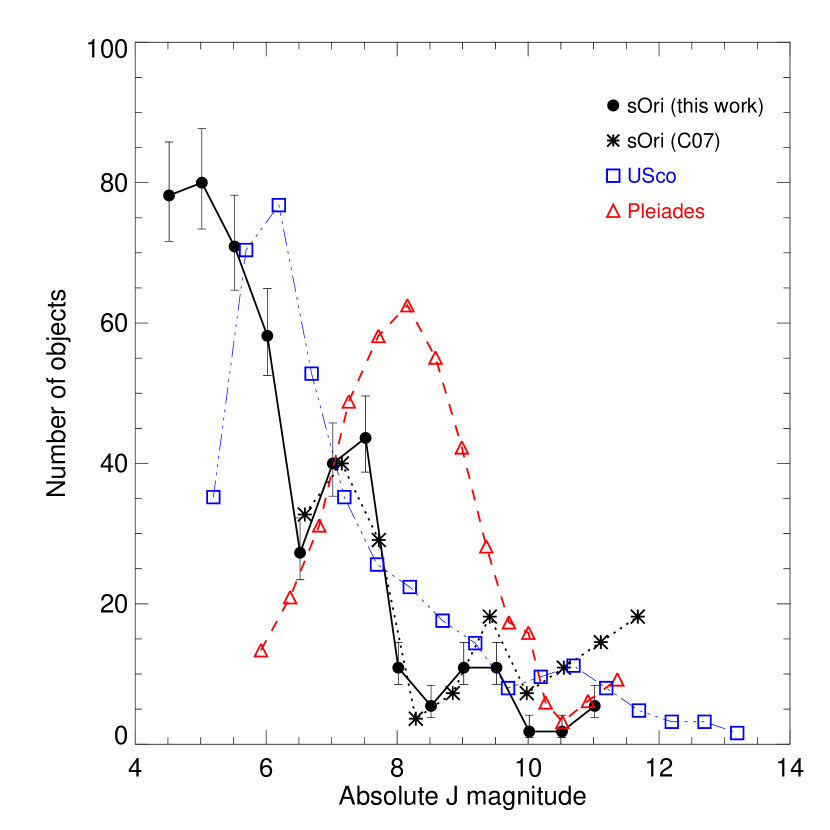
Figure 8 displays the luminosity function i.e. the numbers of stars as a function of absolute magnitude (per 0.5 mag bins) for Orionis and two other clusters targeted by the GCS in a similar fashion: Upper Sco (5 Myr, 145 pc; Lodieu et al. 2007b) and the Pleiades (125 Myr, 130 pc; Lodieu et al. 2007a). They are all normalised to Orionis at 14.75 mag, corresponding to M 7 mag. Error bars are Gehrels errors (Gehrels 1986) rather than Poissonian error bars because the former represent a better approximation to the true error for small numbers. The upper limit is defined as 1+() and the lower limit as assuming a confidence level of one sigma.
Three peaks are visible in the luminosity function of Orionis at 5.25, 7.25, and 9.25 mag. The latter two peaks are also seen in the luminosity function presented in Caballero et al. (2007), shown as star symbols in Fig. 8. In the other clusters, we observe two peaks with a dip around MJ = 9.5 and 10.5 mag in Upper Sco and the Pleiades, respectively, likely due to the M7–M8 gap (Dobbie et al. 2002). We should emphasize that the luminosity function of Upper Sco is “smoothed” as we are counting the number of objects per magnitude bin by steps of 0.5 mag (Lodieu et al. 2007b). The difference in the number of peaks could arise from the different mass intervals probed due to the variety of ages, the extremes being 120 Myr for the Pleiades and 3 Myr for Orionis.
To address the role of the older population on the determination of the luminosity and mass functions, we have derived them excluding all the sources lying beyond a radius of 10 arcmin towards the north–west of the cluster where the contamination by the older group is the largest (see Fig. 2 of Jeffries et al. 2006). The numbers of sources as a function of magnitude (and thus mass) are given as dNNW in the sixth column of Table 4. Typically, these numbers are upper limits as we are assuming 100% contamination by the old population in this region and are smaller than the error bars (assuming either Poisson or Gehrels errors) and do not have a strong influence on the luminosity (and therefore mass) function(s). The only word of caution concerns the = 15.0–15.5 magnitude range, implying that the second peak seen in the luminosity function could be the most affected (and thus overestimated) by this older group comparatively to the rest.
| Jmag range | Mass rangea | dMb | dNc | dN | dN | dN | dN | dN/dM |
|---|---|---|---|---|---|---|---|---|
| 12.00–12.50 | 0.4910-0.3440 | 0.1470 | 44.0 | 1.0 | 3.0 | 43.0 | 36 | 292.52 |
| 12.50–13.00 | 0.3440-0.2460 | 0.0980 | 55.0 | 11.0 | 5.0 | 44.0 | 35 | 448.98 |
| 13.00–13.50 | 0.2460-0.1690 | 0.0770 | 47.0 | 8.0 | 3.0 | 39.0 | 50 | 506.49 |
| 13.50–14.00 | 0.1690-0.1100 | 0.0590 | 37.0 | 5.0 | 3.0 | 32.0 | 38 | 542.37 |
| 14.00–14.50 | 0.1100-0.0670 | 0.0430 | 20.0 | 5.0 | 1.0 | 15.0 | 16 | 348.84 |
| 14.50–15.00 | 0.0670-0.0470 | 0.0200 | 23.0 | 1.0 | 2.0 | 22.0 | 23 | 1100.00 |
| 15.00–15.50 | 0.0470-0.0360 | 0.0110 | 27.0 | 3.0 | 6.0 | 24.0 | 28 | 2181.82 |
| 15.50–16.00 | 0.0360-0.0285 | 0.0075 | 8.0 | 2.0 | 1.0 | 6.0 | 1 | 800.00 |
| 16.00–16.50 | 0.0285-0.0233 | 0.0052 | 5.0 | 2.0 | 0.0 | 3.0 | 5 | 576.92 |
| 16.50–17.00 | 0.0233-0.0182 | 0.0051 | 6.0 | 0.0 | 0.0 | 6.0 | 8 | 1176.47 |
| 17.00–17.50 | 0.0182-0.0141 | 0.0041 | 8.0 | 2.0 | 0.0 | 6.0 | 3 | 1463.41 |
| 17.50–18.00 | 0.0141-0.0114 | 0.0027 | 2.0 | 1.0 | 0.0 | 1.0 | 1 | 370.37 |
| 18.00–18.50 | 0.0114-0.0092 | 0.0022 | 3.0 | 2.0 | 0.0 | 1.0 | 2 | 454.55 |
| 18.50–19.00 | 0.0092-0.0075 | 0.0017 | 7.0 | 4.0 | 0.0 | 3.0 | 3 | 588.24 |
-
a
Mass range associated to the magnitude range given in the first column: we assumed an age of 3 Myr and a distance of 352 pc
-
b
Difference between the masses, dM
-
c
Numbers of candidate members identified in Orionis
-
d
Numbers of contaminants identified in the control field (CF)
-
e
Numbers of objects located beyond 10 arcmin towards the North-West of the cluster center, where the contamination by the old population is the highest
-
f
Numbers of candidate members in Orionis using method #1 and corrected for contamination
-
g
Numbers of candidate members in Orionis using method #2 after correction for contamination estimated from the control field
-
h
Values for the mass function in linear scale (dN/dM) using method #1
8.2 The mass function
The direct conversion from observed magnitudes to masses relies on the 3 Myr NextGen (Baraffe et al. 1998) and DUSTY (Chabrier et al. 2000) isochrones shifted to the distance of the cluster. A larger distance of 440 pc will lead to larger masses but should not affect notably the shape of the mass function. This method is referred to as method #1 in Fig. 9. The estimated masses, spanning 0.5 M⊙ to 0.01 M⊙, are shown on the right-hand side of the colour-magnitude diagrams in Fig. 3. The corresponding mass function (in linear scale; dN/dM) is displayed with black dots in Fig. 9 with numbers in the last column of Table 4.
However, the magnitude predictions of the models fail to neatly reproduce the observed infrared colours (specifically ) of the coolest candidates with spectral types of late-M and early-L. Consequently, our mass estimates are possibly underestimated. In the next section (Sect. 8.3), we will employ an alternative method (method #2) less prone to large errors in model magnitudes to convert apparent magnitudes into masses.
8.3 Comparison with previous studies in Orionis
The most recent estimate of the slope of the mass function in the low-mass star, substellar, and planetary-mass regimes suggests a power law index (defined as dN/dMM-α) equal to 0.60.2 in the 0.11–0.006 M⊙ mass range (star symbols in Fig. 9; Caballero et al. 2007) from a survey of 0.27 square degrees in Orionis. This value is an extension of the 0.23 square degree optical/infrared survey by Béjar et al. (2001a). Moreover, González-García et al. (2006) derived an index of 0.6 over 0.072–0.007 M⊙ from a deep , survey of 0.3 square degrees. All these estimates agree within the error bars and probe roughly the same mass interval (see also Bihain et al. 2009, subm. to A&A).
To compare directly our mass function for Orionis with previous estimates, we have converted the mass and luminosity parameters provided by the NextGen and DUSTY models into observables (method # 2; dN in Table 4) i.e., colours and -band magnitudes after applying bolometric corrections available from the literature for field M and L dwarfs (Dahn et al. 2002; Golimowski et al. 2004). This procedure is also subject to errors since we are dealing with corrections valid for old field M and L dwarfs, whose colours differ slightly from younger objects (Jameson et al. 2008). However, no bolometric corrections are currently available for M and L dwarfs at ages younger than 1 Gyr. The resulting mass function using method #2 is shown with open squares for 352 pc in Fig. 9 and is very similar to the mass function derived with method #1 (filled circles). Mass estimates should, however, be more conservative. The power law index obtained for our mass function, in the dN/dMM-α form, is = 0.50.2 over the 0.49–0.01 M⊙ mass range (Fig. 9). Our result is in agreement with published mass functions in Orionis but has a wider mass range and a better statistics due to the larger area surveyed (0.78 square degrees).
For completeness, we also display the mass function derived with method #1 excluding the sources located beyond 10 arcmin towards the north–west (Fig. 9; Sect. 8.1). This correction smoothes the peak observed around 40 Jupiter masses but does not affect the shape of the mass function (and thus the power law index derived above).


8.4 Comparison with other clusters
Fig. 10 compares the mass function of Orionis (filled symbols) obtained with method #2 with three regions with different ages and distances observed in an homogeneous manner by the GCS: Upper Sco (open squares; 5 Myr; 145 pc; Lodieu et al. 2007b), and the Pleiades (open triangles; 125 Myr; 130 pc; Lodieu et al. 2007a). Error bars are Gehrels error bars (Gehrels 1986).
The Orionis mass function is rising towards lower masses (in a linear scale) and shows a strong dip at 0.03 M⊙. The Pleiades mass function presents a similar shape and also possess a dip at 0.05 M⊙, attributed to the M7/M8 gap and the change in the properties of the atmospheres of brown dwarfs (Dobbie et al. 2002) and in particular the onset of dust condensation. The index of the power law fit to the Orionis and Upper Sco mass functions is comparable within the error bars over the same mass range, from low-mass stars down to the deuterium-burning limit. A dip is seen in the Upper Sco colour-magnitude diagrams around = 15.5 mag ( 14 mag; M 0.03 M⊙) but does not appear in the mass function due to the smoothing of the luminosity function (dictated by the small number statistics as we surveyed a small percentage of the full association). These results are also in agreement with the extrapolation of the field mass function in a log-normal form (Kroupa 2002; Chabrier 2003). The mass function in Orionis requires spectroscopic follow-up for the new candidates identified in this paper while the Upper Sco mass function is quite reliable below 0.03 M⊙ as all sources have been confirmed spectroscopically as members (Lodieu et al. 2008).
9 Conclusions and outlook
We have presented the analysis of a 0.78 square degree area observed by the UKIDSS Galactic Clusters Survey in the young (3 Myr) and nearby (d = 352 pc) Orionis cluster. The main results of our study can be summarised as follows:
-
1.
We have confirmed photometrically the candidacy of the large majority of previous members identified in optical and near-infrared surveys. Additionally, we provide proper motions for the brightest members, down to approximately 30 Jupiter masses. Adding the brightest members ( 12 mag) of the Mayrit catalogue to our catalogue, the population of Orionis is now complete from high-mass stars down to the deuterium-burning limit within the central 30 arcmin of the cluster
-
2.
The distribution of low-mass stars and brown dwarfs seems uniform from five to 30 arcmin from the cluster centre. We find that the ratio of brown dwarfs to low-mass stars is however smaller within the central five arcmin, possibly due to the presence of the massive Ori star (crowding and photometric incompleteness is only affecting the central 30 arcsec from the central O star)
-
3.
The cluster extends all the way to 30 arcmin from the centre. Beyond this limit, the cluster sequence becomes confused with the older members of the Orion complex and field stars
-
4.
Five objects among the 261 low-mass stars and brown dwarfs more massive than 30 Jupiter masses exhibit variability over a timescale of years with a 95% confidence level in
-
5.
The luminosity function shows three peaks at 13, 15, and 17 mag (d = 352 pc), consistent with previous studies
-
6.
The cluster mass function shows a power–law index = 0.50.2 in the 0.5–0.01 M⊙ mass range in agreement with previous estimates, and matches the slope of the Upper Sco mass function over the same mass range
Our study provides a census of low-mass stars and brown dwarfs (0.5–0.01 M⊙) in Orionis and represents a reference point for deeper studies dedicated to the search for T dwarfs in the cluster (see Bihain et al. 2009, subm. to A&A). The advent of the Visible and Infrared Survey Telescope for Astronomy (VISTA)444More details can be found at: http://www.vista.ac.uk/ would certainly allow the study of the fragmentation limit and the discovery of the lowest mass entities that star formation processes can create (Low & Lynden-Bell 1976; Boss 2001) — the discovery and confirmation of young T dwarfs in Orionis is now possible.
Acknowledgements.
This work was partially funded by the Ramón y Cajal fellowship number 08-303-01-02. Financial support from the Spanish Ministry of Science through grant AYA2007-67458 is acknowledged. We are grateful to Isabelle Baraffe for providing us with the NextGen and DUSTY models for the UKIRT/WFCAM filters. We thank José Caballero and Víctor Sánchez Béjar for their comments and suggestions on the original version of the manuscript. We thank the referee, Kevin Luhman, for his constructive report that significantly improved the paper. The United Kingdom Infrared Telescope is operated by the Joint Astronomy Centre on behalf of the U.K. Science Technology and Facility Council. This research has made use of the Simbad and Vizier databases, operated at the Centre de Données Astronomiques de Strasbourg (CDS), and of NASA’s Astrophysics Data System Bibliographic Services (ADS). This publication makes use of data products from the Two Micron All Sky Survey (2MASS), which is a joint project of the University of Massachusetts and the Infrared Processing and Analysis Center/California Institute of Technology, funded by the National Aeronautics and Space Administration and the National Science Foundation.References
- Baraffe et al. (1998) Baraffe, I., Chabrier, G., Allard, F., & Hauschildt, P. H. 1998, A&A, 337, 403
- Barrado y Navascués et al. (2003) Barrado y Navascués, D., Béjar, V. J. S., Mundt, R., et al. 2003, A&A, 404, 171
- Barrado y Navascués et al. (2001) Barrado y Navascués, D., Zapatero Osorio, M. R., Béjar, V. J. S., et al. 2001, A&A, 377, L9
- Barrado y Navascués et al. (2001) Barrado y Navascués, D., Stauffer, J. R., Bouvier, J., & Martín, E. L. 2001, ApJ, 546, 1006
- Béjar (2001) Béjar, V. J. S. 2001, PhD thesis, University of La Laguna, Tenerife, Spain
- Béjar et al. (2004) Béjar, V. J. S., Caballero, J. A., Rebolo, R., Zapatero Osorio, M. R., & Barrado y Navascués, D. 2004, Astrophys. Space. Sci., 292, 339
- Béjar et al. (2001a) Béjar, V. J. S., Martín, E. L., Zapatero Osorio, M. R., et al. 2001a, ApJ, 556, 830
- Béjar et al. (1999) Béjar, V. J. S., Zapatero Osorio, M. R., & Rebolo, R. 1999, ApJ, 521, 671
- Béjar et al. (2001b) Béjar, V. J. S., Zapatero Osorio, M. R., Rebolo, R., et al. 2001b, in Astronomical Society of the Pacific Conference Series, Vol. 223, 11th Cambridge Workshop on Cool Stars, Stellar Systems and the Sun, ed. R. J. Garcia Lopez, R. Rebolo, & M. R. Zapaterio Osorio, 1519
- Boss (2001) Boss, A. P. 2001, ApJL, 551, L167
- Bouvier et al. (1998) Bouvier, J., Stauffer, J. R., Martín, E. L., et al. 1998, A&A, 336, 490
- Bouy et al. (2009) Bouy, H., Huélamo, N., Martín, E. L., et al. 2009, A&A, 493, 931
- Briceño et al. (2002) Briceño, C., Luhman, K. L., Hartmann, L., Stauffer, J. R., & Kirkpatrick, J. D. 2002, ApJ, 580, 317
- Brown et al. (1994) Brown, A. G. A., de Geus, E. J., & de Zeeuw, P. T. 1994, A&A, 289, 101
- Burningham et al. (2005) Burningham, B., Naylor, T., Littlefair, S. P., & Jeffries, R. D. 2005, MNRAS, 356, 1583
- Caballero (2007a) Caballero, J. A. 2007a, Astronomische Nachrichten, 328, 917
- Caballero (2007b) Caballero, J. A. 2007b, A&A, 466, 917
- Caballero (2008a) Caballero, J. A. 2008a, MNRAS, 383, 750
- Caballero (2008b) Caballero, J. A. 2008b, MNRAS, 383, 375
- Caballero (2008c) Caballero, J. A. 2008c, A&A, 478, 667
- Caballero et al. (2007) Caballero, J. A., Béjar, V. J. S., Rebolo, R., et al. 2007, A&A, 470, 903
- Caballero et al. (2004) Caballero, J. A., Béjar, V. J. S., Rebolo, R., & Zapatero Osorio, M. R. 2004, A&A, 424, 857
- Caballero et al. (2006a) Caballero, J. A., Martín, E. L., Dobbie, P. D., & Barrado Y Navascués, D. 2006a, A&A, 460, 635
- Caballero et al. (2006b) Caballero, J. A., Martín, E. L., Zapatero Osorio, M. R., et al. 2006b, A&A, 445, 143
- Caballero et al. (2008) Caballero, J. A., Valdivielso, L., Martín, E. L., et al. 2008, A&A, 491, 515
- Casali et al. (2007) Casali, M., Adamson, A., Alves de Oliveira, C., et al. 2007, A&A, 467, 777
- Chabrier (2003) Chabrier, G. 2003, PASP, 115, 763
- Chabrier et al. (2000) Chabrier, G., Baraffe, I., Allard, F., & Hauschildt, P. 2000, ApJ, 542, 464
- Cutri et al. (2003) Cutri, R. M., Skrutskie, M. F., van Dyk, S., et al. 2003, 2MASS All Sky Catalog of point sources, 2246
- Dahn et al. (2002) Dahn, C. C., Harris, H. C., Vrba, F. J., et al. 2002, AJ, 124, 1170
- Dobbie et al. (2002) Dobbie, P. D., Pinfield, D. J., Jameson, R. F., & Hodgkin, S. T. 2002, MNRAS, 335, L79
- Franciosini et al. (2006) Franciosini, E., Pallavicini, R., & Sanz-Forcada, J. 2006, A&A, 446, 501
- Garrison (1967) Garrison, R. F. 1967, PASP, 79, 433
- Gatti et al. (2008) Gatti, T., Natta, A., Randich, S., Testi, L., & Sacco, G. 2008, A&A, 481, 423
- Gehrels (1986) Gehrels, N. 1986, ApJ, 303, 336
- Golimowski et al. (2004) Golimowski, D. A., Leggett, S. K., Marley, M. S., et al. 2004, AJ, 127, 3516
- González-García et al. (2006) González-García, B. M., Zapatero Osorio, M. R., Béjar, V. J. S., et al. 2006, A&A, 460, 799
- Hambly et al. (2008) Hambly, N. C., Collins, R. S., Cross, N. J. G., et al. 2008, MNRAS, 384, 637
- Hernández et al. (2007) Hernández, J., Hartmann, L., Megeath, T., et al. 2007, ApJ, 662, 1067
- Hewett et al. (2006) Hewett, P. C., Warren, S. J., Leggett, S. K., & Hodgkin, S. T. 2006, MNRAS, 367, 454
- Jameson et al. (2008) Jameson, R. F., Lodieu, N., Casewell, S. L., Bannister, N. P., & Dobbie, P. D. 2008, MNRAS, 385, 1771
- Jeffries et al. (2006) Jeffries, R. D., Maxted, P. F. L., Oliveira, J. M., & Naylor, T. 2006, MNRAS, 371, L6
- Kenyon et al. (2005) Kenyon, M. J., Jeffries, R. D., Naylor, T., Oliveira, J. M., & Maxted, P. F. L. 2005, MNRAS, 356, 89
- Kharchenko et al. (2005) Kharchenko, N. V., Piskunov, A. E., Röser, S., Schilbach, E., & Scholz, R.-D. 2005, A&A, 438, 1163
- Kroupa (2002) Kroupa, P. 2002, Science, 295, 82
- Lawrence et al. (2007) Lawrence, A., Warren, S. J., Almaini, O., et al. 2007, MNRAS, 379, 1599
- Lee (1968) Lee, T. A. 1968, ApJ, 152, 913
- Lodieu et al. (2007a) Lodieu, N., Dobbie, P. D., Deacon, N. R., et al. 2007a, MNRAS, 380, 712
- Lodieu et al. (2006) Lodieu, N., Hambly, N. C., & Jameson, R. F. 2006, MNRAS, 373, 95
- Lodieu et al. (2008) Lodieu, N., Hambly, N. C., Jameson, R. F., & Hodgkin, S. T. 2008, MNRAS, 383, 1385
- Lodieu et al. (2007b) Lodieu, N., Hambly, N. C., Jameson, R. F., et al. 2007b, MNRAS, 374, 372
- Low & Lynden-Bell (1976) Low, C. & Lynden-Bell, D. 1976, MNRAS, 176, 367
- Lucas et al. (2008) Lucas, P. W., Hoare, M. G., Longmore, A., Schröder, A. C., & 27 co-authors. 2008, MNRAS, 391, 136
- Luhman (2004) Luhman, K. L. 2004, ApJ, 617, 1216
- Luhman (2007) Luhman, K. L. 2007, ApJS, 173, 104
- Luhman et al. (2008) Luhman, K. L., Hernández, J., Downes, J. J., Hartmann, L., & Briceño, C. 2008, ApJ, 688, 362
- Luhman et al. (2000) Luhman, K. L., Rieke, G. H., Young, E. T., et al. 2000, ApJ, 540, 1016
- Luhman et al. (2003) Luhman, K. L., Stauffer, J. R., Muench, A. A., et al. 2003, ApJ, 593, 1093
- Lynga (1981) Lynga, G. 1981, Astronomical Data Center Bulletin, 1, 90
- Martín et al. (2001) Martín, E. L., Zapatero Osorio, M. R., Barrado y Navascués, D., Béjar, V. J. S., & Rebolo, R. 2001, ApJL, 558, L117
- Maxted et al. (2008) Maxted, P. F. L., Jeffries, R. D., Oliveira, J. M., Naylor, T., & Jackson, R. J. 2008, MNRAS, 385, 2210
- Miller & Scalo (1979) Miller, G. E. & Scalo, J. M. 1979, ApJS, 41, 513
- Oliveira et al. (2002) Oliveira, J. M., Jeffries, R. D., Kenyon, M. J., Thompson, S. A., & Naylor, T. 2002, A&A, 382, L22
- Perryman et al. (1997) Perryman, M. A. C., Lindegren, L., Kovalevsky, J., Hoeg, E., & 15 co-authors. 1997, A&A, 323, L49
- Sacco et al. (2008) Sacco, G. G., Franciosini, E., Randich, S., & Pallavicini, R. 2008, A&A, 488, 167
- Salpeter (1955) Salpeter, E. E. 1955, ApJ, 121, 161
- Scalo (1986) Scalo, J. M. 1986, Fundamentals of Cosmic Physics, 11, 1
- Scholz & Jayawardhana (2008) Scholz, A. & Jayawardhana, R. 2008, ApJL, 672, L49
- Sherry et al. (2004) Sherry, W. H., Walter, F. M., & Wolk, S. J. 2004, AJ, 128, 2316
- Tokunaga et al. (2002) Tokunaga, A. T., Simons, D. A., & Vacca, W. D. 2002, PASP, 114, 180
- Walter et al. (1994) Walter, F. M., Vrba, F. J., Mathieu, R. D., Brown, A., & Myers, P. C. 1994, AJ, 107, 692
- Weaver & Babcock (2004) Weaver, W. B. & Babcock, A. 2004, PASP, 116, 1035
- West et al. (2008) West, A. A., Hawley, S. L., Bochanski, J. J., et al. 2008, AJ, 135, 785
- Whitworth & Zinnecker (2004) Whitworth, A. P. & Zinnecker, H. 2004, A&A, 427, 299
- Zapatero Osorio et al. (2002a) Zapatero Osorio, M. R., Béjar, V. J. S., Martín, E. L., Barrado y Navascués, D., & Rebolo, R. 2002a, ApJL, 569, L99
- Zapatero Osorio et al. (2000) Zapatero Osorio, M. R., Béjar, V. J. S., Martín, E. L., et al. 2000, Science, 290, 103
- Zapatero Osorio et al. (2002b) Zapatero Osorio, M. R., Béjar, V. J. S., Pavlenko, Y., et al. 2002b, A&A, 384, 937
- Zapatero Osorio et al. (2007) Zapatero Osorio, M. R., Caballero, J. A., Béjar, V. J. S., et al. 2007, A&A, 472, L9
Appendix A Proper motion non members and possible binaries
| IAU Names | Comments | |||||||
| mag | mag | mag | mag | mag | mas/yr | mas/yr | ||
| UGCS J053703.74024150.0 | 14.943 | 14.453 | 13.894 | 13.329 | 13.038 | 3.7 | 36.5 | PM NM |
| UGCS J053855.48024129.6 | 12.922 | 12.606 | 12.139 | 11.705 | 11.342 | 91.1 | 13.1 | PM NM |
| UGCS J053856.65025702.3 | 12.801 | 12.531 | 12.062 | 11.723 | 11.309 | 33.8 | 14.9 | PM NM |
| UGCS J053907.60022905.6 | 16.201 | 15.553 | 14.874 | 14.299 | 13.928 | 43.3 | 7.0 | PM NM |
| UGCS J054019.78022956.0 | 13.285 | 12.947 | 12.453 | 11.945 | 11.599 | 39.5 | 23.4 | PM NM |
| UGCS J053847.90023719.4 | 13.148 | 12.771 | 12.205 | 11.449 | 10.908 | 28.8 | 26.3 | Binary? |
| UGCS J053848.03023718.5 | 13.485 | 13.152 | 12.673 | 11.997 | 11.736 | 242.7 | 107.6 | Binary? |
| UGCS J053947.30022618.3 | 13.493 | 13.113 | 12.605 | 11.969 | 11.718 | 249.6 | 291.6 | Binary? |
-
a
IAU (International Astronomical Union) designations include J2000 (RA,dec) coordinates from UKIDSS GCS DR4 (see http://www.ukidss.org/archive/archive.html for the UKIDSS nomenclature).
Appendix B Faint members identified in GCS DR4
| IAU Namea | Comments | ||||
| mag | mag | mag | mag | ||
| UGCS J053957.39025006.1 | 20.3390.276 | 18.7970.104 | 17.9500.116 | 17.3490.095 | |
| UGCS J053858.55025226.6 | 20.1370.219 | 18.6770.089 | 17.9900.113 | 17.1960.079 | |
| UGCS J053900.79022141.8 | 19.9670.201 | 18.3600.073 | 17.7830.107 | 16.8670.065 | SOri56 |
| UGCS J053824.71030028.3 | 20.0990.193 | 18.8250.098 | 17.8050.107 | 17.3570.109 | |
| UGCS J053829.50025959.1 | 19.4980.113 | 18.4250.069 | 17.8440.111 | 16.9350.074 | |
| UGCS J053713.22022449.1 | 19.9040.148 | 18.7830.090 | 17.4170.048 | 17.3570.093 | edge |
| UGCS J053916.72023348.4 | 20.0280.192 | 18.9500.111 | 18.6020.195 | 17.4050.095 | |
| UGCS J053937.52023041.9 | 20.1470.208 | 18.9610.110 | 18.1990.130 | 17.6220.114 | SOri60 |
| UGCS J053944.98023818.7 | 20.1740.220 | 18.9500.111 | 17.7340.087 | 16.9580.063 | dubious |
| UGCS J053949.52023129.7 | 20.0870.197 | 18.9220.106 | 18.2910.140 | 17.5020.102 | red |
| UGCS J053857.52022905.5 | — | 18.9630.181 | 18.4720.101 | 17.4830.000 | |
| UGCS J053951.31024942.1 | — | 17.8950.054 | 17.1540.054 | 16.7870.000 | close to bright star |
| UGCS J053911.32022431.2 | — | 18.9680.142 | 18.1080.099 | 17.3370.000 | in Subaru survey |
| UGCS J053834.00025753.3 | — | 17.5990.054 | 17.0440.051 | 16.5110.000 | close to bright star |
| UGCS J053904.73020831.5 | — | 18.9790.121 | 17.9710.113 | 17.4510.000 | in Subaru survey |
-
a
IAU designations include J2000 (RA,dec) coordinates from UKIDSS GCS DR4.
Appendix C Members recovered by the GCS
| R.A.a | Dec.a | Commentsb | |||||||
|---|---|---|---|---|---|---|---|---|---|
| h:m:s | d:’:” | mag | mag | mag | mag | mas/yr | mas/yr | ||
| 05:36:46.91 | 02:33:28.3 | 14.6360.003 | 14.0860.002 | 13.4740.002 | 12.9270.002 | 12.6440.002 | 8.1 | 5.5 | M1773275 |
| 05:36:58.07 | 02:35:19.4 | 16.4570.009 | 15.6910.006 | 15.0430.006 | 14.5400.005 | 14.1740.006 | 7.3 | 3.0 | M1599271 |
| … | … | … | … | … | … | … | … | … | … |
| 05:40:09.32 | 02:26:32.6 | 19.4840.085 | 18.3040.039 | 17.3920.027 | 16.8780.039 | 16.2090.032 | — | — | SOri 52 |
| 05:40:13.96 | 02:31:27.4 | 16.2950.008 | 15.2720.005 | 14.4920.004 | 14.0340.004 | 13.5600.003 | 5.9 | 4.1 | KJN63 |
| 05:40:34.40 | 02:44:09.5 | 14.9510.004 | 14.2910.003 | 13.6810.003 | 13.1550.002 | 12.7770.002 | 5.9 | 8.3 | BNLJ63 |
-
a
Coordinates in J2000 from the UKIDSS GCS DR4.
-
b
Names in the last column are as follows: M stands for the Mayrit catalogue (Caballero 2008c), KJN for members in Kenyon et al. (2005), BNLJ for objects in Table 3 of Burningham et al. (2005), and SOri nomenclature comes from the work by Béjar et al. (1999), Zapatero Osorio et al. (2000), and Béjar et al. (2001a). Four sources are spectroscopic binaries (M258337, M459224, M873229, M1493050; Maxted et al. 2008) and three (S36, S42, S97) are classified as non-members by Sacco et al. (2008).
Appendix D Published sources classified as non-members by the GCS
| R.A.a | Dec.a | Commentsb | |||||||
| h:m:s | d:’:” | mag | mag | mag | mag | mag | mas/yr | mas/yr | |
| 05:38:38.89 | 02:28:01.7 | 16.332 | 15.844 | 15.276 | 14.735 | 14.405 | 0.4 | 10.3 | M487350 ([SE 2004]70; blue ) ) |
| 05:38:41.46 | 02:35:52.3 | 15.478 | 99.999 | 13.963 | 13.399 | 12.958 | 0.5 | 0.8 | M500279; No photometry |
| 05:38:47.90 | 02:37:19.4 | 13.148 | 12.771 | 12.205 | 11.449 | 10.908 | 28.8 | 26.3 | M92149 (PM NM) |
| 05:38:51.00 | 02:49:13.9 | 16.149 | 15.620 | 15.044 | 14.424 | 14.106 | 7.6 | 13.1 | M799173 (blue ) |
| 05:39:06.97 | 02:12:16.9 | 14.358 | 14.132 | 13.666 | 13.102 | 12.967 | 3.2 | 3.4 | M1462013 (blue ) |
| 05:39:07.60 | 02:29:05.6 | 16.201 | 15.553 | 14.874 | 14.299 | 13.928 | 43.3 | 7.0 | M537040 (SOri 20; PM NM) |
| 05:39:26.47 | 02:26:15.5 | 14.255 | 13.927 | 13.375 | 12.719 | 12.459 | 0.8 | 0.3 | M856047 (blue ) |
| 05:40:25.80 | 02:48:55.3 | 16.285 | 15.974 | 15.455 | 14.435 | 13.334 | 0.5 | 3.1 | M1701117 (blue ) |
| 05:39:16.58 | 02:38:25.4 | 20.270 | 19.837 | 19.113 | 18.204 | 18.151 | — | — | SOri 26 (M4.5) |
| 05:37:07.21 | 02:32:44.2 | 16.649 | 16.098 | 15.498 | 14.937 | 14.614 | 7.5 | 12.8 | SOri 34 |
| 05:39:38.50 | 02:31:13.3 | 17.870 | 17.285 | 16.590 | 16.061 | 15.719 | — | — | SOri 41 |
| 05:38:13.96 | 02:35:01.3 | 18.335 | 17.591 | 16.926 | 16.376 | 15.966 | — | — | SOri 43 |
| 05:38:07.11 | 02:43:20.9 | 18.602 | 17.882 | 17.172 | 16.667 | 16.244 | — | — | SOri 44 (M7) |
| 05:38:23.02 | 02:37:55.1 | 99.999 | 19.670 | 18.849 | 18.031 | 17.862 | — | — | SOri 49 (M7.5) |
| 05:39:47.05 | 02:25:24.5 | 99.999 | 19.988 | 18.934 | 99.999 | 17.932 | — | — | SOri 57 |
| 05:39:10.02 | 02:28:11.5 | 15.504 | 15.044 | 14.533 | 13.990 | 13.706 | 20.6 | 23.6 | SOri J053909.9-022814 (M5) |
| 05:40:34.61 | 02:33:13.8 | 15.103 | 14.675 | 14.115 | 13.489 | 13.204 | 6.6 | 12.5 | KJN29, phot NM |
| 05:39:10.02 | 02:28:11.5 | 15.504 | 15.044 | 14.533 | 13.990 | 13.706 | 20.6 | 23.6 | KJN33,SOriJ053909.9022814, phot NM |
| 05:38:18.17 | 02:43:34.9 | 15.473 | 15.137 | 14.636 | 14.036 | 13.775 | 6.6 | 7.6 | KJN34, phot NM |
| 05:40:17.06 | 02:26:49.0 | 15.885 | 15.514 | 14.963 | 14.413 | 14.104 | 19.1 | 5.7 | KJN45, phot NM |
| 05:38:46.59 | 02:19:40.4 | 16.356 | 15.914 | 15.352 | 14.795 | 14.479 | 7.3 | 10.6 | KJN53, phot NM |
| 05:39:43.39 | 02:53:23.0 | 16.439 | 15.899 | 15.293 | 14.791 | 14.452 | 12.4 | 10.7 | KJN59, phot NM |
| 05:38:33.34 | 02:20:59.4 | 19.968 | 18.905 | 18.026 | 17.244 | 16.598 | — | — | SOri 54 (M9.5) |
| 05:39:03.60 | 02:25:36.6 | 20.469 | 19.062 | 18.362 | 17.900 | 17.067 | — | — | SOri 58 (L0) |
| 05:39:26.77 | 02:26:14.3 | 17.633 | 16.888 | 16.224 | 15.688 | 15.261 | — | — | SOri J053926.8-022614 |
| 05:39:48.26 | 02:29:14.3 | 17.881 | 17.079 | 16.382 | 15.834 | 15.366 | — | — | SOri J053948.1-022914 (M7) |
| 05:37:18.69 | 02:40:22.0 | 13.103 | 12.807 | 12.314 | 12.055 | 11.800 | 17.4 | 25.7 | SO 9 |
| 05:37:23.05 | 02:32:46.7 | 15.126 | 99.999 | 14.159 | 13.592 | 13.319 | 22.3 | 14.2 | SO 27 |
| … | … | … | … | … | … | … | … | … | … |
| 05:39:56.83 | 02:53:14.6 | 20.433 | 19.160 | 18.202 | 17.746 | 17.183 | — | — | |
| 05:39:57.62 | 02:47:36.0 | 13.995 | 13.668 | 13.165 | 12.537 | 12.326 | 7.3 | 4.7 | SO 1296 |
-
a
Coordinates in J2000 from UKIDSS GCS DR4
-
b
The last column provides the original names found in the literature.
-
Note:
The first part of the table lists objects from the Mayrit catalogue; the second part lists objects published by Béjar et al. (1999), Zapatero Osorio et al. (2000), and Béjar et al. (2001a), the third part lists candidates classified as “Maybe” by Kenyon et al. (2005), the fourth part lists objects lying at the borderline between members and non-members, the last section gives mid-infrared sources published by Hernández et al. (2007) and Luhman et al. (2008).
Appendix E New members identified in the GCS
| IAU Namesc | |||||||
|---|---|---|---|---|---|---|---|
| mag | mag | mag | mag | mag | mas/yr | mas/yr | |
| UGCS J053649.28024354.4 | 14.3630.003 | 13.8760.002 | 13.3150.002 | 12.6660.002 | 12.3520.001 | 2.1 | -1.3 |
| UGCS J053649.97023522.6 | 14.9310.004 | 14.4240.003 | 13.8490.003 | 13.2590.002 | 13.0030.002 | 3.6 | -1.2 |
| … | … | … | … | … | … | … | … |
| UGCS J054020.79022400.1 | 18.6880.044 | 17.6660.023 | 16.8860.018 | 16.3770.025 | 15.7890.022 | — | — |
| UGCS J054034.08022602.5 | 18.0420.026 | 17.3310.018 | 16.5150.014 | 15.7560.015 | 15.2300.014 | — | — |
-
a
Additional () photometry is available in Béjar (2001).
-
b
The full list is ordered by right ascension and is available in the electronic version of the journal
-
c
IAU designations include J2000 (RA,dec) coordinates from UKIDSS GCS DR4
Appendix F Variable sources
| IAU Namea | diff | diff | diff | Comments | ||||||
|---|---|---|---|---|---|---|---|---|---|---|
| mag | mag | mag | mag | mag | mag | mag | mag | mag | ||
| UGCS J053753.98024954.5 | 14.076 | 12.786 | 11.960 | 14.520 | 13.250 | 12.455 | 0.444 | 0.464 | 0.495 | M1129222b |
| UGCS J053820.50023408.9 | 13.651 | 12.591 | 11.931 | 12.652 | 11.918 | 11.648 | 0.999 | 0.673 | 0.283 | M380287c |
| UGCS J053834.46025351.5 | 15.292 | 14.262 | 12.973 | 15.535 | 14.043 | 12.651 | 0.243 | 0.219 | 0.322 | M1082188d |
| UGCS J053849.29022357.6 | 14.536 | 14.115 | 13.524 | 14.362 | 13.699 | 13.197 | 0.174 | 0.416 | 0.327 | M726005e |
| UGCS J053904.59024149.2 | 13.746 | 13.147 | 12.389 | 13.962 | 12.910 | 12.224 | 0.216 | 0.237 | 0.165 | M458140f |
| UGCS J053838.59030220.1 | 13.913 | 13.187 | 12.660 | 13.711 | 12.962 | 12.566 | 0.202 | 0.225 | 0.094 | M1583183d |
| UGCS J053855.42024120.9 | 15.336 | 14.615 | 13.979 | 15.622 | 14.842 | 13.968 | 0.286 | 0.227 | 0.011 | M358154g |
| UGCS J053825.43024241.2 | 14.793 | 14.334 | 13.729 | 14.877 | 14.157 | 13.572 | 0.084 | 0.177 | 0.157 | M495216h |
| UGCS J053823.34022534.6 | 13.802 | 13.115 | 12.583 | 13.685 | 12.928 | 12.424 | 0.117 | 0.187 | 0.159 | M703333g |
| UGCS J053838.12023202.6 | 14.808 | 14.270 | 13.449 | 14.800 | 13.771 | 13.197 | 0.008 | 0.499 | 0.252 | M258337g |
-
Note:
The top part of the table lists sources showing variability in whereas the bottom part lists objects variable in two bands only.
-
a
IAU designations include J2000 (RA,dec) coordinates from UKIDSS GCS DR4
-
b
Weak H detection reported by Weaver & Babcock (2004)
-
c
M4 with detection of lithium and H equivalent width of 28Å (Zapatero Osorio et al. 2002b)
-
d
M1082188 and M1583183 were reported for the first time by Caballero (2008c) as photometric member candidates
- e
- f
- g
- h