11email: egiacani@iafe.uba.ar 22institutetext: XMM-Newton Science Operations Centre, ESAC/Selex I. S., Villafranca del Castillo, Spain
33institutetext: XMM-Newton Science Operations Centre, ESAC/INSA, Villafranca del Castillo, Spain
Radio and X-ray study of two multi-shell supernova remnants: Kes 79 and G352.7-0.1
Abstract
Aims.
Methods.
Results.
Abstract
Aims. We investigate two multi-shell galactic supernova remnants (SNRs), Kes 79, and G352.70.1, to understand the causes of this morphology.
Methods. The research was carried out based on new and reprocessed archival VLA observations and XMM-Newton archival data. The surrounding gas was investigated based on data extracted from the HI Canadian Galactic Plane Survey, the 13CO Galactic Ring Survey, and the HI Southern Galactic Plane Survey.
Results. The present study infers that the overall morphology of both SNRs is the result of the mass-loss history of their respective progenitor stars. Kes 79 is likely to be the product of the gravitational collapse of a massive O9 star evolving near a molecular cloud and within the precursor’s wind-driven bubble, while G352.70.1 should be the result of interactions of the SNR with an asymmetric wind from the progenitor together with projection effects. No radio point source or pulsar wind nebula was found to be associated with the X-ray pulsar CXOU J185238.6+004020 in Kes 79. The X-ray study of G352.70.1 found that most of the thermal X-ray radiation completely fills the interior of the remnant and originates in heated ejecta. Characteristic parameters, such as radio flux, radio spectral index, age, distance, shock velocity, initial energy, and luminosity, were estimated for both SNRs.
Key Words.:
X-rays – Radio continuum – Supernova remnants – individual object: Kes 79, G352.70.1 – ISM1 Introduction
It is expected that between about 70 to 80% of the Galactic supernova remnants (SNRs) originate in the gravitational collapse of massive stars that end their lives with powerful supernova explosions of type Ib, Ic, and II. In these cases, it is likely that the SNRs initially expand inside the wind-driven bubble created by the progenitor stars and as a result their evolution differs considerably from that predicted for an unperturbed surrounding medium. The presence of forward and reflected shocks as well as peculiar density gradients determine the structure, shape, and duration of the successive evolutionary stages of these SNRs.
Several analytical and numerical studies have been devoted to the exploration of the interaction between supernova (SN) ejecta and wind-driven shells (e.g., Franco et al. 1991 and references therein; Dwarkadas 2005). SN 1987A is probably the clearest observational example of the influence of the past history of the exploding star in shaping the observed remnant.
It has been suggested that the multi-shell appearance observed in the SNRs Cygnus Loop and 3C400.2, for example, can be explained as the product of a SN explosion within a wind-driven bubble (Gvaramadze 2006 and Velázquez et al. 2001, respectively for the Cygnus Loop and 3C400.2 cases). In the case of Cas A, Borkowski et al. (1996) modeled X-ray emission originating in a SN explosion within a wind-blown cavity, and Reynoso et al. (1997) discovered the cold envelope of this cavity with HI absorption measurements. The multi-shell morphology can also result from the proper motion of the precursor massive star that may cause the star to explode far from the geometric center of its wind bubble, as proposed by Gvaramadze (2006). Alternative scenarios can be the existence of multiple shocks after the encounter of the blast wave with a density jump in the surrounding medium, or from simple projection effects either from three-dimensional structures of the same SNR or from multiple SNRs along the line of sight (as proposed by Uyanıker et al. 2002 to explain the morphology of Cygnus Loop). In any case, the detailed observational study of multi-shell SNRs provides insight into evolutionary and structural theories of SNRs.
To carry out a multiwavelength imaging and spectral study of this phenomenon, we selected two Galactic SNRs, Kes 79 (G33.6+0.1) and G352.7-0.1, that exhibit clear multi-shell radio structures and also have X-ray emission detected in their interiors. The present research is complemented by the study of the surrounding interstellar gas to investigate the presence of density inhomogeneities in the interstellar medium (ISM) that may have affected the expansion of the SNR shocks.
2 The selected sources
Kes 79: This is a Galactic SNR located at a distance of 7.1 kpc (Case & Bhattacharya, 1998). At 1.5 GHz and 5 GHz, it appears to consist of two concentric incomplete shells with several short and bright filaments in their interior (Velusamy et al., 1991). Based on Chandra data, Sun et al. (2004) describe the associated X-ray emission as rich in spatial structures, including filaments, three partial shells, and other features named by the authors as the “loop” and the “protrusion”. Most of the X-rays come from the central region. In addition, Chandra observations of Kes 79 in the 0.8-8 keV energy range detected the compact X-ray source CXOU J185238.6+004020, located close to the geometric center of the SNR (Seward et al., 2003). Later XMM-Newton observations in the 0.3-10 keV energy band detected pulsations from CXOU J185238.6+004020 with a period of 105 ms (Gotthelf et al., 2005; Halpern et al., 2007). This source is likely to be the compact stellar remnant formed in the supernova event, although no evidence of a surrounding pulsar wind nebula (PWN) was found in X-rays.
It was suggested that Kes 79 is interacting with a molecular cloud that partially surrounds the east and southeast borders of the SNR (Scoville et al., 1987; Green & Dewdney, 1992). Green & Dewdney (1992) reported the detection of bright HCO+ J=1–0 emission from the eastern portion of the remnant at radial velocities close to 105 km s-1. Taking into account the spatial and kinematical correspondences, the authors suggested that this emission emanates from material associated with the adjacent molecular cloud that has been shocked by the SNR. Further evidence of this interaction was provided by the observation of a broad and faint absorption feature seen in the OH spectrum between 95 and 115 km s-1 (Green, 1989).
G352.70.1: This SNR was classified as shell-like type, with a size of 8 and a global spectral index of (S ) (Green, 2009). A VLA image of G352.70.1 obtained at 1.4 GHz with an angular resolution of 34′′ (Dubner et al., 1993) showed the presence of two concentric ring structures and a conspicuous unresolved bright spot over the eastern limb, whose origin was unclear. This bright source was later resolved by higher angular resolution observations and catalogued in the “New Catalog of Compact 6 cm Sources in the Galactic Plane” (White et al., 2005) as two separate point-like sources, WBH2005 352.7750.153 and WBH2005 352.7720.149. However, their connection with the SNR has yet to be clearly established.
Kinugasa et al. (1998) presented an ASCA X-ray image of G352.70.1 describing the emission as a shell that roughly coincides with the inner radio shell. The X-ray spectrum shows prominent K-shell lines from highly ionized Si, S, and Ar, interpreted as emission originating in shock-heated optically thin hot plasma. Kinugasa et al. (1998) proposed that G352.70.1 is a middle-age (2200 years old) SNR located at 8.5 kpc, evolving within a pre-existing cavity created by the stellar wind of the progenitor.
In what follows, we present new and reprocessed images in radio and in X-rays of these two SNRs, in an attempt to understand the origin of the observed characteristics.
3 New radio and X-ray data
3.1 Radio data
Kes 79 was observed as part of a high resolution study of the neighboring SNR W44, at 74 and 324 MHz using the VLA111The Very Large Array of the National Radio Astronomy Observatory is a facility of the National Science Foundation operated under cooperative agreement by Associated Universities, Inc. in the B configuration on June 15, 2002 and in the A configuration in two sessions on August 31 and September 1, 2003. Additional observations at 324 MHz were performed in the C and D arrays on December 14, 2002 and February 27, 2003, respectively. Details of the observations and reduction procedures are described in Castelletti et al. (2007). Since Kes 79 is far from the phase center of these observations, the images at both frequencies were corrected for the primary beam attenuation. The synthesized beam, rms noise level and other observational parameters are listed in Table 1. It is important to remark that the images at both frequencies are sensitive to all spatial scales because the size of Kes 79 () is smaller than the largest well imaged structures at the respective frequencies (36′ at 74 MHz and 70′ at 324 MHz).
We also reprocessed VLA archival data obtained in the direction of Kes 79 at 1.5 GHz. The observations were taken on July 4, 1989 (BnC configuration, project code AV166), and on December 24, 1989 (D configuration, project code AV165). The interferometric data were combined in the uv plane with single-dish information extracted from the Effelsberg 100 m 1.4 GHz Survey (Reich et al., 1990) to recover structures at all spatial frequencies.
To investigate in detail the radio emission close to the X-ray pulsar candidate while searching for a radio pulsar wind nebula, we also reprocessed 4.8 GHz data corresponding to observations carried out with the VLA in the D array in 1984, September 8 (Project code AD131) and in the D and BnC configurations in 1989, July 3 and 4, respectively (Project code AV165 and AV166, respectively). These data are only useful for the study of structures smaller than , which correspond to the largest angular scale that can be imaged reasonably well with the array at this frequency. Since no single dish data at 4.8 GHz are publicly available for this region, the largest scale structures have not been fully recovered and therefore no attempt to estimate the total flux density is made at this frequency.
For the SNR G352.70.1 we reprocessed VLA archival data at 1.4 and 4.8 GHz. The observations at 1.4 GHz were performed in the CnD array on February 23, 1991 (project AD260). The image at 4.8 GHz was produced from the observations carried out in the DnC configuration on November 3, 1985 (project AH206). Observational parameters are also included in Table 1. As in the case of Kes 79, we did not derive the total flux density of this SNR at 4.8 GHz because the largest angular scale contributions are missing.
| Frequency | Beam | PA | Noise | Flux Density |
| (MHz) | ( ′′′′ ) | ∘ | (mJy beam-1) | (Jy) |
| Kes 79 | ||||
| 74 | 39.036.0 | 60 | 7610 | |
| 324 | 13.313.2 | 5.8 | 398 | |
| 1500 | 18.617.0 | 1.24 | 11.01.5 | |
| 4800 | 14.513.0 | 0.34 | ||
| G352.7-0.1 | ||||
| 1400 | 37.033.0 | 18.33 | 1 | 3.10.3 |
| 4800 | 12.0 9.0 | -41.34 | 0.2 |
3.2 X-ray data
For Kes 79, we analyzed two XMM-Newton observations, 0204970201 and 0204970301, which were performed on October, 17-18 2004 and on October, 23-24 2004, respectively, with a 30 ks duration each. In both observations, the MOS cameras were operated in full frame mode, with a medium filter. The complete extent of the SNR was included in the MOS fields of view. As the PN camera was operated in small window mode only part of the remnant was detected, and hence we did not include these data in our analysis.
In the case of G352.70.1, we analyzed the XMM-Newton observation 0150220101 which was performed on October 3, 2002. Both MOS and PN cameras were operated in full frame mode with a medium filter. The net exposure times were about 25 ks and 20 ks for the MOS and PN cameras, respectively.
For both remnants the raw event files were obtained from the XMM-Newton Science Archive. The data were processed with the Science Analysis System (SAS) version 8.0 and the most up-to-date calibration files. The astrometry of the resulting images was confirmed to be accurate to about 5′′.
4 Results for Kes 79
4.1 Radio emission distribution
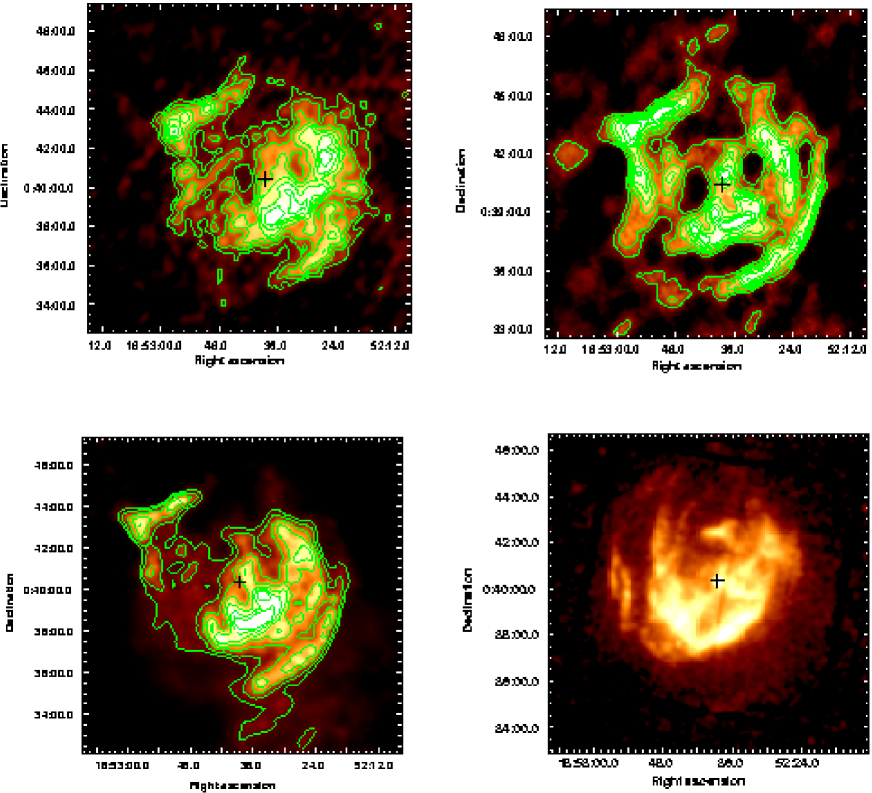
We present the first radio image of Kes 79 at 74 MHz and the highest angular resolution image ever obtained at 324 MHz (Fig. 1, upper panels). Figure 1 also includes the reprocessed image at 1.5 GHz (lower left panel), which represents an improvement with respect to the previously published one because with the addition of single-dish data all spatial frequencies are present. In Fig. 1 (lower right panel), we have also included for comparison the XMM-Newton image obtained in the energy range (0.55) keV.
The new low-frequency radio images show the same double shell structure previously noticed by Velusamy et al. (1991) at higher frequencies. The outer radio shell, about 10′ in size, is circularly symmetric along the SW and W borders of the remnant, while towards the NE and E the shell has a protrusion close to Dec that inverts the shape into a concave curvature. The inner radio shell, about in size, is brighter than the outer one at all inspected radio frequencies. It looks incomplete and fragmented. Towards the S, this shell consists of a series of short arc-like filaments, while towards the E it is fainter and rather straight.
The high angular resolution and sensitivity achieved at 324 MHz shows the presence of a small cometary-like feature, about 60 in size, near the geometric center of the remnant, the X-ray compact source CXOU J185238.6+004020 lying at the southern border of this structure, whose maximum is about north. We note that the morphology of this nebula is similar to that of some radio pulsar wind nebula (PWN), motivating us to develop future investigations (see Sect. 4.2).
On the basis of the new images, we estimated the flux density at 74, 324, and 1500 MHz. The results are listed in Table 1 together with the observational parameters. The errors quoted in the flux density estimates include the rms noise of each image and uncertainties in the determination of the boundaries of the SNR emission. We note that the total integrated flux density estimated at 1.5 GHz based on the interferometric observations, agrees within the errors with earlier estimates obtained from single-dish observations and presented by Beard & Kerr (1969) (S 9 Jy) and Altenhoff et al. (1970) (S 13 0.4 Jy). This confirms the accuracy of the flux density estimate and the spectral study discussed in the next section.
4.2 Radio spectral index
We carried out a study of the global radio continuum spectrum of Kes 79, based on our low radio frequencies images at 74 and 324 MHz and the reprocessed 1.5 GHz data together with those taken from the literature. Table 2 lists the values used to fit the global radio spectrum. We do not include flux densities obtained from either observations made with instruments having insufficient resolution, or those in strong disagreement with other measurements made at nearby frequencies. Most of the measurements for frequencies above 408 MHz were brought to the absolute flux density scale of Baars et al. (1977). In some cases, an estimate of the correction factor was unavailable because the original reference did not list the assumed flux densities of the primary calibrators. Below 408 MHz, where the systematic error of the scale of Baars et al. (1977) is more than 5, no scaling was applied. These values have nevertheless been included in our fit because they do not exhibit a large spread.
| Frequency | Scaled flux | References | Frequency | Scaled flux | References |
|---|---|---|---|---|---|
| (MHz) | density (Jy) | (MHz) | density (Jy) | ||
| 30.9 | 9419(a) | Kassim (1989) | 408 | 44.0 7.0 | Kesteven (1968) |
| 74 | 76 10 (b) | This work | 430 | 34 10(c) | Kundu & Velusamy (1967) |
| 80 | 101 23(a) | Dickel (1973) | 1410 | 9.0 3.0 | Beard & Kerr (1969) |
| 80 | 54 8(a) | Slee (1977) | 1414 | 13.0 0.4 | Altenhoff et al. (1970) |
| 80 | 70 20(a) | Dulk & Slee (1972) | 1415 | 20.0 6.0 | Caswell et al. (1981) |
| 83 | 76 12(a) | Kovalenko et al. (1994) | 1500 | 11.5 1.5(b) | This work |
| 111 | 64 12(a) | Kovalenko et al. (1994) | 2650 | 8.0 2.0 | Beard & Kerr (1969) |
| 160 | 57 17(a) | Slee (1977) | 2695 | 9.0 0.4 | Altenhoff et al. (1970) |
| 324 | 39 8(b) | This work | 5000 | 5.2 0.4 | Altenhoff et al. (1970) |
| 330 | 35 7(a) | Kassim (1992) | 5000 | 7.8 0.8 | Caswell et al. (1975) |
| 408 | 34.4 3.4 | Caswell et al. (1975) | 10600 | 6.7 1.5 | Becker & Kundu (1975) |
-
(a)
No correction to Baars et al. (1977) scale was applied.
-
(b)
Flux density scale from VLA Calibrator Manual, http:/www.aoc.nrao.edu/gtaylor/calib.html.
-
(c)
The correction factor was not available.
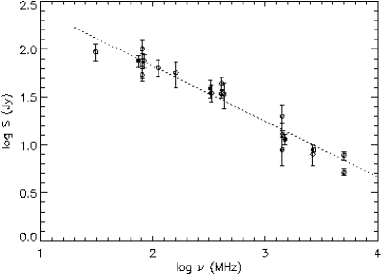
The radio spectrum of SNR Kes 79 traced from all frequencies listed in Table 2 follows a single power law across four orders of magnitude in frequency, with an index = 0.580.03, and the fitting is shown in Fig. 2.
We also searched for variations in the spectral index across the remnant by comparing the brightness distribution at the different observed frequencies. To study the spectral variations as a function of position within the remnant, we produced multifrequency images of identical beam size and shape. For our study, the uv data at 324 MHz were tapered to match the synthesized beam of the data at 74 and 1500 MHz. The images were also aligned and interpolated to identical projections (e.g., field center, pixel separation).
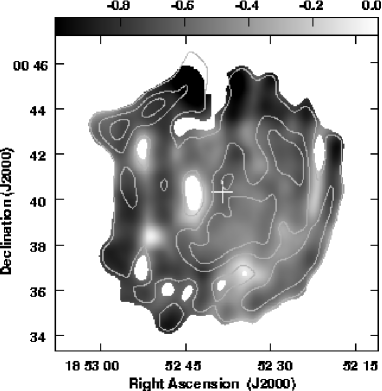
Following the same behavior noted above for the global spectral index, which is constant over several decades in frequency, we find that the spatial distribution of the radio spectrum between 74 and 324 MHz, is morphologically similar to the spectral map traced between 324 and 1500 MHz. In Fig. 3, we show this last comparison degraded to an angular resolution of 40′′ to remove unphysical small scale fluctuations. In the comparison, the respective signals of each radio image were clipped at a 4 rms noise level. In Fig. 3, dark areas correspond to a steep spectrum (), while light gray corresponds to flatter indices (). The uncertainties vary between 0.04 and 0.1 depending on the intensity of the emission compared. A few contours of the radio intensity at 324 MHz are superimposed for reference. The radio spectral index distribution is practically featureless, with little departure from the global spectral index (). Darker regions observed close to the limb of the SNR are probably caused by the larger uncertainties in regions of low emission at 1.5 GHz.
We also conducted a careful study of the radio spectrum close to the small nebulosity identified in the image at 324 MHz as a possible PWN candidate. If this is the nebula created by fresh particles and magnetic fields injected by the pulsar detected in X-rays (shown with a plus sign in Fig. 3), a flat radio spectrum with between and 0 is expected for it (Gaensler & Slane, 2006). To carry out this search, we used our data at 324 MHz and the reprocessed archival data at 1.5 and 4.8 GHz. As mentioned in Sect. 3.1, at 4.8 GHz the largest scale structures have not been fully recovered, but the flux density estimate for this small structure is reliable because the size of the studied feature is smaller than the largest well imaged structure at 4.8 GHz (5′). We obtained a total flux density for the nebular emission of 0.260.10 Jy, 0.110.03 Jy, and 0.050.06 Jy at 324, 1500, and 4800 MHz, respectively. The errors quoted include the rms noise of each image and the uncertainty in the choice of the integration boundaries. We derive a radio spectral index between 324 and 4800 MHz. This steep value, compatible with the global spectral index of Kes 79, rules out the possibility that this feature is the radio PWN.
In summary, the detailed radio spectral study carried out for the first time in the SNR Kes79 allows us to conclude that both inner and outer radio shells have similar spectral properties and no traces of radio PWN are found near the point X-ray source CXOU J185238.6+004020.
4.3 The environs of Kes 79
We investigated the distribution of the interstellar gas in the surroundings of Kes 79. We mapped the neutral gas in its vicinity to search for morphological and kinematical signatures of atomic material associated with the SNR. The HI data were extracted from the Canadian Galactic Plane Survey (CGPS, see Taylor et al. 2003 for details). The final data have an angular resolution of about 1′ and the velocity resolution is 1.3 km s-1 with a channel separation of 0.82 km s-1.
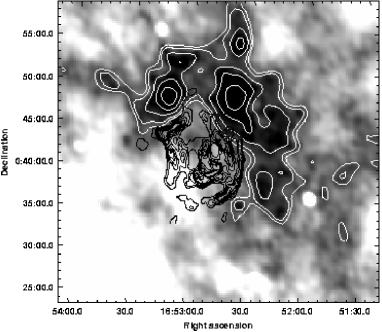
After careful inspection of the entire HI cube, we find that the only channels with an indication of possible physical association are limited to the velocity range between +90 and +99 km s-1 (all velocities are referred to the local standard of rest). Figure 4 shows the HI distribution averaged over the aforementioned velocity interval, with some contours of Kes 79 at 324 MHz superimposed for reference. In this figure, an open HI shell with a radius of about 8, centered close to , (J2000.0), which embraces most of the periphery of Kes 79, can be identified. Interestingly, part of this shell exactly matches the shape of the radio continuum emission along the NE flattened border, close to , .
If we assume that the HI gas in this velocity range is physically associated with Kes 79, we can adopt v km s-1 as the systemic velocity of Kes 79. By applying the flat Galactic rotation curve of Fich et al. (1989) (with R⊙=8.5 kpc and V⊙ = 220 km s-1), we obtain kinematic distances of either 6.5 or 7.5 kpc. The difference between these two values is caused by the distance ambiguity in the inner part of the Galaxy and both are in good agreement with the distance of 7.1 kpc proposed by Case & Bhattacharya (1998). In the absence of any additional discriminator between the two kinematical distances, in what follows we adopt a distance to Kes 79 of 7 kpc.
We can derive a number of parameters characterizing the HI shell. By assuming optically thin gas and integrating the column density between +90 and +99 km s-1, the total mass in the shell is about 3000 M⊙. A density of cm-3 is calculated for the HI shell by assuming that its radius and thickness are about 17 pc and 10 pc, respectively (8′.5 and 5′ at the adopted distance of 7 kpc). If this shell was formed by ISM swept up by the SNR shock, then the kinetic energy injected into the ISM is about erg. This value was calculated by assuming an expansion velocity of 7 km s-1, as suggested from the HI data. This expansion velocity is a lower limit, since confusion from unrelated foreground and background emission impedes the detection of possible caps of the expanding shell. The estimated values have uncertainties of up to 40 caused mainly by the error in the distance, and secondarily by the choice of the background level, the expansion velocity, and the integration boundaries. The low expansion velocity found for this HI shell implies that this must be an old structure, probably created along thousand of years by the action of the precursor’s stellar wind.
We also investigated the molecular gas in the surroundings of Kes 79 using observations of the 13CO J=1–0 line at 110 GHz. The data were extracted from the Galactic Ring Survey (Jackson et al., 2006) for which the angular and spectral resolution are 46′′ and 0.21 km s-1, respectively. After examining the entire data cube, we found morphological signatures of a possible interaction between the SNR and the surrounding molecular material when limited to the velocity intervals (88.0 km s-1, 94.5 km s-1) and (99.0 km s-1, 109.0 km s-1). Figure 5 displays the distribution of the 13CO J=1–0 emission integrated from to 94.5 km s-1 (left) and between and 109 km s-1 (right) superimposed for comparison, on the XMM-Newton X-ray emission.
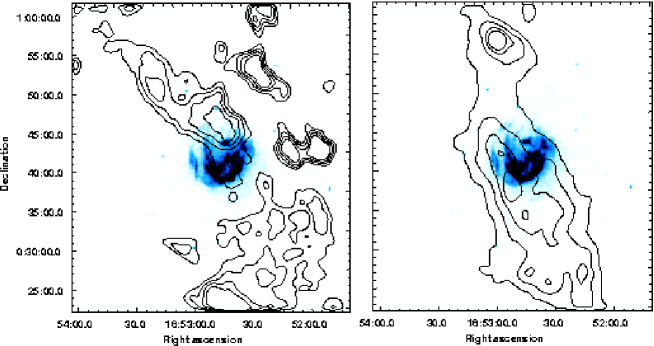
The first obvious conclusion is that the optically thin 13CO emission does not follow the same distribution as the HI. The most conspicuous molecular feature observed between and km s-1 is an elongated molecular cloud towards the NE of Kes 79, whose maximum coincides with a region of faint diffuse X-ray emission, suggesting that it is responsible for greater X-ray absorption. Between +99 and +109 km s-1 , an extended CO cloud is detected crossing the remnant from N to S. This molecular cloud coincides with the location of earlier detections of HCO+ and 12CO emission, and of the faint OH absorption reported by Green (1989) and Green & Dewdney (1992).
Neither of the two molecular clouds show direct kinematic evidence of interaction with Kes 79 (e.g., broadenings in the molecular spectra, asymmetries in the profiles), although the lack of these signatures of interactions is not uncommon in molecular clouds that are known to be interacting with SN shocks (e.g., as in the case of the SNR 3C 391, Wilner et al. 1998).
An estimate of the atomic and molecular gas column density between us and Kes 79 was calculated from N by assuming local thermodynamic equilibrium, a uniform excitation temperature T K for the 13CO J=1–0 transition along the line of sight, and a calibration ratio of N(H2)/N(13CO) (Dickman, 1978). The hydrogen column density obtained, cm-2, is compatible within errors with the absorbing column density estimated from the spectral fit of Chandra and XMM-Newton data for the entire remnant ( cm-2, Sun et al. 2004 and cm-2, this work).
4.4 Analysis of the X-ray emission and comparison with radio
Figure 6 shows the detailed comparison between radio at 324 MHz and X-ray emission features. It can be seen that the most intense and structured X-ray emission is confined to a circular region within the perimeter of the inner radio shell, while fainter and diffuse X-ray emission extends towards the outer radio limb. As noted before by Sun et al. (2004), an interesting correspondence can be observed between both type of emission, although the agreement is not exact. The best radio/X-ray matching occurs predominantly along the southern border of the inner radio shell, where one of the two curved bright radio filaments visible near RA , Dec , has an exact spatial correlation with bright X-ray emission. The second almost parallel radio filament in the region, however, does not have an X-ray counterpart. In the same inner south limb, the X-ray feature called the “loop” by Sun et al. (2004) (near , ), has a good correspondence with a faint radio feature. Towards the E, on the other hand, bright twisted X-ray filaments, which were suggested by Sun et al. (2004) to be thin shells viewed edge-on, are almost exactly correlated with the shape of the radio emission along the outer shell. Another peculiarity worth noting is that the eastern border of the inner shell appears to be almost straight in both spectral regimes. In addition, the flat radio border of Kes 79 near the northern border of the inner shell, around , , also corresponds with an X-ray bright feature.
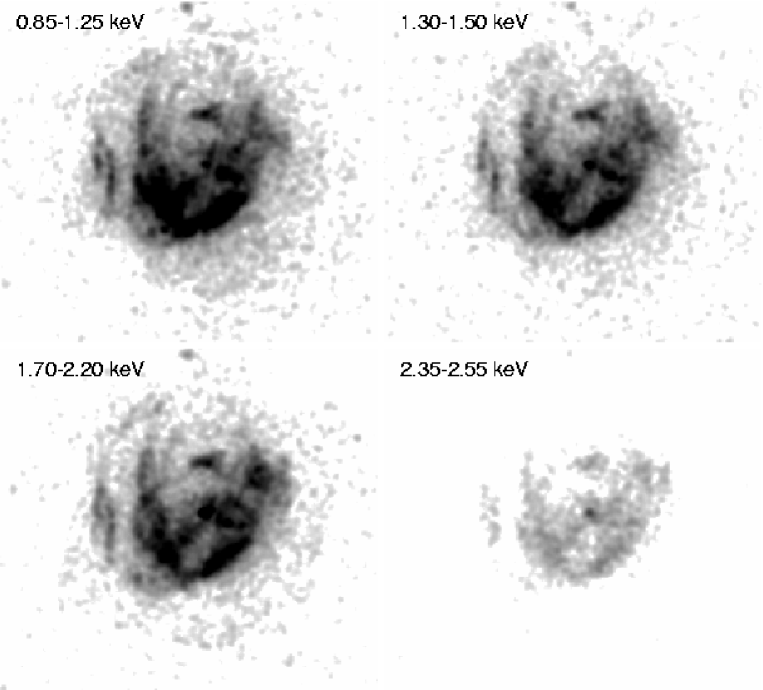
Narrowband images of Kes 79 were produced covering the emissions of Ne (0.85-1.25 keV), Mg (1.30-1.50 keV), Si (1.70-2.20 keV), and S (2.35-2.55 keV) (Fig. 7). The same gray scale is used in all four images to facilitate the comparison of data for the respective bands. The central emission is quite similar across the four bands and to the broadband emission displayed in Figs. 1 and 6, with the only exception of sulfur, which is notably weaker than the rest. From Fig. 7, it can be seen that the Mg and especially the Si band emission are more prominent in the northwest of the inner shell than that of the Ne band, whereas the Si emission in the south and southeast is weaker than that of either Ne or Mg.
4.5 X-ray spectroscopy
MOS spectra of both observations (namely 0204970201 and 0204970301) were extracted from a circular region centered on of radius, encompassing the complete SNR as observed in X-rays. The background spectra were obtained from four circular source-free regions of radius located roughly to the north, east, south, and west of the remnant.
We fit the data from both observations simultaneously using a non-equilibrium ionization collisional plasma model (Borkowski et al., 2001), VNEI version 2.0, in XPSEC 11.3. The absorption, temperature, ionization timescale, normalization, and abundances of Ne, Mg, Si, S, Ar, and Fe are free parameters, whereas other elemental abundances are frozen to the solar values of Anders & Grevesse (1989) after verifying that allowing them to vary does not significantly improve the model goodnessoffit.
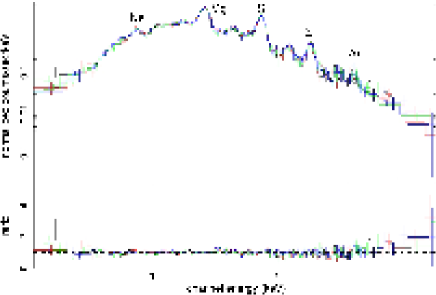
We obtained a statistically acceptable fit in the 0.5-5.0 keV band (reduced of 1.33 for 991 degrees of freedom) with parameters values listed in Table LABEL:Kes79xrayfit; the spectra and data to model ratios are shown in Fig. 8. The bestfit requires lower than solar abundances of Ne, Mg, Si, and Fe, a slight overabundance of S and a somewhat larger overabundance of Ar, although the last value is poorly constrained. Our results are consistent with those obtained from Chandra data by Sun et al. (2004) using the XSPEC VNEI plasma code (although the version is different), except for a 30% higher Ne abundance required for the XMM-Newton data.
| Parameters | Values |
|---|---|
| kT (keV) | |
| (s cm-3) | |
| Ne abundance | |
| Mg abundance | |
| Si abundance | |
| S abundance | |
| Ar abundance | |
| Fe abundance | |
| NH (cm-2) |
4.6 Discussion
The new high resolution, low frequency radio data confirm the multi-shell morphology of Kes 79. One of the scenarios proposed to explain the presence of concentric shells in SNRs is that of a SN forward shock propagating within a wind bubble created by the massive precursor star. The existence of an X-ray pulsar in the interior of Kes 79 confirms that the SN precursor was a massive star that generated powerful winds during its lifetime. As summarized in Sect. 1, theoretical models predict in these cases transmitted and reflected shocks that originated in the interaction of the SN shock with the structural features left by the stellar wind. In this framework, the outer shell would represent the blast wave moving into the dense wall of the bubble, while the inner shell would represent the reflected shock travelling back towards the remnant’s center.
Shocks of different origins should have different physical conditions (such as for example different compression ratios) and this should reflect in the synchrotron spectrum. From our detailed study, we found that the inner and outer shells have very similar spectral behavior, with a radio spectral index close to the global . Thus, in terms of the radio spectrum, our study found that the shells are indistinguishable.
We can investigate the nature of the SN precursor based on the properties of the observed swept-up HI shell (Fig. 4). For this HI structure, we derived a radius of 17 pc and a slow expansion velocity of 7 km s-1 . Assuming a linear expansion regime to first approximation, we estimate its age to be about yr. From the Chandra X-ray study, Sun et al. (2004) estimated that the age of Kes 79 is between and yr, depending on the assumed parameters (e.g., shock temperature, shock velocity, density contrast), while from radio data, we can set an upper limit to the age by applying Chevalier (1974)’s model, obtaining t= (R yr yr (where R 12.2 pc is the assumed radius of the radio remnant). In any case, since the SNR is orders of magnitude younger than the HI shell, the detected cold neutral envelope must have formed during the earlier history of the star and must be a wind-driven shell. We can therefore confidently use the physical parameters of the associated HI shell to estimate the power of the stellar wind and hence infer the spectral type of the progenitor star. Wind blown HI-shells such as the one detected around Kes 79 have been observed around other massive OB and WR stars (e.g., Giacani & Dubner 2004; Cappa et al. 2005; Cichowolski et al. 2008).
The kinetic energy of the HI shell structure can be compared with the mechanical energy released by a star into the ISM during the lifetime of the bubble, calculated with the equation E/2, where is the mass-loss rate of the star in , is the terminal velocity of the wind in km s-1, and is the dynamical age of the structure in years. If we assume that only one star has powered the observed bubble, a single O9 star with a mass-loss rate of M⊙/yr (Garmany et al., 1981) and a wind velocity of about 2000 km s-1 (Prinja et al., 1990) would be sufficient to sweep up the amount of interstellar gas observed to have accumulated in the shell, taking into account that the energy conversion efficiency in a bubble is no more than 20% (see Koo & McKee 1992). In this case, the mechanical energy released by this star into the ISM is about 8 erg, enough to explain the calculated kinetic energy of the slowly expanding HI shell (1.5 erg).
The elemental abundances derived from the new X-ray spectroscopy, are in general, consistent with the results of Sun et al. (2004), suggesting that we are not observing shocked stellar ejecta but swept-up interstellar matter cooling and evaporating in the post-shock region. This picture is compatible with a scenario of a middleage SNR evolving within a wind-driven bubble, where CSM and ISM have been crossed by forward and reverse shocks.
Based on the measured flux density at 324 MHz, we estimated the radio luminosity of Kes 79 to be L erg s-1, for the assumed distance of 7 kpc and the frequency range to Hz. When compared to the X-ray luminosity derived for this SNR by Sun et al. (2004) between 0.5 and 10 keV, the resulting ratio is over 100. Such high ratios are common in relatively young SNRs evolving within or at the edges of a molecular cloud, as in the case of Kes 79. A large amount of the kinetic energy of a SNR can transform into bright emission X-rays, as observed for example in N132D in the LMC (Banas et al., 1997) and in the Galactic SNR G349.7+0.2 (Slane et al., 2002).
5 Results for G352.7-0.1
5.1 Radio emission distribution
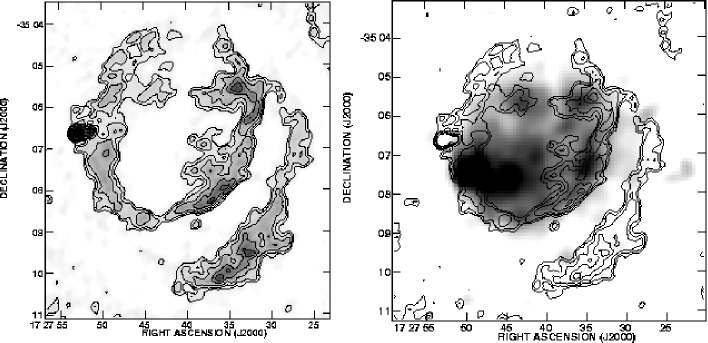
The new VLA image of G352.70.1 at 4.8 GHz is shown in the left panel of Fig. 9. The overall appearance of this image resembles that at 1.4 GHz obtained by Dubner et al. (1993), but the higher sensitivity and angular resolution achieved in the 4.8 GHz image indicate new internal emission, such as the features detected close to Dec (which strikingly match two X-ray maxima, as can be seen in Fig. 9, right), as well as considerable small scalefeatures across the shells. It also resolves the bright spot detected by Dubner et al. (1993) at 1.4 GHz at the eastern rim of G352.70.1 into the two point-like sources catalogued by White et al. (2005) as WBH2005 352.7750.153, centered on , , and WBH2005 352.7720.149, centered on , . As a control of the accuracy of the new 4.8 GHz radio image, we estimated the flux density of these two radio point sources, obtaining 18 mJy and 3.4 mJy for WBH2005 352.775-0.153 and WBH2005 352.772-0.149, respectively, values that are in very good agreement with those of 18.07 mJy and 3.34 mJy published by White et al. (2005).
Because of their peculiar location overlapping the SNR radio shell, it is important to discern whether one or both of these point-like sources are part of the SNR structure or they are aligned by chance along the line of sight. To investigate this issue, we calculated their radio spectral index between 1.4 and 4.8 GHz by carefully matching both images in all aspects (e.g., uv coverage, center and pixel alignment). Since the two radio sources cannot be resolved in the lower resolution 1.4 GHz image, the value of the spectral index is averaged across it. The flux density of the spot is 40 mJy at 1.4 GHz and 8.8 mJy at 4.8 GHz. In both cases, the contribution of the shell emission has been subtracted. The resulting spectral index is 1.3. To confirm this result, we also computed the spectral index using the T-T plot technique (Costain, 1960; Turtle et al., 1962). This method is useful because it is unaffected by absolute calibration and offset variations between the images. With this method, the spectral index is . Although the angular resolution of the available data does not allow us to estimate the spectral index for the two point-like sources separately, the obtained value suggests that these radio sources are extragalactic objects superimposed by chance along the line of sight. Higher angular resolution observations will help us to discern whether the peculiar double source appearance can be explained as having originated in clouds of radio-emitting plasma that were ejected by a distant active galactic nuclei (AGN) in narrow jets (the type of doublelobed sources called “DRAGN”, Double Radiosource Associated with Galactic Nucleus). For the present study of G352.70.1, the main conclusion is that the sources are not related to the SNR.
5.2 The distance to G352.70.1
We investigated the distribution of the interstellar gas in the direction of G352.70.1, with the hope of finding some morphological concordance between the SNR and the surrounding matter that would help us to constrain its systemic radial velocity. The HI distribution was inspected by analyzing data extracted from the Southern Galactic Plane Survey obtained with the Australia Telescope Compact Array and Parkes Radiotelescopes (McClure-Griffiths et al., 2005). The angular resolution of the survey is about 2′ and the velocity resolution, 0.82 km s-1. The numerous contributions of HI emission in this direction of the Galaxy, close to the Galactic center and above the Galactic plane, however, impeded the unambiguous identification of associated gaseous structures. We therefore limited our study to HI absorption.
HI absorption profiles were traced in the direction of bright emission radio continuum regions in G352.70.1, where we found that the most distant HI absorption feature towards G352.70.1 appears close to the radial velocity vLSR = 90 km s-1. By applying the Galactic circular rotation model of Fich et al. (1989), this LSR velocity corresponds to the near and far distances of 6.8 or 10.1 kpc. We can safely assume that 6.8 kpc is the lower limit to the distance to G352.7 0.1. The upper limit to the distance can be determined from the Galactic tangent point velocity, vLSR km s-1, which corresponds approximately to a kinematical distance of 8.4 kpc. Thus, the distance to G352.70.1 is in between 6.8 and 8.4 kpc. In a modern 2-armed spiral pattern of the inner galaxy (e.g., Dame & Thaddeus 2008; Englmaier et al. 2008), if G352.70.1 is located at 6.8 kpc, it would lie over the “near 3 kpc arm”, while at 8.4 kpc it would be part of the central bar. Since both of the obtained limits are plausible, we conclude that a value of kpc is an adequate estimate of the distance to G352.70.1.
5.3 Analysis of X-ray emission and comparison with radio
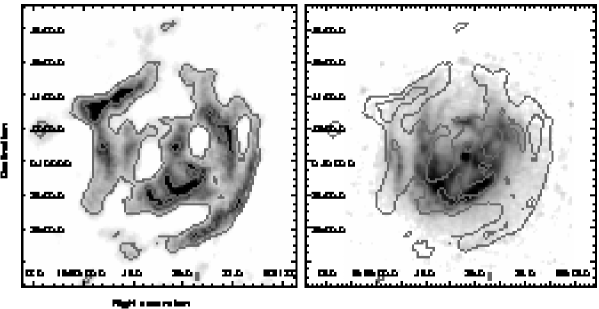
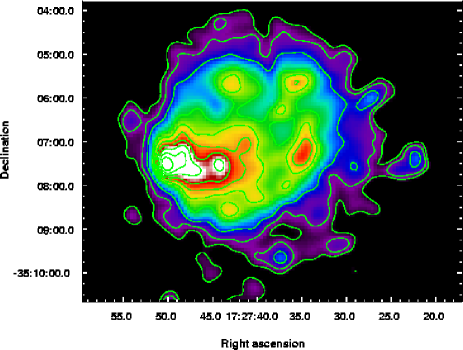
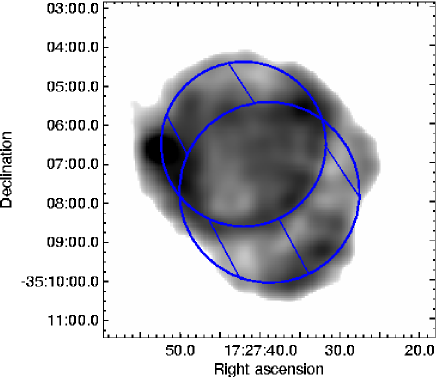
Figure 10 displays the broadband (0.15-0.8 keV) XMM-Newton EPIC image of the SNR G352.70.1. The EPIC, PN and MOS images were merged and smoothed with a 8′′ (FWHM) Gaussian. This new high angular resolution image shows considerable clumpy structures and diffuse emission filling the interior of the remnant. The outermost and faintest X-ray emission traces an almost circular boundary about 6′ in diameter. Most of the X-ray emission is concentrated in an elongated feature, whose strongest X-ray peak lies in the eastern border of the remnant, centered on about 17. Three remarkable bright knots appear at the north and west border of G352.70.1 centered on about: 17; 17; and 17.
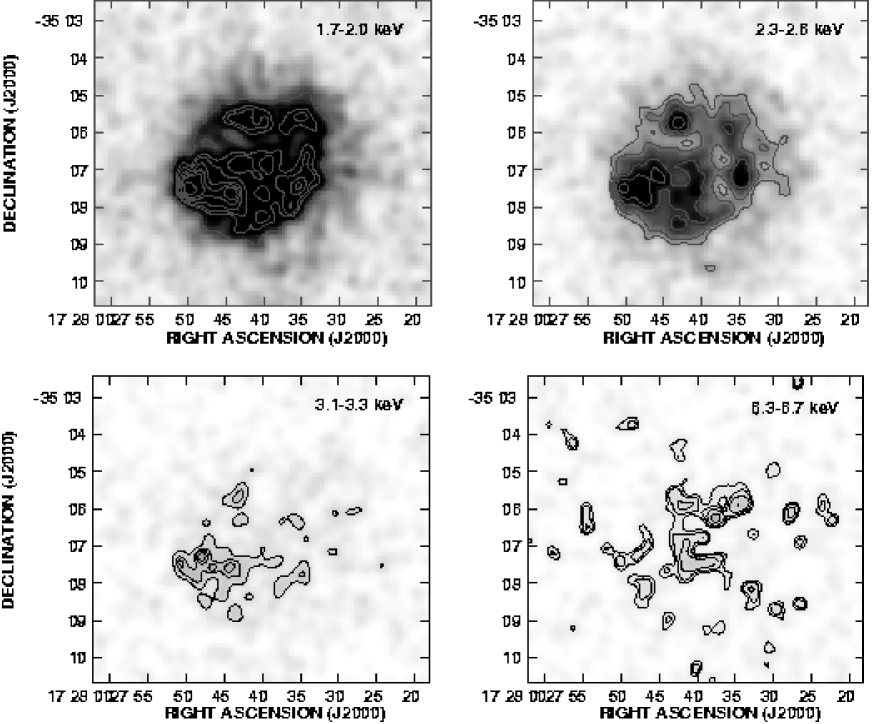
Narrowband images centered on the Si (1.7-2 keV), S (2.3-2.6 keV), Ar (3.1-3.3 keV), and Fe (6.3-6.7 keV) emission are displayed in Fig. 11. The same grayscale is used for all the images to provide a comparative view of the X-ray emission distribution. In contrast, the contour levels vary from an image to the other to emphasize the most significant features in each one. From this figure, can be inferred that soft X-rays dominate the emission. The distribution of the emission in the energy bands centered on the Si and S lines does not show appreciable differences from the broadband image, while the image centered on the Ar line, instead, is remarkable only in the elongated brightest X-ray feature in the southeast. The distribution of the Fe emission line band is more clumpy and anti-correlated with the other bands, except for the northern knot centered on 17, which is the only X-ray feature detected in all four X-ray bands.
Using our high-resolution radio and X-ray images, we are able to compare for the first time both morphologies in great detail. Figure 9 (right) shows a grayscale XMM-Newton image with some radio contours at 4.8 GHz superimposed. The improved X-ray image shows that X-ray emission is confined to within the inner radio shell, filling it completely. In general, there is no positional correspondence between the radio synchrotron and the thermal X-ray emitting plasmas, except for the already noted correspondence near Dec. , where the bright X-ray spots coincide with the two radio maxima detected in the interior of the radio shell, while the brightest X-ray features, close to 17, lack any conspicuous radio counterpart. The eastern radio point sources, WBH2005 352.7750.153 and WBH2005 352.7720.149, do not have any X-ray counterpart, confirming that they are unrelated to the SNR.
5.4 X-ray spectroscopy
We extracted the MOS1, MOS2, and PN spectra from a circular region of radius 2 centered on 17, which covers the entire X-ray emission observed. The background spectrum for the three instruments was taken from an annular source free region around the remnant with inner and outer radii of 4 and 4, respectively. G352.70.1 is located in the Galactic ridge region, known to have enhanced thin thermal emission. However, as discussed by Kinugasa et al. (1998), variations in the background with latitude and longitude in this region, can be neglected.
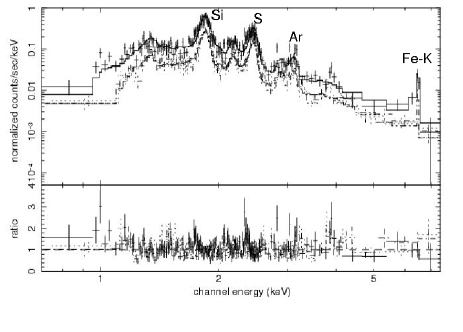
The data were simultaneously fit in the 0.7-7.5 keV energy band with a non-equilibrium ionization collisional plasma model (Borkowski et al., 2001), assuming a constant temperature and single ionization parameter, combined with interstellar absorption. The absorption, plasma temperature, ionization timescale, normalization, and abundances of S, Si, and Ar were considered to be free parameters in the model. We verified that allowing other elemental abundances to vary did not significantly improve the model fit, hence there were frozen to the solar values of Anders & Grevesse (1989). An additional zero-width Gaussian component was needed to model the Fe K emission resulting in a line centroid at 6.46 0.03 keV, which would be consistent with emission caused by Fe K fluorescence. We obtained a statistically good fit (with a reduced of 1.25 for 594 degrees of freedom), the results of which are listed in Table LABEL:G352xrayfit and plotted in Fig. 12. As can be seen, the best fit requires significant over abundances of S, Si, and Ar with respect to their solar values, which indicates the presence of ejecta material. The Fe L abundance does not differ significantly from the solar value, which argues in favor of a core collapse SN. However, this cannot fully constrain the progenitor explosion because the relative lack of Fe could only be explained if the innermost ejecta layers have not yet been shocked (Rakowski et al., 2006). Regarding the Fe K line at an energy of 6.46 keV, it has also been observed in other young SNRs such as Tycho (Hwang & Gotthelf, 1997), Kepler (Kinugasa & Tsunemi, 1999), and RCW86 (Bamba et al., 2000), and also in G344.7-0.1 (Yamauchi et al., 2005). The origin of this line is not well understood.
| Parameters | Values |
|---|---|
| kT (keV) | 1.9 0.2 |
| (s cm-3) | 4.5 |
| Si abundance | 2.4 0.2 |
| S abundance | 3.8 0.3 |
| Ar abundance | 4.7 1.2 |
| NH (cm-2) | 2.6 0.3 1022 |
We searched for spectral variations across the remnant by individually extracting the spectrum of each of the most conspicuous X-ray features and the diffuse emission. This procedure was performed separately for each instrument. We found no significant difference in the fit parameters for any of them compared with the global model.
Based on the emission measure (EM) determined from our spectral fitting and a distance of 7.5 kpc, we can estimate the electron density of the plasma to be ne = (EM/V)cm-3, where V is the volume of the X-ray emitting plasma considered in this case to be a sphere of 2′.5 of radius, and the hydrogen number density, ne = nH, for simplicity. The age of the remnant, estimated to be /ne, is found to be 4700 yr, and the mass of the X-ray emitting gas is M= neVmH , where mH is the hydrogen atomic mass. For a shock temperature of kT = 1.9 keV, the shock velocity would be vs = (16kT/3 mH) km s-1 (with a mean atomic weight =0.61). For the preceding numerical values, we estimated the supernova explosion energy E to be about 1050 erg, which is the standard value for SN explosions. Based on the NEI fit to the spectrum of the entire remnant in the (0.7-7.5) keV energy band, we estimate the X-ray luminosity to be L erg s-1 for a distance of 7.5 kpc. This value can be compared with the radio luminosity calculated on the basis of the flux density measurement at 1465 MHz carried out by Dubner et al. (1993) to obtain L erg s-1, and a ratio LX/L.
5.5 Discussion
Kinugasa et al. (1998) described the X-ray emission of G352-70.1 as shell-type with a ring morphology similar to that observed in the radio band. However, our new sensitive XMM-Newton image of this SNR indicates that the X-ray emission completely fills the interior of the radio remnant. Although the centroid of the X-ray emission lies over the eastern half of the remnant, both the observed morphology and the thermal nature of the emission with a flat radial temperature profile, allow us to re-classify G352.70.1 as a mixed-morphology remnant, i.e., shell-type in radio and filled-center in X-rays (Rho & Petre, 1998). The X-ray emitting plasma has not yet reached the ionization equilibrium, as expected for young remnants, and has enhanced metal abundances, indicative of an ejecta origin.
The observed morphology matches a “barrel-shaped” model fairly well for the radio SNR (that is, a structure with cylindrical geometry in space, as discussed by Manchester 1987 and Gaensler 1998) with a peculiar viewing angle as depicted in Fig. 13. To produce this figure we used the VLA image at 1.4 GHz from Dubner et al. (1993), which recovered all the flux density. The radio emission appears to be enhanced in the directions where our line of sight crosses a longer path through the SNR. As proposed by Manchester (1987), the bilateral enhancements observed in “barrel-shaped” SNRs can originate in a biconical flow from the pre-supernova star, from the supernova explosion itself, or from an associated pulsar or X-ray binary system, and is probably formed early in the life of the remnant. In the case of G352.70.1, which is known not to harbor a pulsar in its interior, the origin of the observed appearance must be connected with the massloss history of the progenitor star. In this context, Manchester (1987) proposed that a biannular or double ring morphology can be produced when the SN shock expands through the axially symmetric wind of a red supergigant (RSG) phase of a massive star. Typical parameters for the RSG phase are a wind velocity of about 20 km s-1 and a lifetime of about 3 yr (Smith, 1994). This wind perturbs a region with a radius of 6 pc, a size comparable to the radius of G352.70.1. The X-ray spectrum results, which favor a type II explosion for this SN, confirm a scenario that involves a massive star precursor.
6 Conclusions
| Kes 79 | G352.70.1 | |
|---|---|---|
| Radio flux density | at 74 MHz = 76 Jy | |
| at 324 MHz = 39Jy | ||
| at 1.5 GHz = 11 Jy | ||
| Radio spectral index | -0.58 | |
| Distance | 7 kpc | 7.5 kpc |
| Age | 15000 yr | 5000 yr |
| X-ray-to-Radio Luminosity | 100 | 20 |
| Elemental abundances | Shocked CSM and ISM | Ejecta |
| Scenario | Core collapse of an O9 star | Interaction with an asymmetric progenitor wind |
| within a wind-driven bubble | resulting in a “barrel-shaped” SNR | |
| plus projection | plus viewing angle and projection |
We have analyzed new high resolution and sensitivity VLA images as well as archival radio and XMM-Newton X-ray data of two galactic SNRs, Kes 79 and G352.70.1, which share a common multi-shell radio morphology. In addition, we have investigated the ISM in the direction of both remnants to probe the conditions of their surroundings.
New radio features detected in the image of Kes 79 at 324 MHz considerably improve the correspondence with the X-ray emission distribution of this remnant. Based on our new radio data and flux density estimates taken from the literature, we derived a global spectral index of , constant over four decades in frequency with no significant turnover down to 74 MHz. The new 74 and 324 MHz data and the reprocessed 1500 MHz data were combined to perform the first careful, spatially resolved study of the synchrotron spectrum in Kes 79, concluding that the radio spectrum is homogeneous, with no detectable variations associated with shells, maxima, or any other morphological feature. We have also confirmed that down to about 5.8 mJy beam-1, neither a radio counterpart to the X-ray pulsar CXOU J185238.6+004020, nor a surrounding PWN is observed. Our study confirms that Kes 79 is the result of a core-collapse SNe evolving close to a molecular cloud and within the wind-blown bubble created by its precursor. The average X-ray spectral properties are well described by a non-equilibrium ionization collisional plasma model with constant temperature across the remnant and solar abundances. The observed multishell appearance of Kes 79 can be described as the final product of possibly a O9 star exploding within the cavity created by previous episodes of mass loss and evolving near the parent molecular cloud. The precursor wind has swept up the surrounding gas forming a thick HI shell. A scenario in which the multishell morphology originated from multiple shocks produced after the encounter of the blast wave with a density jump in the surroundings, could explain the observations.
In the case of the SNR G352.70.1, the new VLA image at 4.8 GHz uncovered considerable clumpy structures on small scales, confirming that the bright spot previously observed on the eastern limb is produced by a double extragalactic radio source. The new XMM-Newton image shows several knots of emission and diffuse thermal emission filling the interior of the remnant. The X-ray spectral investigation inferred enhanced abundances, which imply the presence of SN ejecta in this SNR. From the morphology and spectral properties of G352.70.1, we classify this remnant as belonging to the mixed-morphology category. The observed appearance can be the consequence of the propagation of the SN blast-wave within an axially symmetric stellar wind blown out by the precursor star, forming a “barrel-shaped” SNR that is observed at a peculiar viewing angle.
The study of the surrounding interstellar gas around both SNRs allowed us to refine the distance estimate towards these two Galactic SNRs, obtaining a distance of kpc for Kes 79, and kpc for G352.70.1. Table 5 summarizes the main findings of the present study.
Acknowledgements.
We thanks the anonymous referee for helpful comments.This research was partially funded by Argentina Grants awarded by ANPCYT, CONICET and University of Buenos Aires (UBACYT A023). This work is based on observations done with the XMM-Newton, an ESA science mission with instruments and contributions directly funded by ESA Member States and the US (NASA). The Canadian Galactic Plane Survey is a Canadian project with international partners, and is supported by the Natural Sciences and Engineering Research Council (NSERC). NL and MS are thankful to the companies INSA and Selex I. S. resp. for a financial support for the publication of this paper.References
- Altenhoff et al. (1970) Altenhoff, W. J., Downes, D., Goad, L., Maxwell, A., & Rinehart, R. 1970, A&AS, 1, 319
- Anders & Grevesse (1989) Anders, E. & Grevesse, N. 1989, Geochim. Cosmochim. Acta., 53, 197
- Baars et al. (1977) Baars, J. W. M., Genzel, R., Pauliny-Toth, I. I. K., & Witzel, A. 1977, A&A, 61, 99
- Bamba et al. (2000) Bamba, A., Koyama, K., & Tomida, H. 2000, PASJ, 52, 1157
- Banas et al. (1997) Banas, K. R., Hughes, J. P., Bronfman, L., & Nyman, L.-A. 1997, ApJ, 480, 607
- Beard & Kerr (1969) Beard, M. & Kerr, F. J. 1969, Australian Journal of Physics, 22, 121
- Becker & Kundu (1975) Becker, R. H. & Kundu, M. R. 1975, AJ, 80, 679
- Borkowski et al. (1996) Borkowski, K., Szymkowiak, A. E., Blondin, J. M., & Sarazin, C. L. 1996, ApJ, 466, 866
- Borkowski et al. (2001) Borkowski, K. J., Lyerly, W. J., & Reynolds, S. P. 2001, ApJ, 548, 820
- Cappa et al. (2005) Cappa, C., Niemela, V. S., Martín, M. C., & McClure-Griffiths, N. M. 2005, A&A, 436, 155
- Case & Bhattacharya (1998) Case, G. L. & Bhattacharya, D. 1998, ApJ, 504, 761
- Castelletti et al. (2007) Castelletti, G., Dubner, G., Brogan, C., & Kassim, N. E. 2007, A&A, 471, 537
- Caswell et al. (1981) Caswell, J. L., Milne, D. K., & Wellington, K. J. 1981, MNRAS, 195, 89
- Caswell et al. (1975) Caswell, J. L., Murray, J. D., Roger, R. S., Cole, D. J., & Cooke, D. J. 1975, A&A, 45, 239
- Chevalier (1974) Chevalier, R. A. 1974, ApJ, 188, 501
- Cichowolski et al. (2008) Cichowolski, S., Pineault, S., Arnal, E. M., & Cappa, C. E. 2008, A&A, 478, 443
- Costain (1960) Costain, C. H. 1960, MNRAS, 120, 248
- Dame & Thaddeus (2008) Dame, T. M. & Thaddeus, P. 2008, ApJ, 683, L143
- Dickel (1973) Dickel, J. R. 1973, Australian Journal of Physics, 26, 369
- Dickman (1978) Dickman, R. L. 1978, ApJS, 37, 407
- Dubner et al. (1993) Dubner, G. M., Moffett, D. A., Goss, W. M., & Winkler, P. F. 1993, AJ, 105, 2251
- Dulk & Slee (1972) Dulk, P. & Slee, O. 1972, Australian Journal of Physics, 25, 429
- Dwarkadas (2005) Dwarkadas, V. V. 2005, ApJ, 630, 892
- Englmaier et al. (2008) Englmaier, P., Pohl, M., & Bissantz, N. 2008, ArXiv e-prints
- Fich et al. (1989) Fich, M., Blitz, L., & Stark, A. A. 1989, ApJ, 342, 272
- Franco et al. (1991) Franco, J., Tenorio-Tagle, G., Bodenheimer, P., & Rozyczka, M. 1991, PASP, 103, 803
- Gaensler (1998) Gaensler, B. M. 1998, ApJ, 493, 781
- Gaensler & Slane (2006) Gaensler, B. M. & Slane, P. O. 2006, ARA&A, 44, 17
- Garmany et al. (1981) Garmany, C. D., Olson, G. L., van Steenberg, M. E., & Conti, P. S. 1981, ApJ, 250, 660
- Giacani & Dubner (2004) Giacani, E. & Dubner, G. 2004, A&A, 413, 225
- Gotthelf et al. (2005) Gotthelf, E. V., Halpern, J. P., & Seward, F. D. 2005, ApJ, 627, 390
- Green (1989) Green, D. A. 1989, MNRAS, 238, 737
- Green (2009) Green, D. A. 2009, VizieR Online Data Catalog, 7253, 0
- Green & Dewdney (1992) Green, D. A. & Dewdney, P. E. 1992, MNRAS, 254, 686
- Gvaramadze (2006) Gvaramadze, V. V. 2006, The Ultraviolet Universe: Stars from Birth to Death, 26th meeting of the IAU, Joint Discussion 4, 16-17 August 2006, Prague, Czech Republic, JD04, #2, 4
- Halpern et al. (2007) Halpern, J. P., Gotthelf, E. V., Camilo, F., & Seward, F. D. 2007, ApJ, 665, 1304
- Hwang & Gotthelf (1997) Hwang, U. & Gotthelf, E. V. 1997, ApJ, 475, 665
- Jackson et al. (2006) Jackson, J. M., Rathborne, J. M., Shah, R. Y., et al. 2006, ApJS, 163, 145
- Kassim (1989) Kassim, N. E. 1989, ApJS, 71, 799
- Kassim (1992) Kassim, N. E. 1992, AJ, 103, 943
- Kesteven (1968) Kesteven, M. J. L. 1968, Australian Journal of Physics, 21, 369
- Kinugasa et al. (1998) Kinugasa, K., Torii, K., Tsunemi, H., et al. 1998, PASJ, 50, 249
- Kinugasa & Tsunemi (1999) Kinugasa, K. & Tsunemi, H. 1999, PASJ, 51, 239
- Koo & McKee (1992) Koo, B.-C. & McKee, C. F. 1992, ApJ, 388, 93
- Kovalenko et al. (1994) Kovalenko, A. V., Pynzar’, A. V., & Udal’Tsov, V. A. 1994, Astronomy Reports, 38, 784
- Kundu & Velusamy (1967) Kundu, M. R. & Velusamy, T. 1967, Annales d’Astrophysique, 30, 723
- Manchester (1987) Manchester, R. N. 1987, A&A, 171, 205
- McClure-Griffiths et al. (2005) McClure-Griffiths, N. M., Dickey, J. M., Gaensler, B. M., et al. 2005, ApJS, 158, 178
- Prinja et al. (1990) Prinja, R. K., Barlow, M. J., & Howarth, I. D. 1990, ApJ, 361, 607
- Rakowski et al. (2006) Rakowski, C. E., Badenes, C., Gaensler, B. M., et al. 2006, ApJ, 646, 982
- Reich et al. (1990) Reich, W., Reich, P., & Fuerst, E. 1990, A&AS, 83, 539
- Reynoso et al. (1997) Reynoso, E. M., Goss, W. M., Dubner, G. M., Winkler, P. F., & Schwarz, U. J. 1997, A&A, 317, 203
- Rho & Petre (1998) Rho, J. & Petre, R. 1998, ApJ, 503, L167
- Scoville et al. (1987) Scoville, N. Z., Yun, M. S., Sanders, D. B., Clemens, D. P., & Waller, W. H. 1987, ApJS, 63, 821
- Seward et al. (2003) Seward, F. D., Slane, P. O., Smith, R. K., & Sun, M. 2003, ApJ, 584, 414
- Slane et al. (2002) Slane, P., Chen, Y., Lazendic, J. S., & Hughes, J. P. 2002, ApJ, 580, 904
- Slee (1977) Slee, O. B. 1977, Australian Journal of Physics Astrophysical Supplement, 43, 1
- Smith (1994) Smith, L. J. 1994, in Circumstellar Media in Late Stages of Stellar Evolution, ed. R. E. S. Clegg, I. R. Stevens, & W. P. S. Meikle, 64
- Sun et al. (2004) Sun, M., Seward, F. D., Smith, R. K., & Slane, P. O. 2004, ApJ, 605, 742
- Taylor et al. (2003) Taylor, A. R., Gibson, S. J., Peracaula, M., et al. 2003, AJ, 125, 3145
- Turtle et al. (1962) Turtle, A. J., Pugh, J. F., Kenderdine, S., & Pauliny-Toth, I. I. K. 1962, MNRAS, 124, 297
- Uyanıker et al. (2002) Uyanıker, B., Reich, W., Yar, A., Kothes, R., & Fürst, E. 2002, A&A, 389, L61
- Velázquez et al. (2001) Velázquez, P. F., de la Fuente, E., Rosado, M., & Raga, A. C. 2001, A&A, 377, 1136
- Velusamy et al. (1991) Velusamy, T., Becker, R. H., & Seward, F. D. 1991, AJ, 102, 676
- White et al. (2005) White, R. L., Becker, R. H., & Helfand, D. J. 2005, AJ, 130, 586
- Wilner et al. (1998) Wilner, D. J., Reynolds, S. P., & Moffett, D. A. 1998, AJ, 115, 247
- Yamauchi et al. (2005) Yamauchi, S., Ueno, M., Koyama, K., & Bamba, A. 2005, PASJ, 57, 459