Scaling relation for determining the critical threshold for continuum percolation of overlapping discs of two sizes
Abstract
We study continuum percolation of overlapping circular discs of two sizes. We propose a phenomenological scaling equation for the increase in the effective size of the larger discs due to the presence of the smaller discs. The critical percolation threshold as a function of the ratio of sizes of discs, for different values of the relative areal densities of two discs, can be described in terms of a scaling function of only one variable. The recent accurate Monte Carlo estimates of critical threshold by Quintanilla and Ziff [Phys. Rev. E, 76 051115 (2007)] are in very good agreement with the proposed scaling relation.
In recent years, there has been a lot of interest in studying continuum percolation, owing to its many applications. For a review on continuum percolation, see meester_book . Continuum percolation of overlapping objects of various sizes and shapes, spheres and discs scher ; consiglio ; quintanilla01 ; gawlinski ; phani , ellipsoids sastry , plates yi , sticks balberg , oriented cubes stanley etc., has been studied. In applications like the modeling of porous media, one of the most important parameters is the distance from percolation threshold, and several approximation schemes have been proposed to determine the percolation threshold for different types of disorder.
In this paper, we discuss the case of continuum percolation of overlapping discs of two sizes in a plane. We propose a phenomenological equation for the increase in the effective size of the larger discs in the presence of the smaller discs. We check our theory against data on critical thresholds by Quintanilla and Ziff quintanilla_ziff . The agreement is found to be very good.
We consider a percolation model of a mixture of circular discs of two sizes randomly placed in a plane. Consider a finite area and randomly drop discs in . The probability that a given small areal element contains the center of a dropped disc is , independent of other discs. Once a center of the disc is chosen, it is assigned a radius with probability , and with probability . We denote the ratio of radii by . The number density of discs with radius is then , and that of radius is . The total number density of discs, irrespective of radius, is . We propose an approximate formula for the critical percolation threshold in terms of and . We express this function of two variables in terms of the function which gives the correlation length as a function of the areal density of single-sized discs.
The earliest proposal for determining the critical threshold for overlapping discs was by Scher and Zallen scher . They noted that the total covered fractional area at critical threshold was nearly constant for a mixture of discs of different sizs, if the polydispersity of the mixture was small. However, if the polydispersity is large, and one takes discs with several different radii, the total covered fraction at critical threshold can be made as close to one as we wish phani . The original heuristic arguments have been made rigorous later meester .
We start by summarizing the qualitative arguments of phani . Let us assume, without any loss of generality, that the . We consider the plane on which the smaller discs of radius each have been thrown in randomly with discs per unit area. The areal density of these discs is then . Note that is a dimensionless number giving the ratio of total area of discs thrown in to the area of the plane. In the case of percolation of discs of equal radii, the areal density of the discs at the percolation threshold is independent of the size of the discs. Let this critical value of be denoted by . We assume that is below critical threshold , and the small discs by themselves do not percolate. From numerical simulations, the value of is known quite accurately . The corresponding value of the covered area fraction is given by quintanilla_ziff .
The two point correlation function, , is defined as as the probability that two points at a distance from each other, chosen at random, belong to the same cluster when only the smaller discs have been dropped. Below criticality, this decays exponentially with distance, i.e., . And using simple scaling invariance of the problem , we have
| (1) |
where the function determines how the correlation length varies with areal density, and is independent of .
Now we throw in a single disc of the larger radius , and look at the cluster of discs that are connected to this single large disc. Then, each such cluster looks like a somewhat bigger fuzzy disc of size . Let us assume that the variation between different clusters may be neglected. This approximation is quite good if , but less valid if is not so large. The percolation problem can then be considered as a percolation of these larger effective discs. The number density of these effective larger equal-sized discs of radius that have to be dropped to reach criticality is given by
| (2) |
We will consider this equation as the definition of .
In phani , the simple approximation
| (3) |
was used, where is some constant of order one. This gives the correct limiting behavior that for any initial density of the smaller discs, the critical value of the areal density of larger discs tends to as tends to infinity, keeping fixed. Also, the other limit when we keep fixed at any value below , and slowly increase till we reach critical percolation, then the critical value of to reach criticality tends to as tends to zero meester .
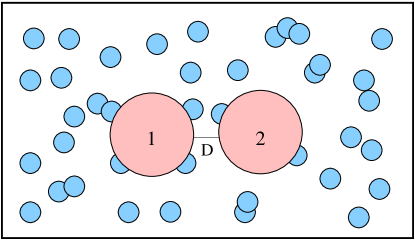
However, Eq.(3) strongly underestimates the value of . Consider two discs of radius thrown in a sea of randomly dropped smaller discs of areal density . Call these discs 1 and 2 and, let the minimum distance between these discs be denoted by (Fig. 1). We denote by the probability that there is a path of overlapping smaller discs between the larger discs, and they belong to the same cluster. Thus, is a measure of the connectivity correlations in the problem of percolation of single-sized discs.
Clearly, is a decreasing function of the separation , which will decrease exponentially from to , as varies from to infinity. For large , this decreases as . The dependence of this on comes from the fact that the prefactor of the exponential would depend on . Also, for comparable to , the -dependence can not be approximated well by a simple exponential. However, we can define an effective size by the requirement that this probability is a fixed value, say , when . Then, a better estimate of than Eq. (3) is given by
| (4) |
The as defined is a function of and (or, equivalently ). For comparable to , we cannot use the large exponential decay of to estimate . However, if , then we can assume that the leading dependence is from , and correction terms involving powers of can be neglected. Then, , to leading order, is only a function of and . Using the fact that the probabilities are invariant if all distances are scaled by same factor, we get
| (5) |
where is some, as yet unspecified, scaling function of its argument . Now, clearly, is a monotonically increasing function of , which tends to as tends to infinity, keeping fixed, as then the problem is that of percolation in a very long strip, and somewhere or other, there will be a connection of smaller discs. This implies that must tend to infinity if tends to infinity. Also, in the case , it must tend to infinity as tends to infinity. The simplest form of that is consistent with these requirements is a simple power-law form, which gives
| (6) |
Here is some constant of order . The main improvement in this form over Eq.(3) is the inclusion of dependence on .
The power-law dependence of on is seen most easily by considering a perturbation expansion of in powers of . Let
| (7) |
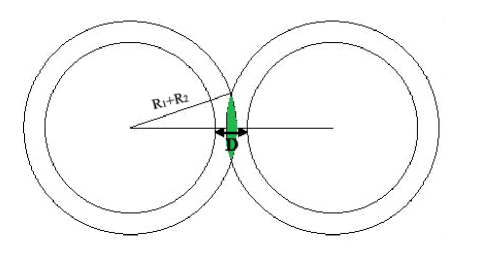
In the first order in , the configurations that contribute to are those where a single small disc overlaps with both the bigger discs. This is possible only if , and in that case, if there is at least one small disc in the region which is within a distance from the centers of the discs and ( See Fig. 2). For small , the probability of this event is proportional to the area of the shaded region in Fig. 2. Using elementary geometry, it is easily seen that for , the area is proportional to . Thus we get
| (8) |
Thus, we see that , and by extension has a strong dependence on . Of course, for , higher order terms in make significant contribution, and they would change the precise form of the functional dependence on .
Again, we assume that the larger discs act as discs of radius , with , given by Eq.(6). Expressing in terms of , the areal density of the larger discs, the criticality condition may be written as
| (9) |
The above equation is clearly invariant under scaling of all lengths by the same factor. We can determine the value of , in the limit . Then, assume . Then, implies that .
Clearly, the number density of additional discs of radius required to reach criticality would be less than with discs of size . Hence, in terms of areal densities, this bound becomes . Also, as discussed in phani , the total areal density of discs at criticality is greater than when all discs are not of same size, , Thus, . Then, . Since it is known that for near , with . Thus, comparing powers of we see that .
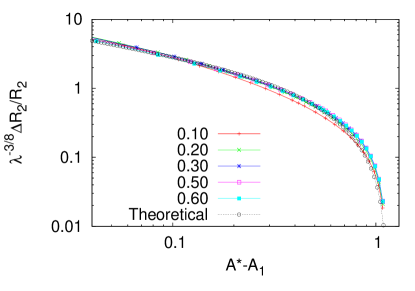
Our proposed approximation can be directly checked against numerical data. Quintanilla and Ziff have given a very extensive table of data giving different values of for different values of , that define critical surface data . Using Eq.(9), if we plot versus , all points should fall on a single curve . The result is shown in Fig. 3, where we have plotted data corresponding to five different values of and We get a very good collapse. We do not show other values, in order not to clutter up the figure, but have checked that the collapse is as good with them as well. Note that no free parameters have been used to generate the scaling collapse.
Define . The function , which gives the equation of the curve is in principle calculable if we can solve the problem of percolation probability with single sized discs. As of now, we only know the behavior of in certain regimes. For small , and for near , varies as . Hence we parameterize the curve as
| (10) |
The values and , give a fairly good fit. The curve using these fitting parameters is also shown in Fig. 2.
We would like to thank Prof. R. M. Ziff, for useful correspondence. ACB thanks Kishore Vaigyanik Protsahan Yojana for financial support, and TIFR for hospitality during his visit. DD would like to acknowledge the financial support from the Department of Science and Technology, Government of India, through a JC Bose Fellowship.
References
- (1) R. Meester and R. Roy, Continuum Percolation (Cambridge University Press, Cambridge, 1996).
- (2) H. Scher and R. Zallen, J. Chem. Phys., 53 3759 (1970).
- (3) R. Consiglio, D. R. Baker, G. Paul and H. E. Stanley, Physica A 319 (2003) 49 55
- (4) J. Quintanilla, Phys. Rev. E 63, 061108 (2001).
- (5) E. T. Gawlinski and H. E. Stanley, J. Phys. A: Math. Gen. 14 (1981) L291-L299.
- (6) M. K. Phani and D. Dhar, J. Phys. A: Math. Gen. 17 (1984)
- (7) Y.-B. Yi, C.-W. Wang, A. M. Sastry, J. Electrochemical. Soc. 151 A1292 (2004).
- (8) Y. B. Yi and E. Tawerghi Phy. Rev E 79, 041134 (2009)
- (9) I. Balberg, N. Binenbaum and N. Wagner, Phys. Rev. Lett. 52, 1465-1468 (1984).
- (10) S. Sreenivasan, D. R. Baker, G. Paul, H. E. Stanley - Phys. Rev. E 66, 046136 (2002)
- (11) J. A. Quintanilla and R. M. Ziff, Phys. Rev. E 76 051115 (2007)
- (12) R. Meester, R. Roy and A. Sarkar, J. Stat. Phys., 75 123-134 (1994)
- (13) Supplementary information, provided with quintanilla_ziff .